September 20, 2022: ETH-USD (Ethereum) Elliott Wave and Technical Analysis – Video and Charts
Summary: It is possible that a low may now be in place for Ethereum in June 2022.
A third wave at primary and cycle degrees may have just begun. Confidence would come if price makes a new high above 3,573.96.
A possible target for primary wave 3 is calculated at 54,226.
The data used for this analysis comes from Yahoo Finance ETH-USD.
All charts are on a semi-log scale.
MAIN ELLIOTT WAVE COUNT
MONTHLY
Click chart to enlarge.
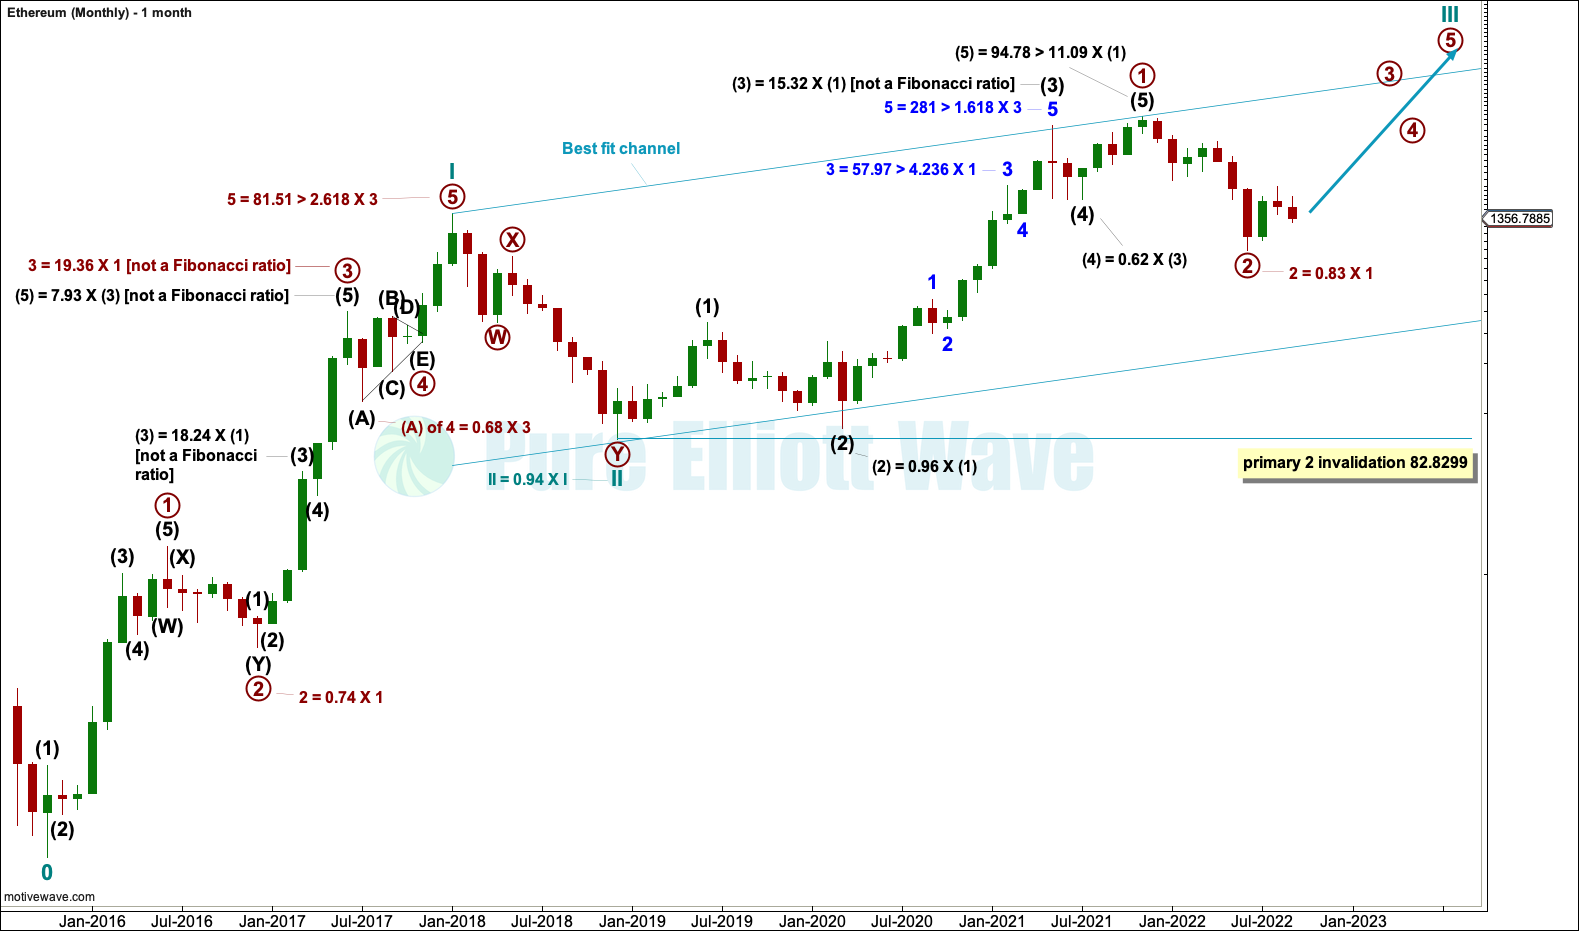
The monthly chart looks at the entire price history of Ethereum. The Elliott wave count begins at the low of October 2015.
From October 2015 to December 2017 this upwards wave subdivides perfectly as an Elliott wave impulse, labelled cycle wave I. The impulse lasted just over two years, which is within the expected duration for a cycle degree wave, so confidence that this degree of labelling is correct may be had.
Within cycle wave I, note that wave lengths noted on the chart are not Fibonacci ratios but guides to expected behaviour for Ethereum. Prior Ethereum price history exhibits very long third waves and fifth waves which are longer than third waves.
The depth of primary wave 2 and the deepest part of primary wave 4 within cycle wave I are also noted. Ethereum has had deep corrections, but not as deep as other cryptocurrencies, within cycle wave I.
Within cycle wave III, primary wave 2 may not move beyond the start of primary wave 1 below 82.8299. If primary wave 2 within cycle wave III is over at the last low, then it would be 0.83 of primary wave 1. This is a normal to be expected depth.
Cycle wave III may only subdivide as an impulse. It must move far enough above the end of cycle wave I to allow room for cycle wave IV to unfold and remain above cycle wave I price territory.
WEEKLY
Click chart to enlarge.
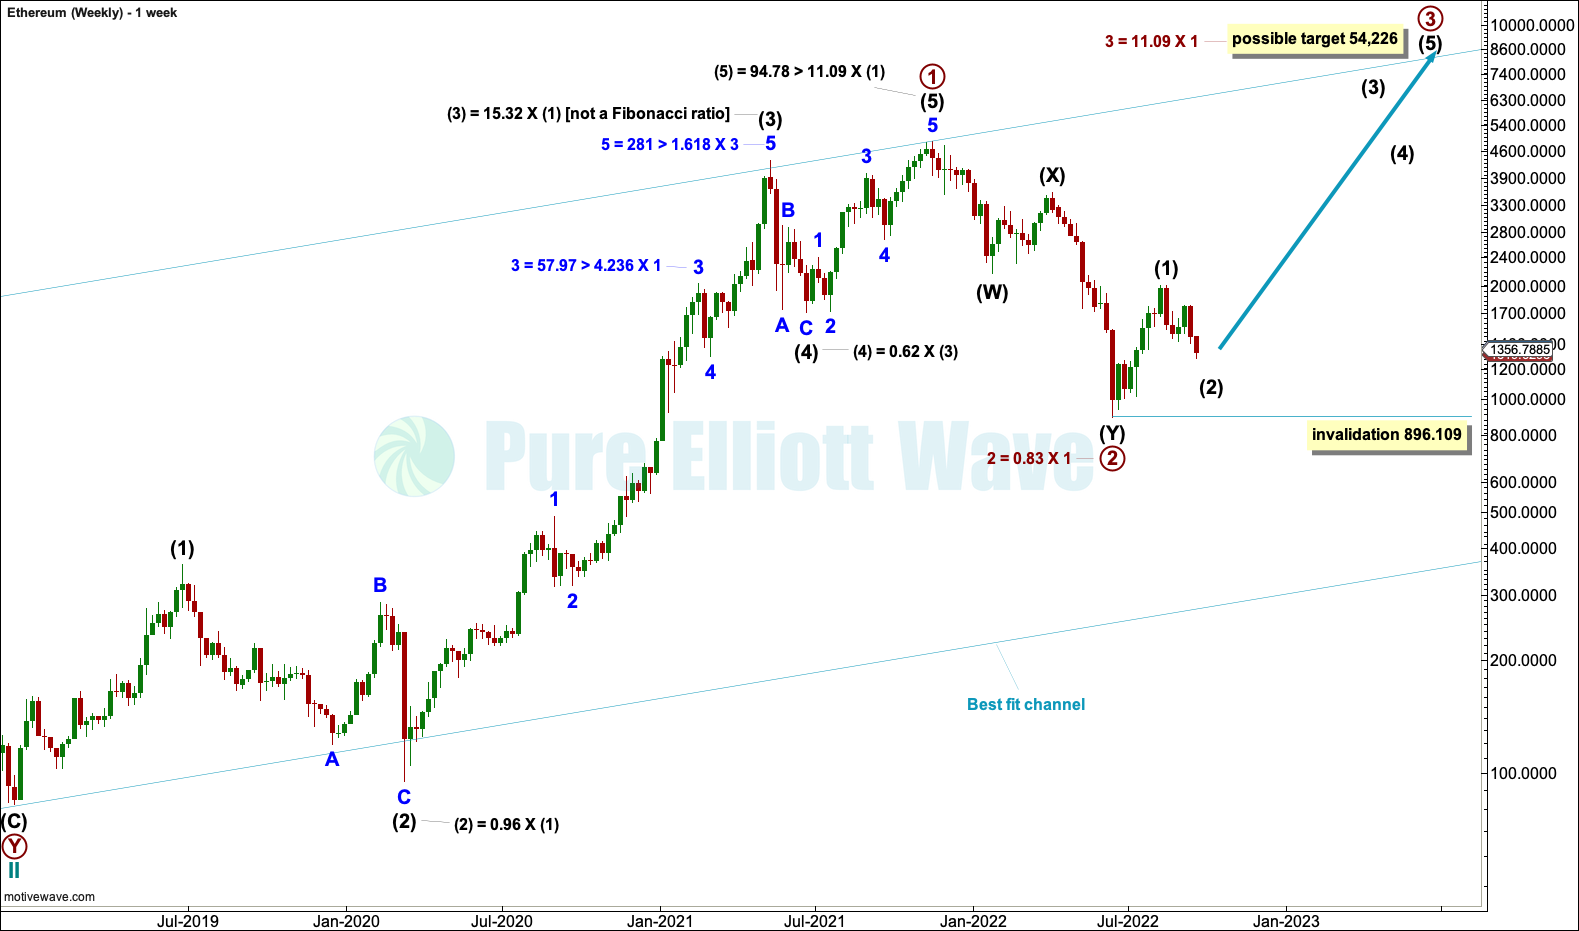
Ethereum does exhibit Fibonacci ratios between its actionary waves; they tend to be extreme Fibonacci ratios. Within primary wave 1, the ratios are noted on the chart.
The structure of primary wave 1 may be complete. Primary wave 2 may be a complete double zigzag.
Within primary wave 3: Intermediate wave (1) may now be complete and intermediate wave (2) may not move beyond the start of intermediate wave (1) below 896.109.
*How to read the notations: For example, for minor wave 3 within intermediate wave (3) the notation “3 = 57.97 > 4.236 X 1” is read as minor wave 3 was 57.97 longer than 4.236 the length of minor wave 1.
DAILY
Click chart to enlarge.
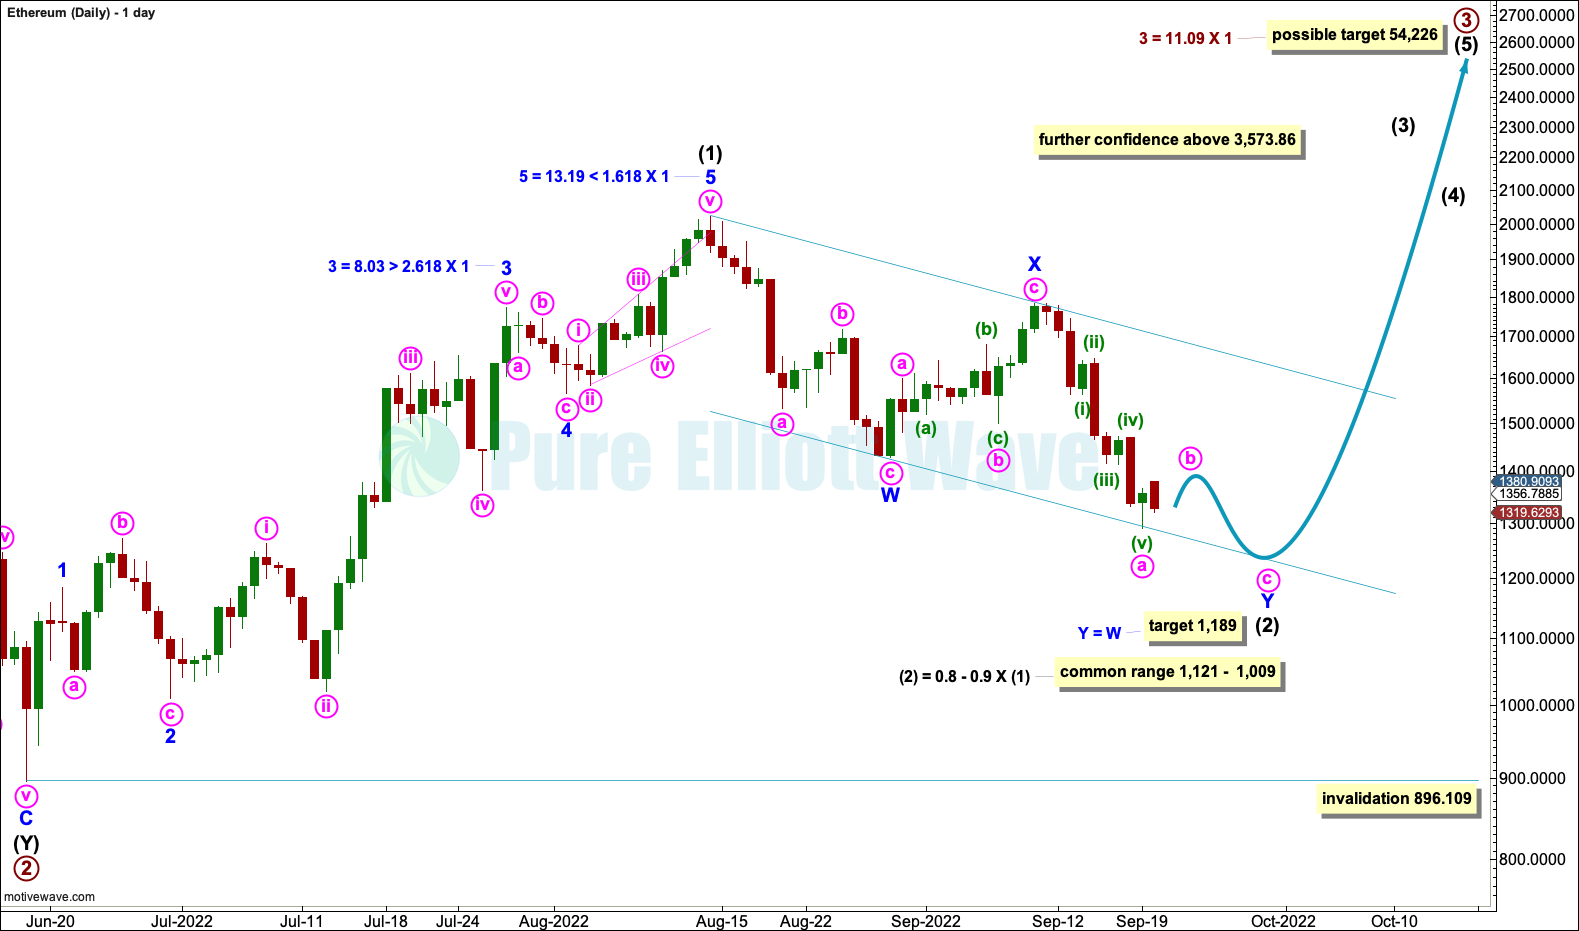
Within primary wave 3, intermediate wave (1) may be a complete five wave impulse that subdivides perfectly, and all three actionary waves of minor waves 1, 3 and 5 exhibit Fibonacci ratios.
Intermediate wave (2) may be continuing lower. Because the first wave down labelled minor wave W fits nicely as a zigzag and does not fit as well as a five wave motive structure, it is judged that intermediate wave (2) may most likely be unfolding as a double zigzag.
The first zigzag in the double is complete, labelled minor wave W. The double is joined by a three (a zigzag) in the opposite direction, labelled minor wave X. At the last low, a five wave impulse may be complete, which may be minute wave a within minor wave Y. Now minute wave b may move higher or sideways, and thereafter minute wave c may move lower to complete the second zigzag in the double, labelled minor wave Y.
Double zigzags are common structures. Triple zigzags are uncommon (although they are not very rare like running flats). When the second zigzag in a double may be complete, then the probability of the correction being over is high, as it would be uncommon for the structure to extend with a third zigzag.
Intermediate wave (2) may not move beyond the start of intermediate wave (1) below 896.109.
A target is calculated for minor wave Y to reach equality in length with minor wave W at 1,189. This target is just above a common range of 0.8 to 0.9 the depth of intermediate wave (1).
When intermediate wave (2) may be complete, then this wave count would expect a third wave up at intermediate, primary and cycle degree. Upwards movement should exhibit a strong increase in momentum and volume as it moves towards the middle of a large third wave, although it may start out slowly.
WEEKLY ALTERNATE

Click chart to enlarge.
Primary waves 1, 2, 3 and 4 within the impulse of cycle wave III may be complete.
Primary wave 2 was a deep 0.95 zigzag, lasting 37 weeks. Primary wave 4 may be a complete expanded flat, lasting 58 weeks.
It is common to see fourth waves within commodities and cryptocurrencies that are more brief than their counterpart second waves. Here, primary wave 4 is longer lasting than primary wave 2; this reduces the probability of this wave count to an alternate.
TECHNICAL ANALYSIS
WEEKLY
Click chart to enlarge.
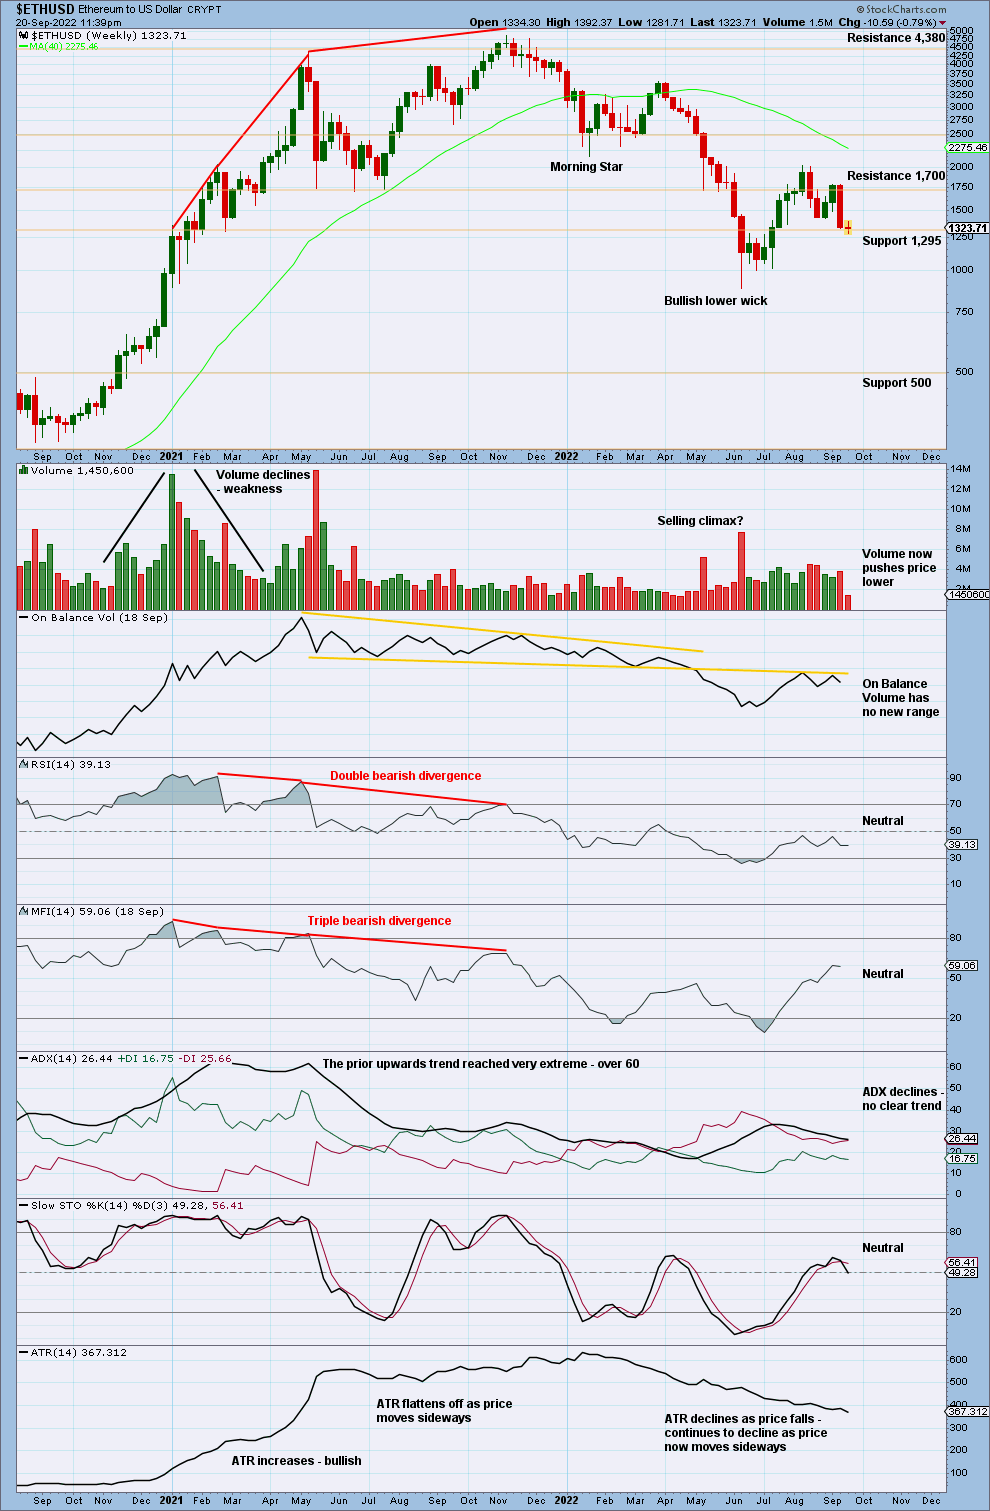
RSI reached oversold on the weekly chart at the low in June 2022. This has only happened once before, in December 2018, which was a sustainable low.
Downwards movement has some push from volume. A close near lows for the last completed week is bearish, at least for the short term. Next support is noted on the daily chart.
DAILY
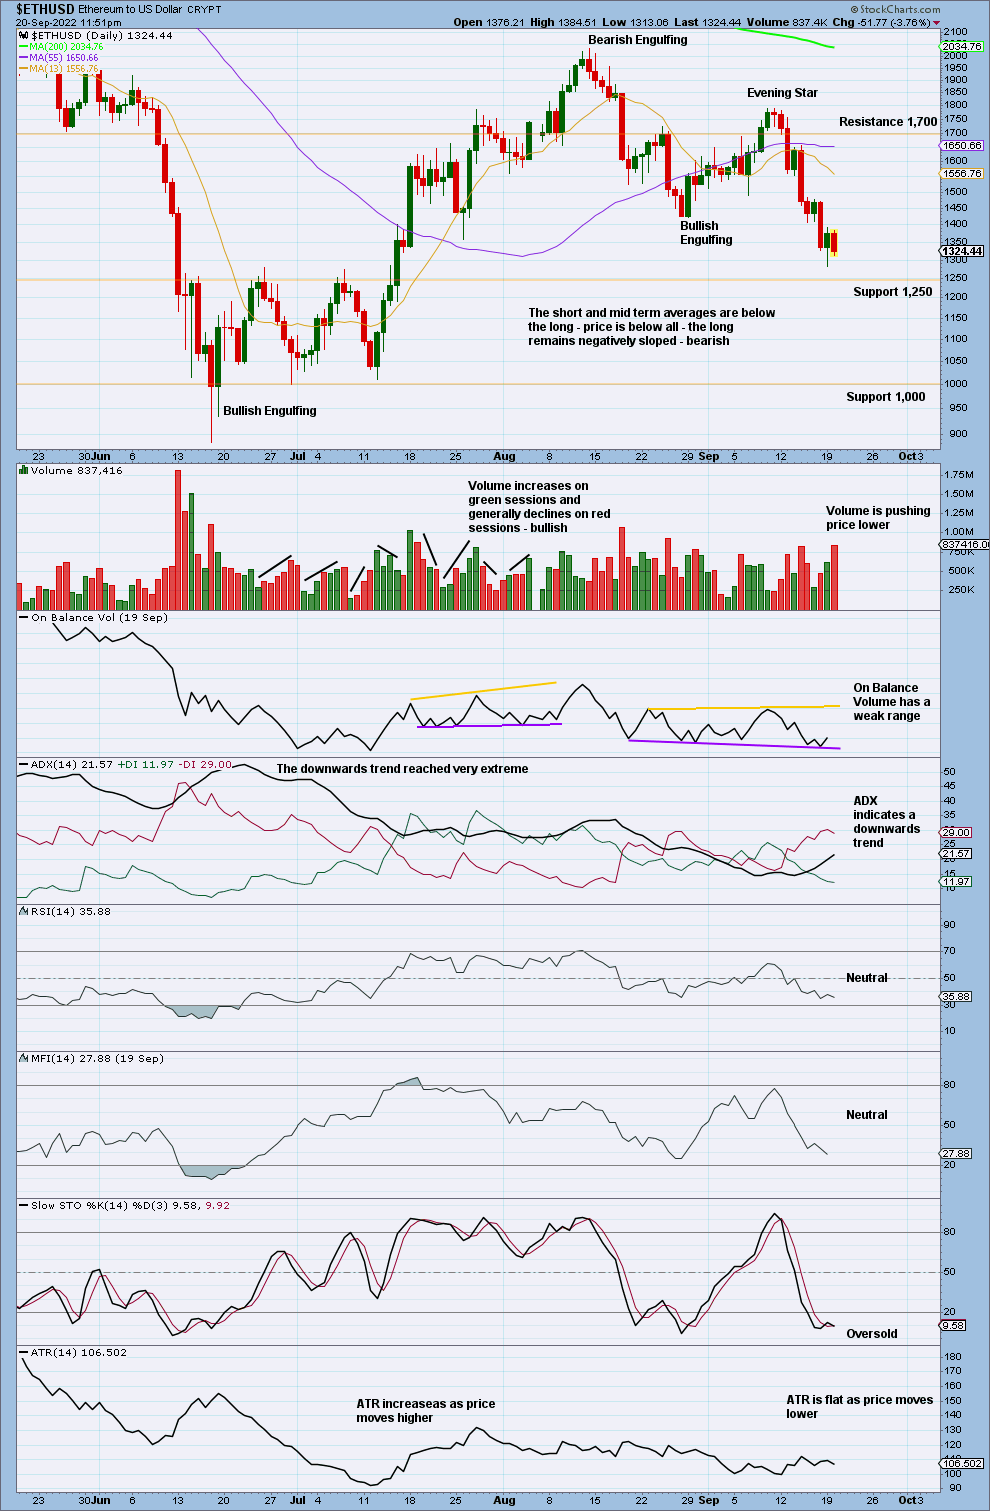
Click chart to enlarge.
Volume is pushing price lower. Look for next support about 1,250.
On Balance Volume may be giving a bearish signal. If the break below the purple support line is clear in another one or two sessions, then expect price to fall at least a little further.
Published @ 09:53 p.m. ET.
—
Careful risk management protects your investments.
Follow my two Golden Rules:
1. Invest only funds you can afford to lose.
2. Have an exit plan for both directions – where or when to take profit, and when to exit a losing investment.
—
New updates to this analysis are in bold.
–