March 7, 2023: ETH-USD (Ethereum) Elliott Wave and Technical Analysis – Video and Charts
Summary: The next bullish run for Ethereum is now expected to most likely have begun. A possible target for primary wave 3 may be 54,226. This target is conservative and may not be high enough. If the channel about the bear market is breached by upwards movement, then that would offer confidence in the main bullish Elliott wave count.
For the short term, another pullback may continue lower to the target for support about 1,291.97.
It remains possible that the bear market may continue to find further lows. A new high above 2,030.19 would invalidate this alternate wave count.
The data used for this analysis comes from CryptoCompare.
All charts are on a semi-log scale.
MAIN ELLIOTT WAVE COUNT
MONTHLY
Click chart to enlarge.
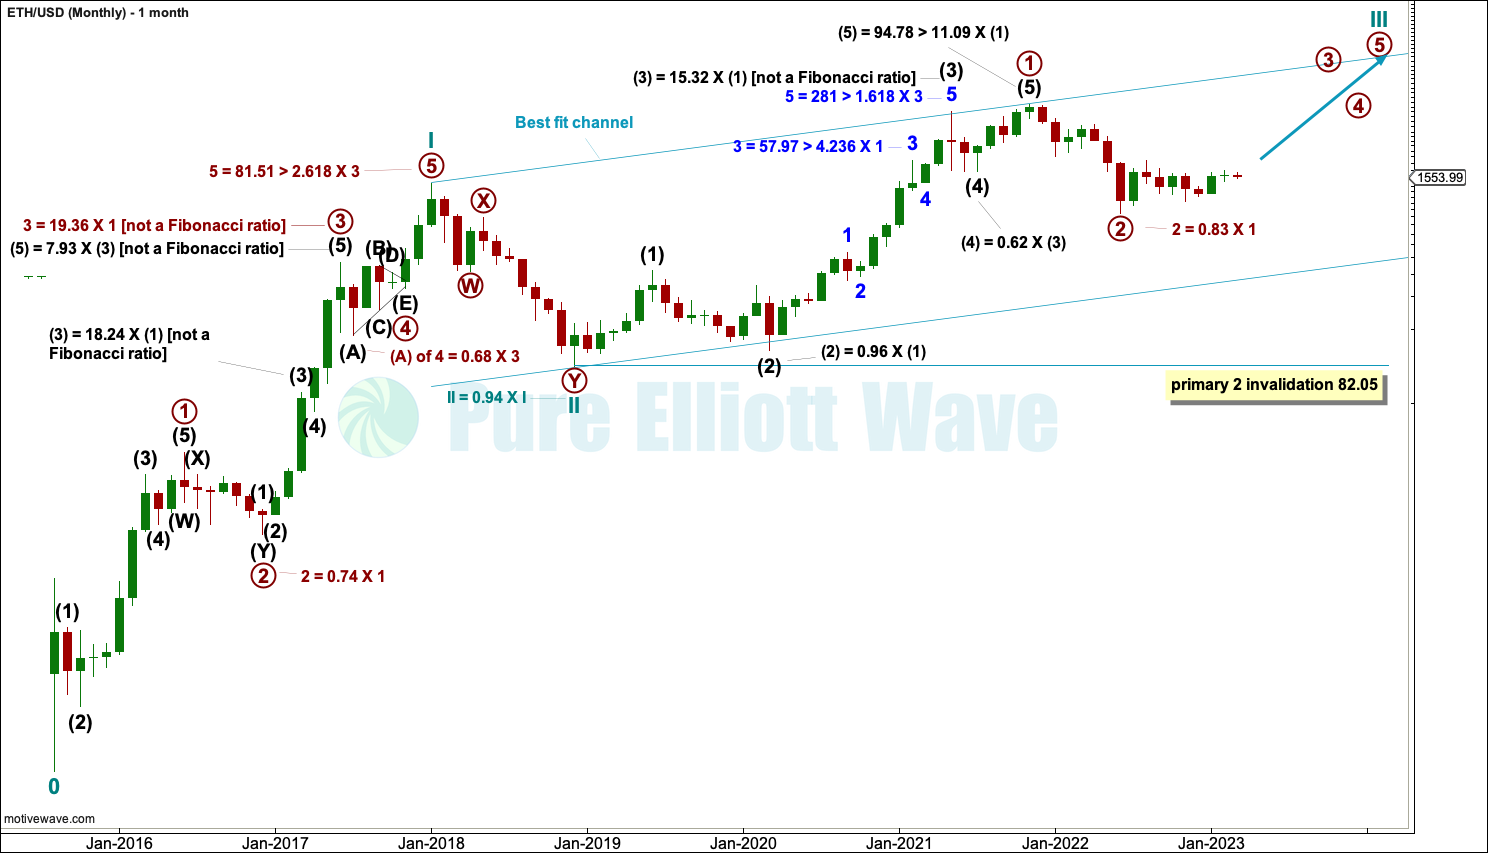
The monthly chart looks at the entire price history of Ethereum. The Elliott wave count begins at the low of October 2015.
From October 2015 to December 2017 this upwards wave subdivides perfectly as an Elliott wave impulse, labelled cycle wave I. The impulse lasted just over two years, which is within the expected duration for a cycle degree wave, so confidence that this degree of labelling is correct may be had.
Within cycle wave I, note that wave lengths noted on the chart are not Fibonacci ratios but guides to expected behaviour for Ethereum. Prior Ethereum price history exhibits very long third waves and fifth waves which are longer than third waves (with the exception of intermediate wave (5) within primary wave 1 within cycle wave III, and also of intermediate wave (5) within primary wave 1 within cycle wave I).
The depth of primary wave 2 and the deepest part of primary wave 4 within cycle wave I are also noted. Ethereum has had deep corrections, but not as deep as other cryptocurrencies.
Within cycle wave III, primary wave 2 may not move beyond the start of primary wave 1 below 82.05. If primary wave 2 within cycle wave III is over at the last low, then it would be 0.83 of primary wave 1. This is a normal to be expected depth.
Cycle wave III may only subdivide as an impulse. It must move far enough above the end of cycle wave I to allow room for cycle wave IV to unfold and remain above cycle wave I price territory.
MAIN WAVE COUNT
WEEKLY
Click chart to enlarge.
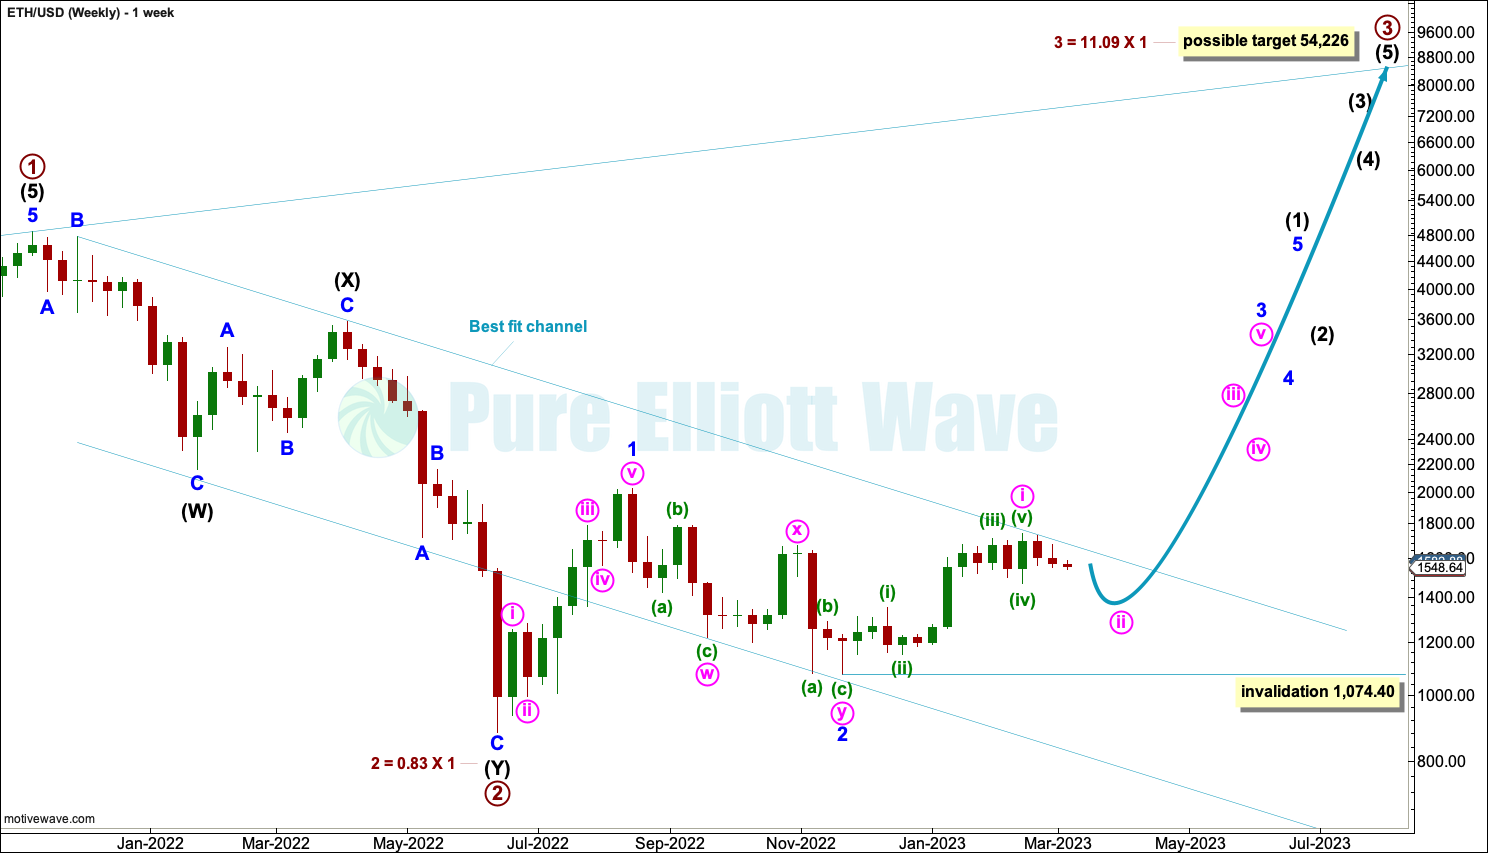
Ethereum sometimes exhibits Fibonacci ratios between its actionary waves. Within primary wave 1, the ratios are noted on the chart.
The structure of primary wave 1 may be complete. Primary wave 2 may be a complete double zigzag. Primary wave 3 within cycle wave III may be in its very early stages. This wave count is very bullish.
Within primary wave 3, intermediate wave (1) may be incomplete.
When intermediate wave (1) may be complete in a few more weeks, then intermediate wave (2) should unfold as a deep correction lasting a few weeks. Intermediate wave (2) may not move beyond the start of intermediate wave (1) below 896.109.
Intermediate wave (1) may have begun with two overlapping first and second waves for minor waves 1 and 2 and now minute waves i and ii. Minute wave ii may be incomplete and may continue lower for a few more weeks. Minute wave ii may not move beyond the start of minute wave i below 1,074.40.
*How to read the notations: For example, for minor wave 3 within intermediate wave (3) the notation “3 = 57.97 > 4.236 X 1” is read as minor wave 3 was 57.97 longer than 4.236 the length of minor wave 1.
DAILY
Click chart to enlarge.
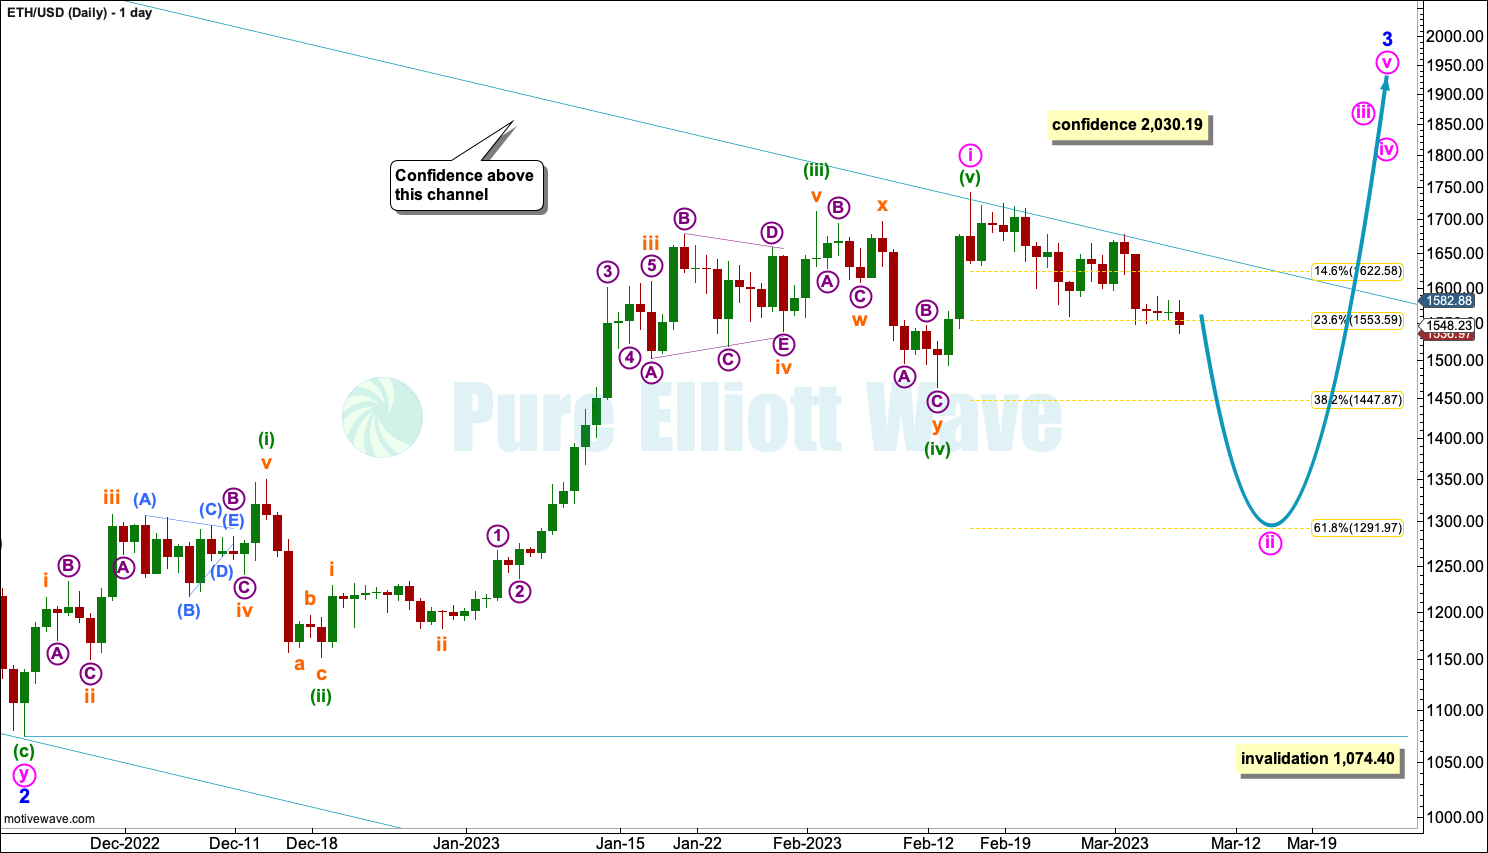
The daily chart focusses on the start of minor wave 3.
Minor wave 3 may only subdivide as an impulse. Within the impulse, minute wave i must subdivide as a five wave motive structure. Minute wave i may be a complete impulse.
Minute wave ii must subdivide as a corrective structure (although it may not subdivide as a triangle). Minute wave ii would most likely subdivide as a single or multiple zigzag.
Price has found resistance about the upper edge of the best fit channel, which is copied over from the weekly chart. Eventually, a breach of this channel would add substantial confidence to this wave count at the weekly and monthly chart levels.
ALTERNATE WAVE COUNT
WEEKLY
Click chart to enlarge.
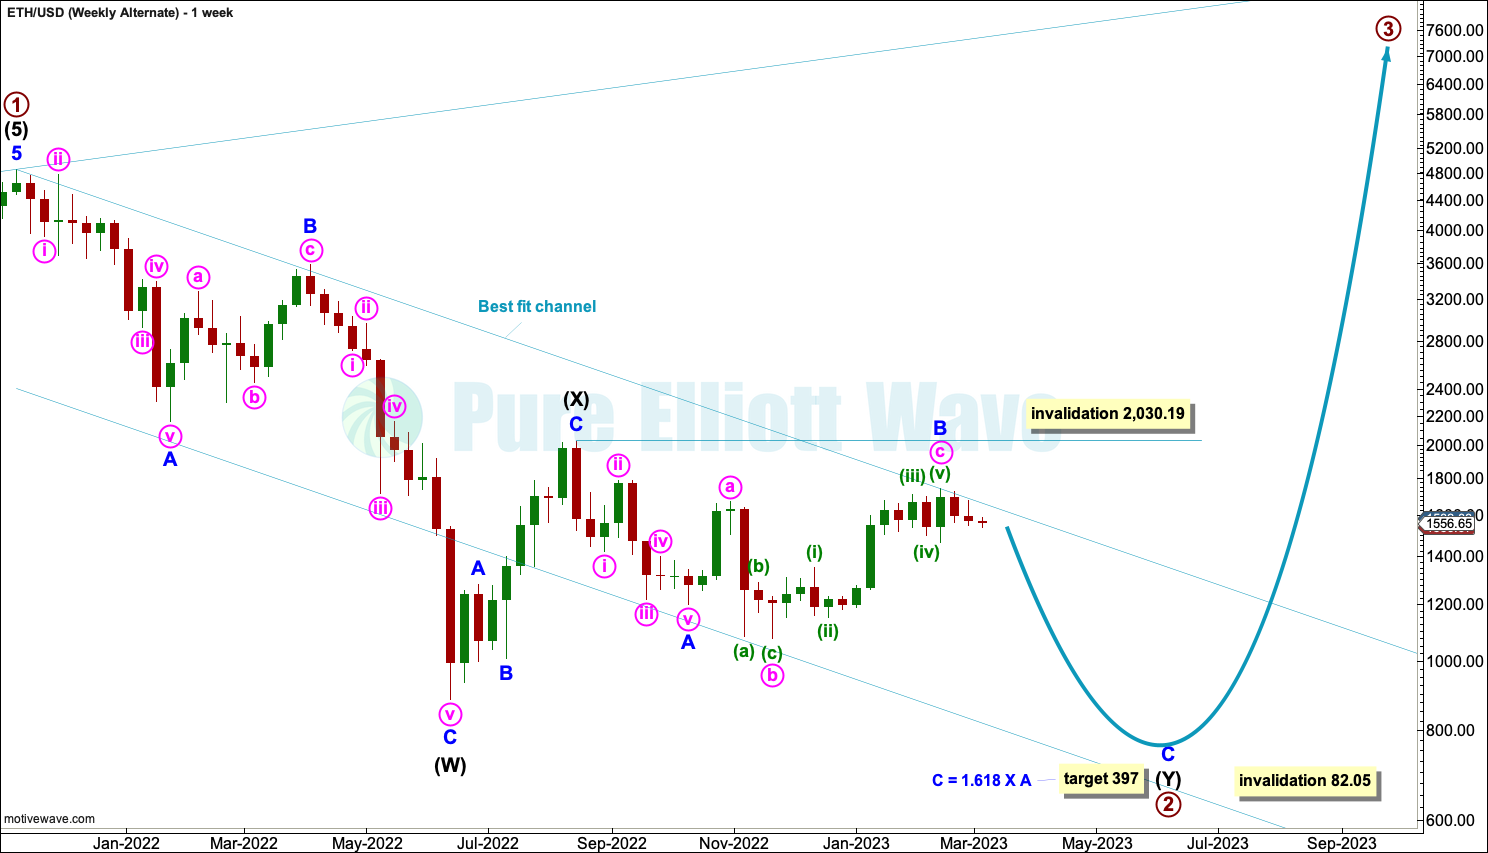
It is also possible that primary wave 2 may be an incomplete double zigzag.
The first zigzag in the double may be complete and is labelled intermediate wave (W). The double is joined by a three in the opposite direction labelled intermediate wave (X). The second zigzag in the double may be incomplete and is labelled intermediate wave (Y).
Within intermediate wave (Y), minor wave A may be complete. Minor wave B may now be a complete expanded flat. If it continues higher, then minor wave B may not move beyond the start of minor wave A above 2,030.19.
DAILY
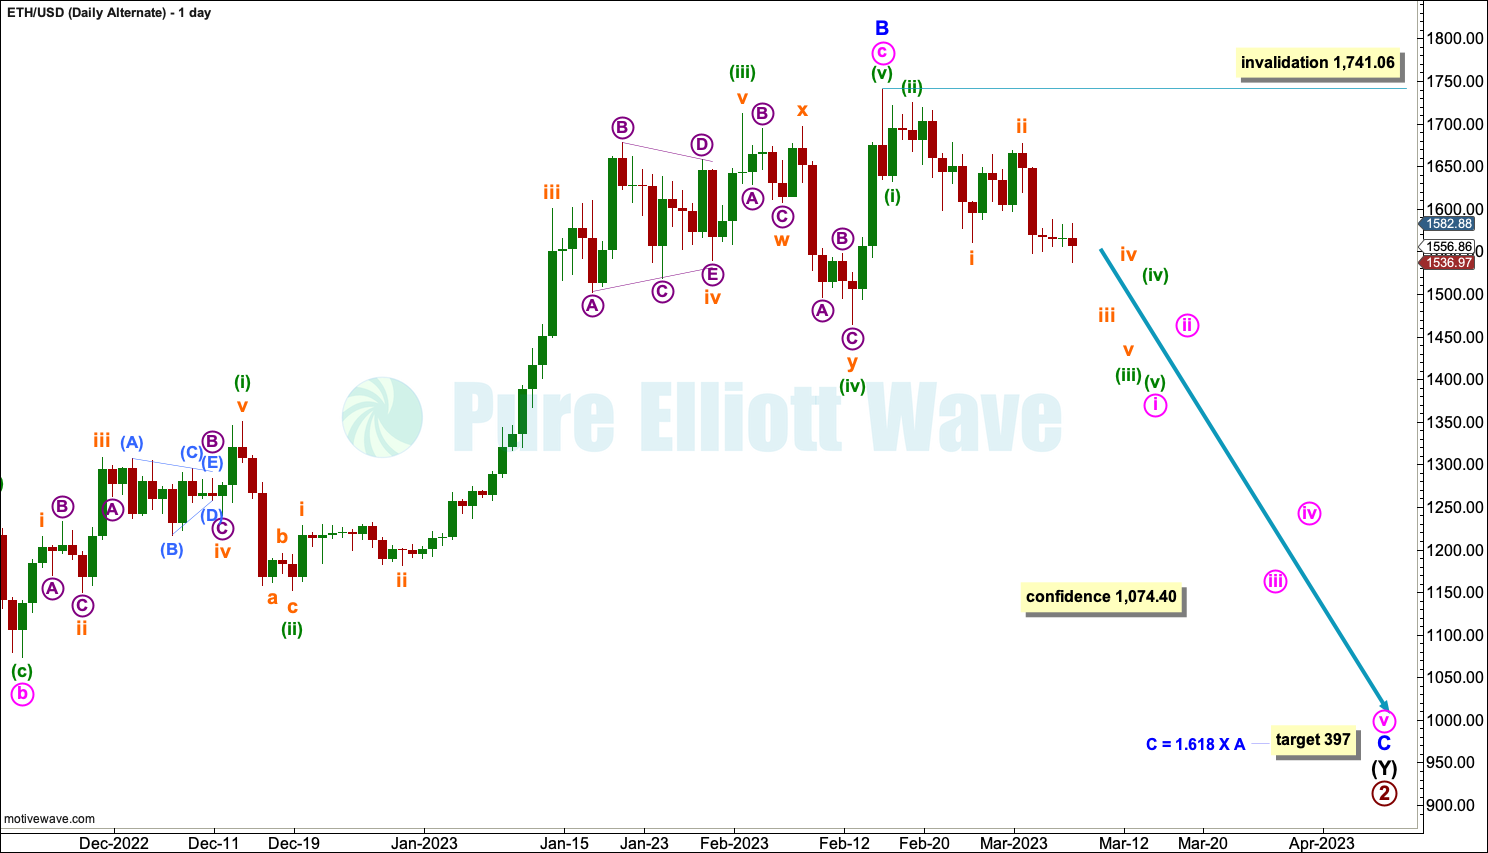
Click chart to enlarge.
Within intermediate wave (Y): minor waves A and B may now be complete. Minor wave C may now continue lower as a five wave motive structure.
Minor wave C would be extremely likely to end below the end of minor wave A at 1,199.77 to avoid a truncation. Intermediate wave (Y) would be extremely likely to end reasonably below the end of intermediate wave (W) at 883.48 to achieve its purpose of deepening the correction for primary wave 2. The target would see these achieved.
Within minor wave C, minute wave ii may not move beyond the start of minute wave i above 1,741.06.
TECHNICAL ANALYSIS
WEEKLY
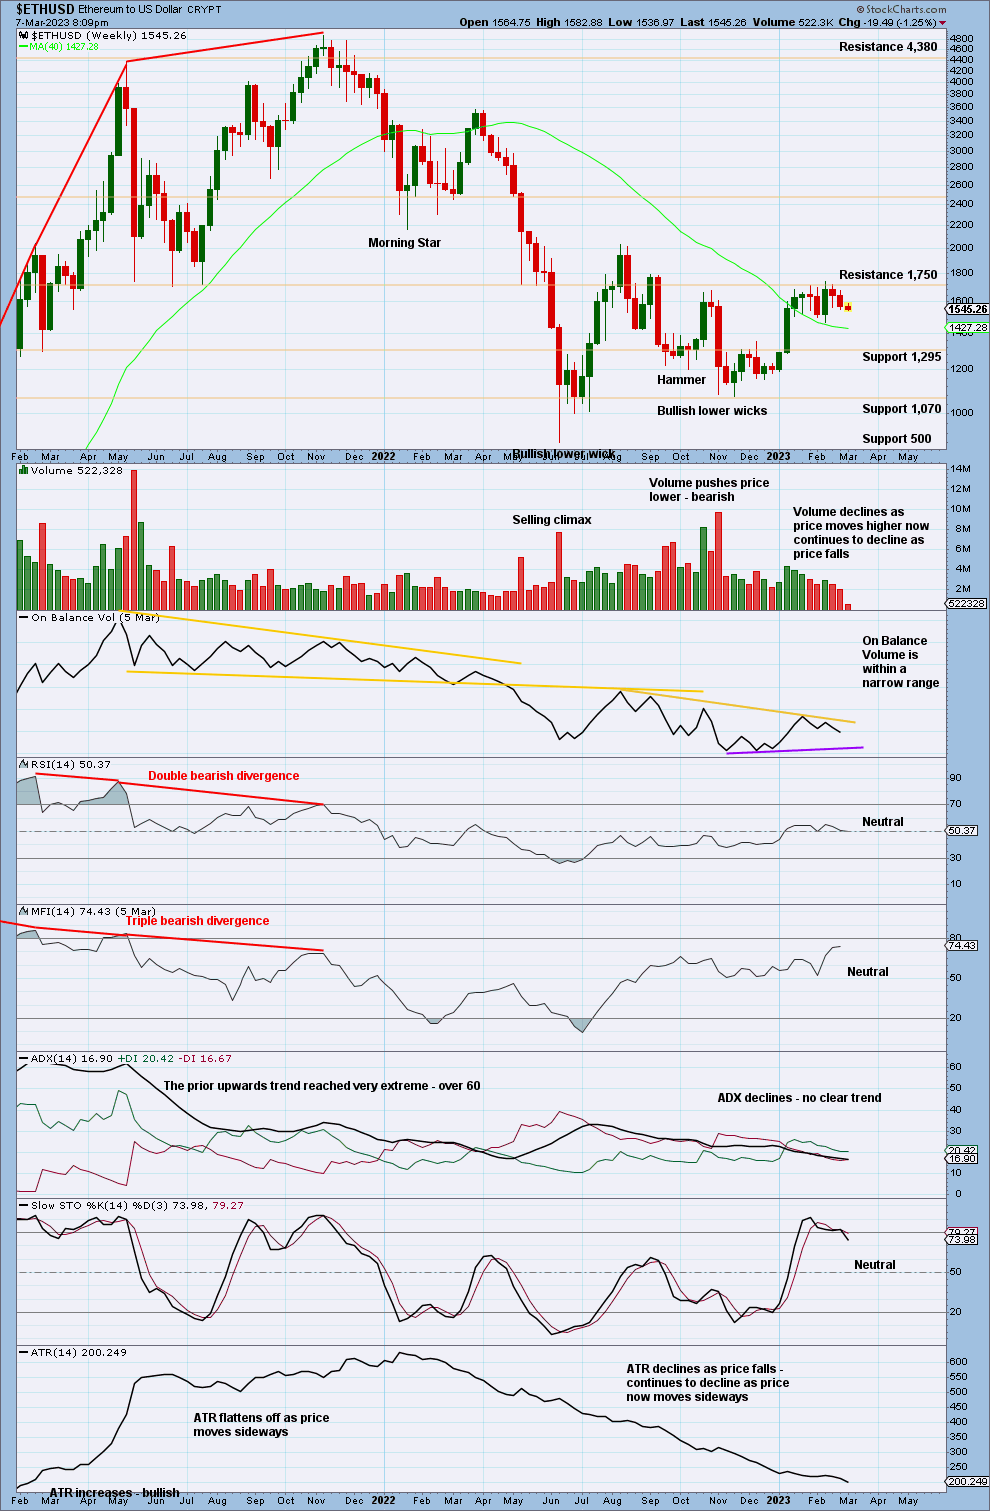
Click chart to enlarge.
RSI reached oversold on the weekly chart at the low in June 2022. This has only happened once before, in December 2018, which was a sustainable low.
Price is currently consolidating with resistance about 1,700 and support about 1,070.
Volume is declining as price moves sideways. On Balance Volume is also range bound.
A breakout is required for confidence in the next direction.
DAILY
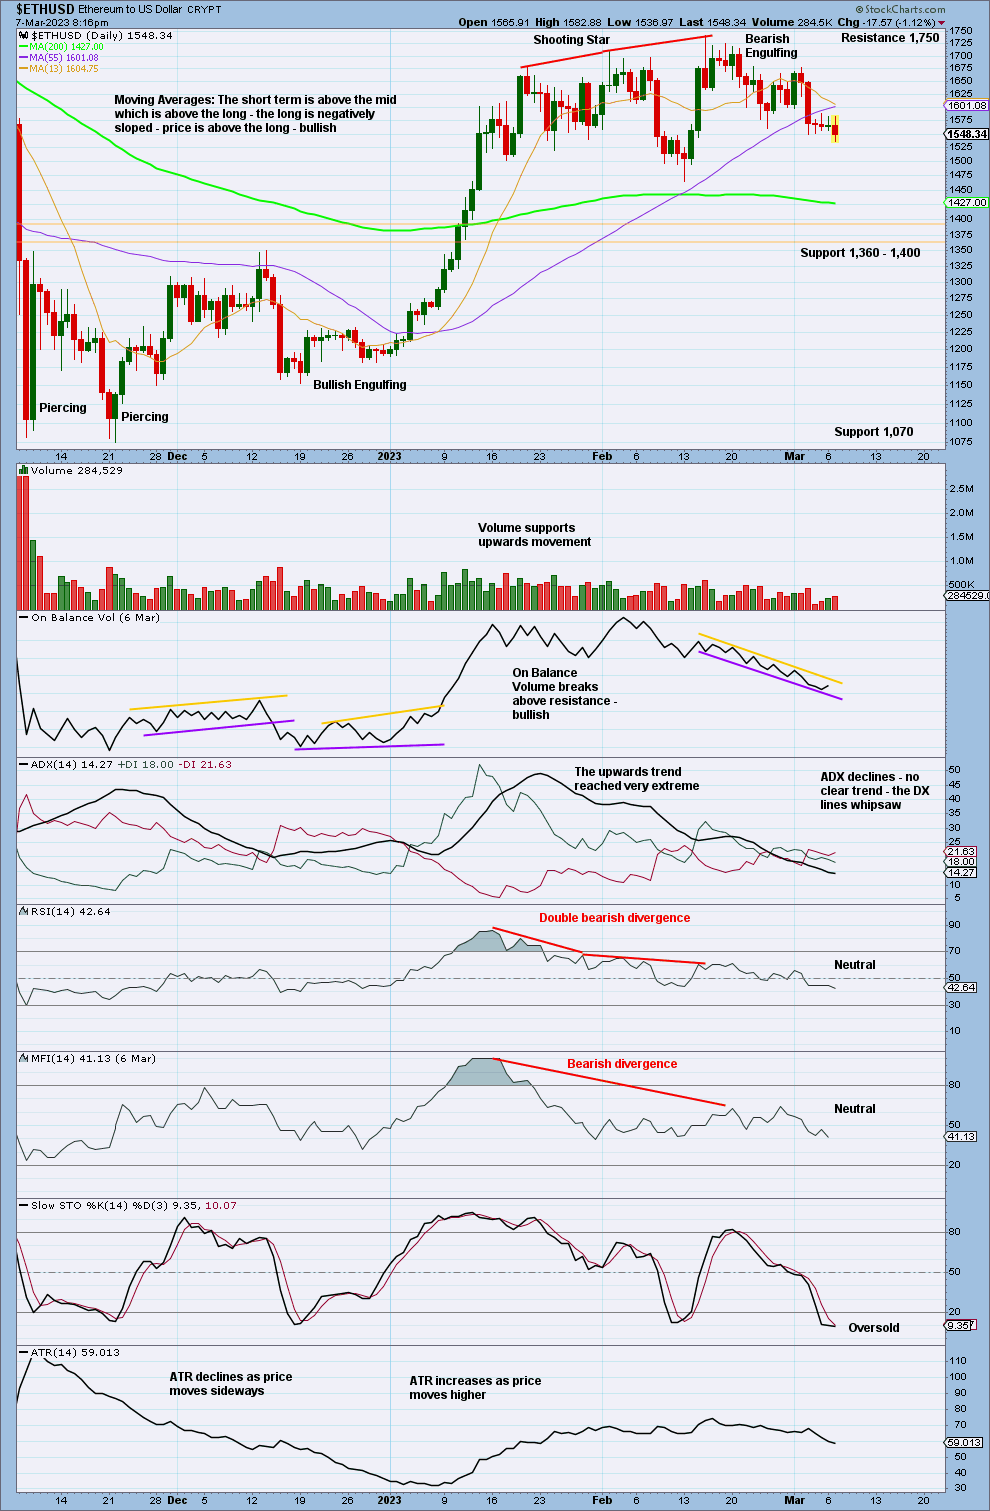
Click chart to enlarge.
At the high, ADX reached an extreme level, and RSI reached overbought territory. Thereafter, RSI and MFI both exhibited bearish divergence with price. Given these conditions and two bearish candlestick patterns, a new downwards trend at this time frame is a reasonable result. Look for next support about 1,360 to 1,400.
Published @ 08:40 p.m. ET.
—
Careful risk management protects your investments.
Follow my two Golden Rules:
1. Invest only funds you can afford to lose.
2. Have an exit plan for both directions – where or when to take profit, and when to exit a losing investment.
—
New updates to this analysis are in bold.
–