April 25, 2023: ETH-USD (Ethereum) Elliott Wave and Technical Analysis – Video and Charts
Last analysis of Ethereum in March expected upwards movement to continue. Price has moved higher as expected.
The next bullish run for Ethereum is now expected to most likely have begun. A possible target for primary wave 3 may be 54,226. This target is conservative and may not be high enough. If the channel about the bear market is breached by upwards movement, then that would offer confidence in the main bullish Elliott wave count.
For the short term, another pullback may continue lower to the target for support about 1,291.97.
The last alternate wave count that considered the bear market incomplete has been invalidated with a new high above 2,030.19. This adds confidence to a bullish wave count.
The data used for this analysis comes from CryptoCompare.
All charts are on a semi-log scale.
MAIN ELLIOTT WAVE COUNT
MONTHLY
Click chart to enlarge.
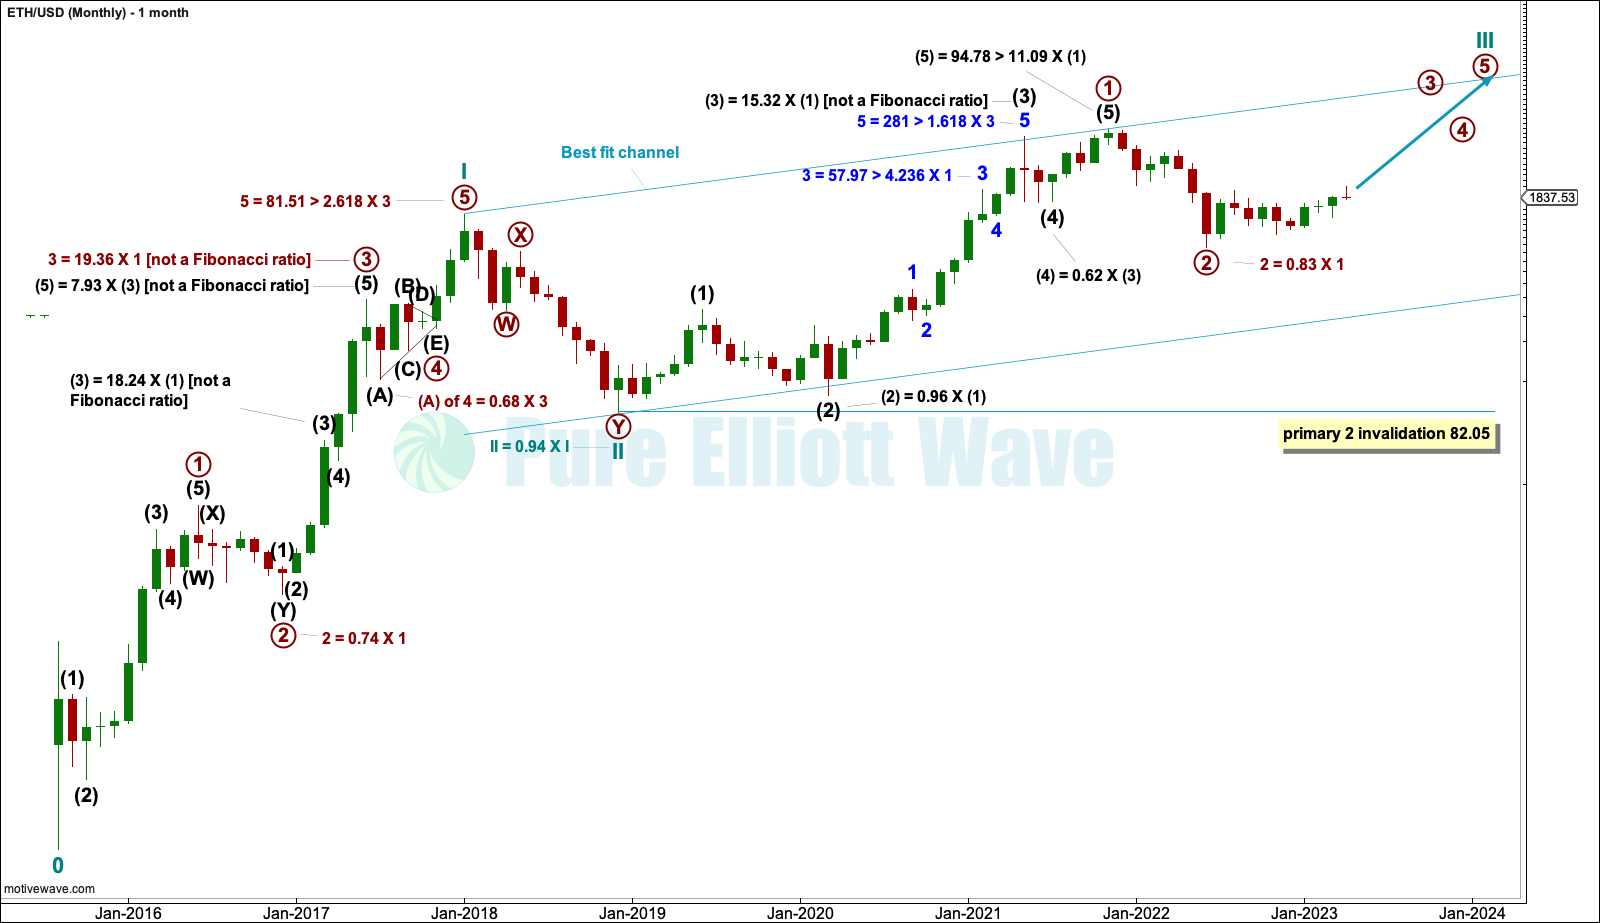
The monthly chart looks at the entire price history of Ethereum. The Elliott wave count begins at the low of October 2015.
From October 2015 to December 2017 this upwards wave subdivides perfectly as an Elliott wave impulse, labelled cycle wave I. The impulse lasted just over two years, which is within the expected duration for a cycle degree wave, so confidence that this degree of labelling is correct may be had.
Within cycle wave I, note that wave lengths noted on the chart are not Fibonacci ratios but guides to expected behaviour for Ethereum. Prior Ethereum price history exhibits very long third waves and fifth waves which are longer than third waves (with the exception of intermediate wave (5) within primary wave 1 within cycle wave III, and also of intermediate wave (5) within primary wave 1 within cycle wave I).
The depth of primary wave 2 and the deepest part of primary wave 4 within cycle wave I are also noted. Ethereum has had deep corrections, but not as deep as other cryptocurrencies.
Within cycle wave III, primary wave 2 may not move beyond the start of primary wave 1 below 82.05. If primary wave 2 within cycle wave III is over at the last low, then it would be 0.83 of primary wave 1. This is a normal to be expected depth.
Cycle wave III may only subdivide as an impulse. It must move far enough above the end of cycle wave I to allow room for cycle wave IV to unfold and remain above cycle wave I price territory.
MAIN WAVE COUNT
WEEKLY
Click chart to enlarge.
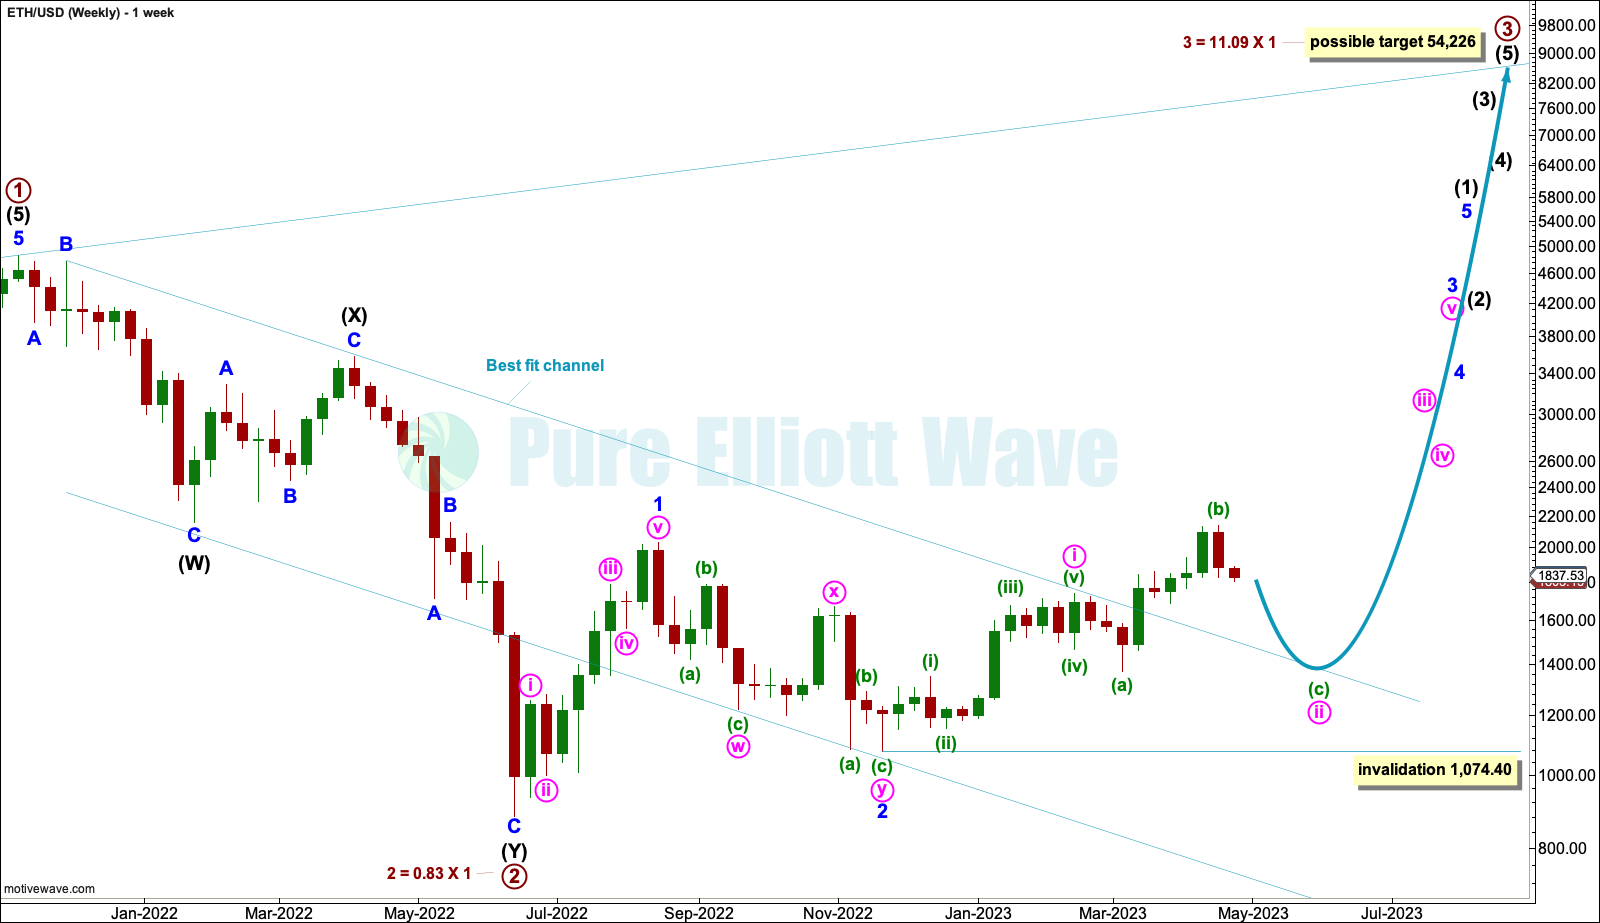
Primary wave 2 may be a complete double zigzag. Primary wave 3 within cycle wave III may be in its very early stages. This wave count is very bullish.
Within primary wave 3, intermediate wave (1) may be incomplete.
When intermediate wave (1) may be complete, then intermediate wave (2) should unfold as a deep correction that may last a few weeks. Intermediate wave (2) may not move beyond the start of intermediate wave (1) below 896.109.
Intermediate wave (1) may have begun with two overlapping first and second waves for minor waves 1 and 2 and now minute waves i and ii. Minute wave ii may be incomplete and may continue lower for a few more weeks. Minute wave ii may not move beyond the start of minute wave i below 1,074.40.
DAILY
Click chart to enlarge.
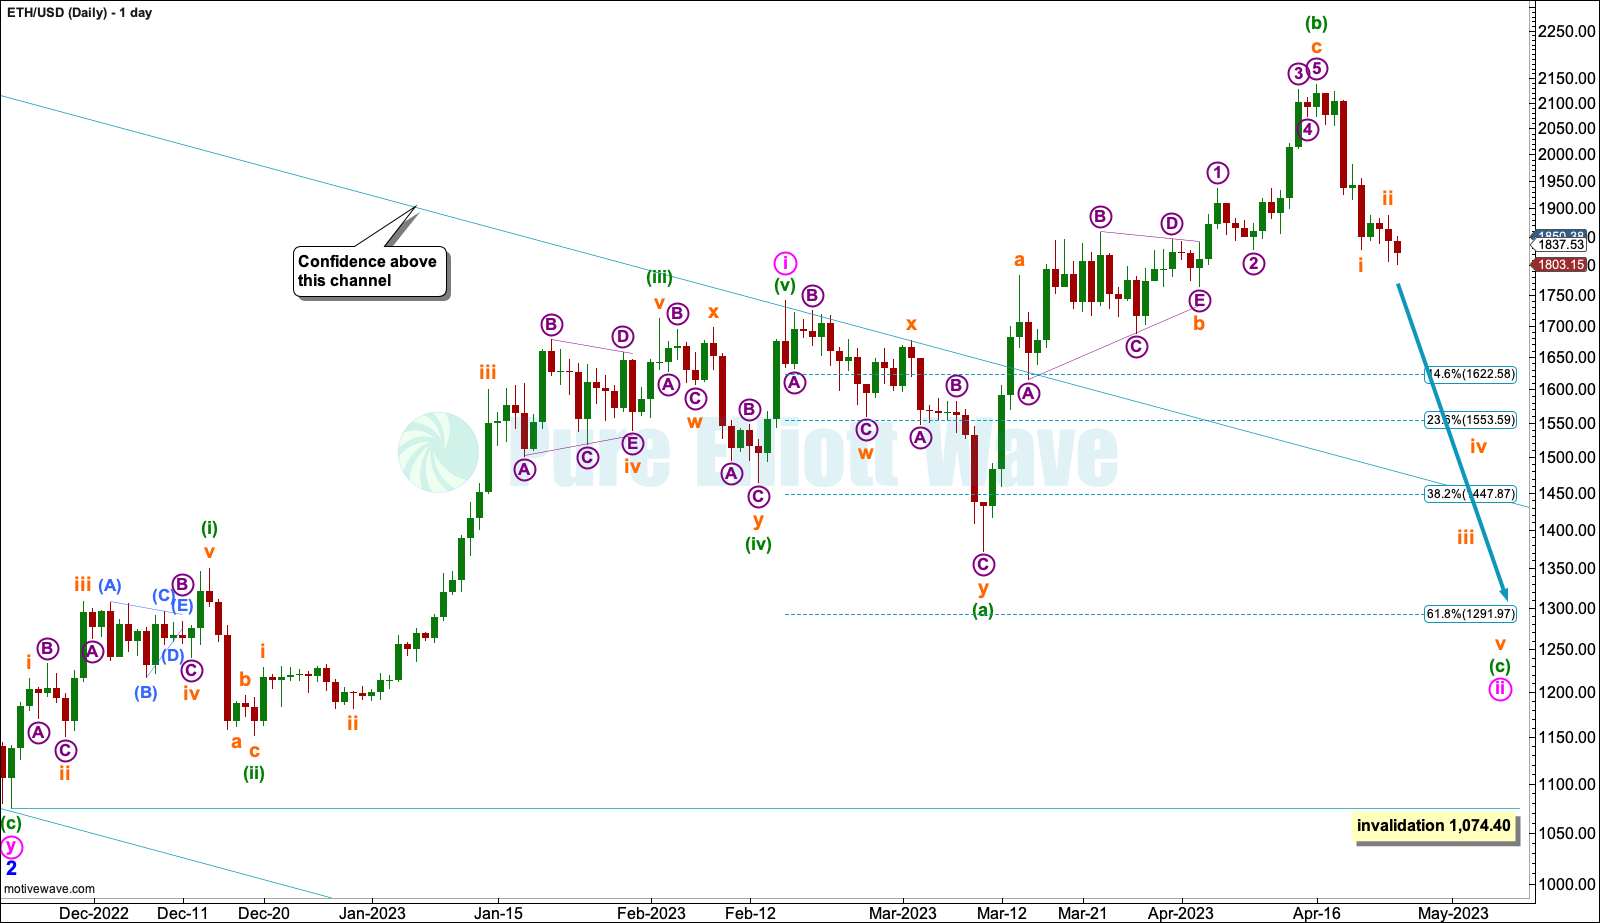
Minute wave i may be a complete impulse. Minute wave ii may be an incomplete expanded flat.
It is very difficult to see minute wave i over at the last high on April 16, 2023. The final wave up labelled here minuette wave (b) does not fit as a five wave motive structure. For this reason, the wave count considers this upwards wave to be a zigzag for minuette wave (b).
Within the expanded flat, minuette wave (b) is a 2.08 length of minuette wave (a). This is beyond the common range of up to 1.38 and beyond normal allowable convention of up to 2, but as noted above it is very difficult to see minuette wave (b) as a five wave motive structure.
Minuette wave (c) must subdivide as a five wave motive structure. Minuette wave (c) would be very likely to make at least a slight new low below the end of minuette wave (a) at 1,372.22 to avoid a truncation and a very rare running flat. Minute wave ii may find support about the logarithmic function of the 0.618 Fibonacci ratio at 1,291.97.
MInute wave ii may not move beyond the start of minute wave i below 1,074.40.
TECHNICAL ANALYSIS
WEEKLY
Click chart to enlarge.
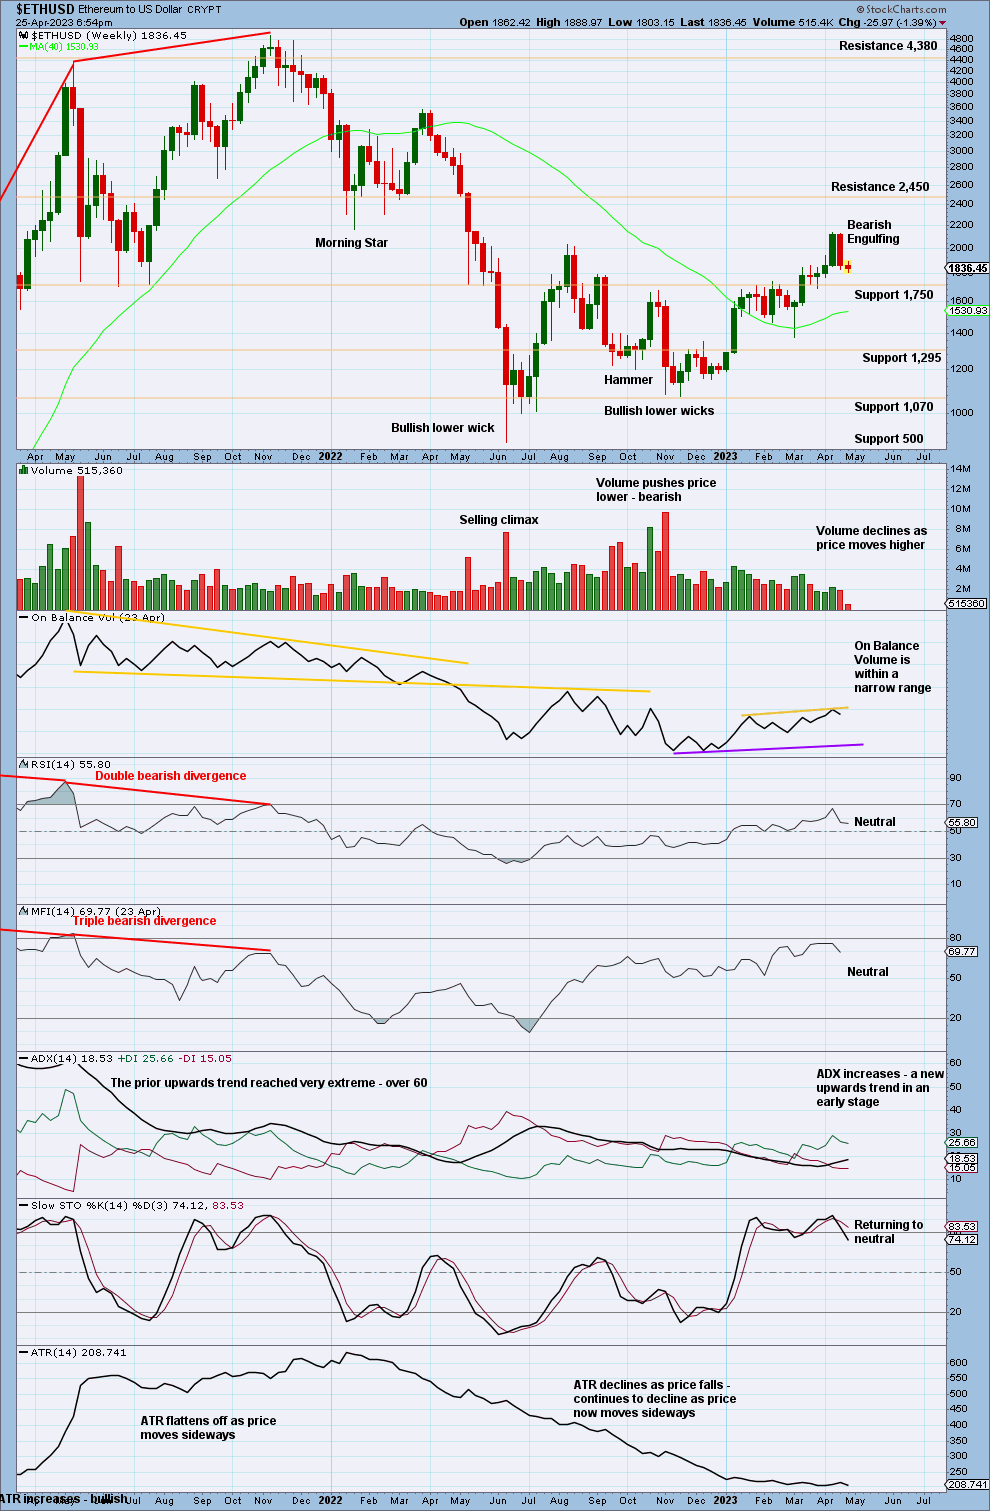
RSI reached oversold on the weekly chart at the low in June 2022. This has only happened once before, in December 2018, which was a sustainable low.
A higher high above the high from August 2022 indicates a potential trend change to upwards. ADX agrees there is a new upwards trend.
Declining volume as price moves higher supports the Elliott wave count. B waves should exhibit weak range and volume.
DAILY
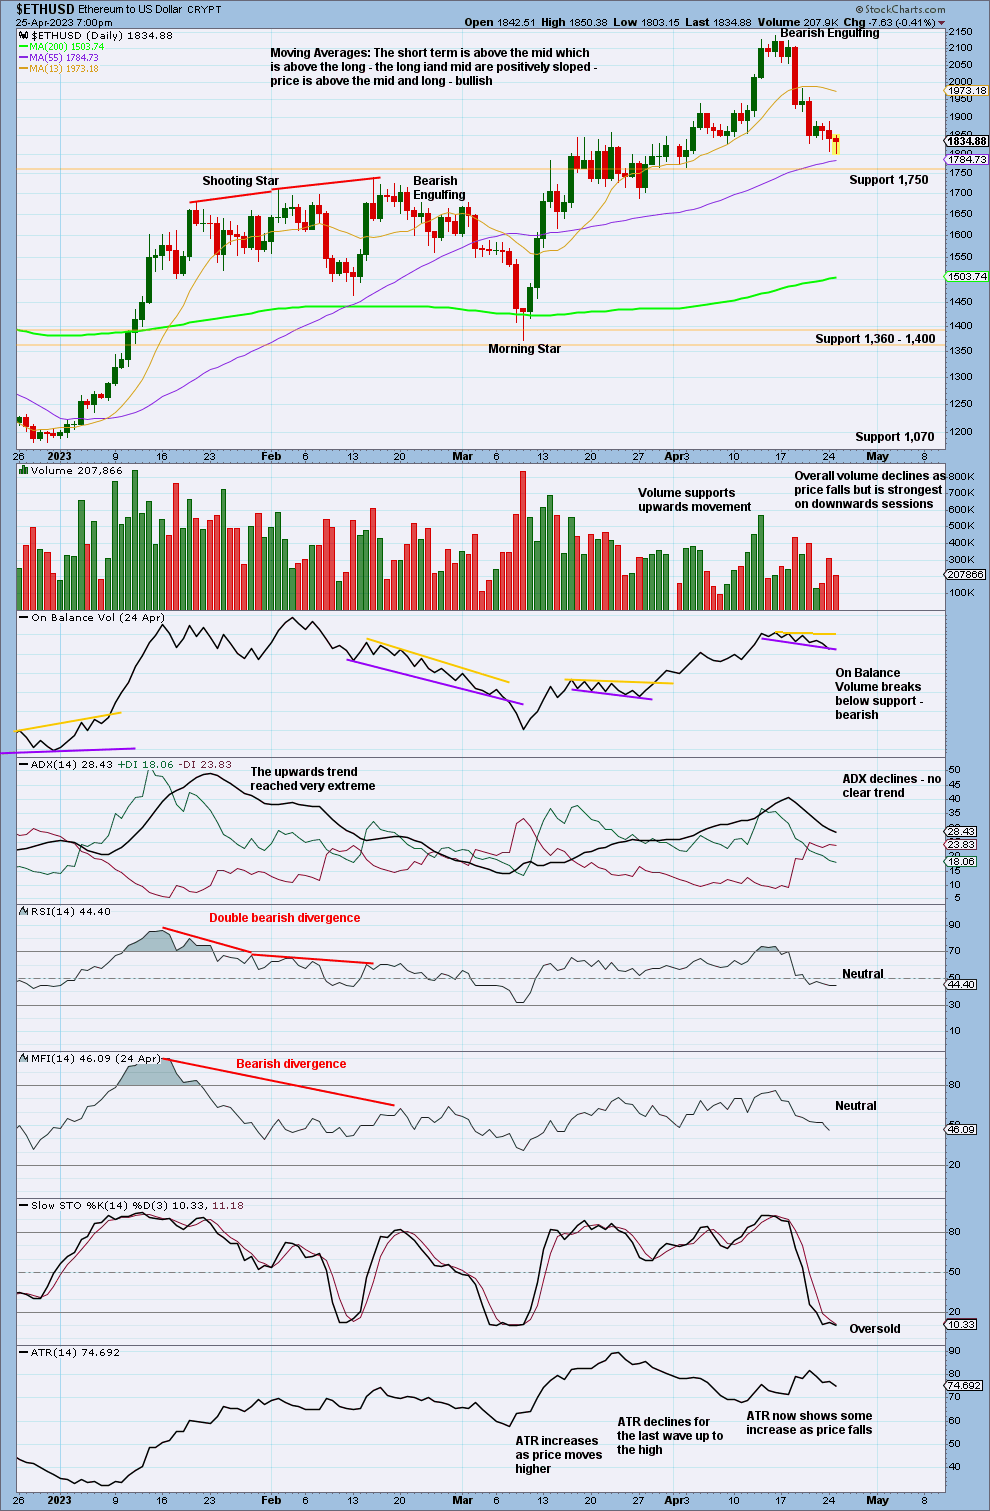
Click chart to enlarge.
ATR showed some decline at the end of upwards movement. Now a Bearish Engulfing pattern supports the Elliott wave count. ATR now shows an increase as price falls, which also supports the Elliott wave count.
Published @ 06:58 p.m. ET.
—
Careful risk management protects your investments.
Follow my two Golden Rules:
1. Invest only funds you can afford to lose.
2. Have an exit plan for both directions – where or when to take profit, and when to exit a losing investment.
—
New updates to this analysis are in bold.
–