May 24, 2023: DXY U.S. Dollar Index Elliott Wave and Technical Analysis – Charts and Video
Summary: The bigger picture for the Dollar expects overall downwards movement for the long term, most likely to not make a new low below 70.69.
For the short term, a bounce may continue higher to a target of 105.36. Thereafter, a strong third wave down may begin. Recent price action may be confirming this outlook.
Technicals support a long-term top during September 2022. A long-term trend shift may be in effect for years to come.
QUARTERLY CHART
Click chart to enlarge.
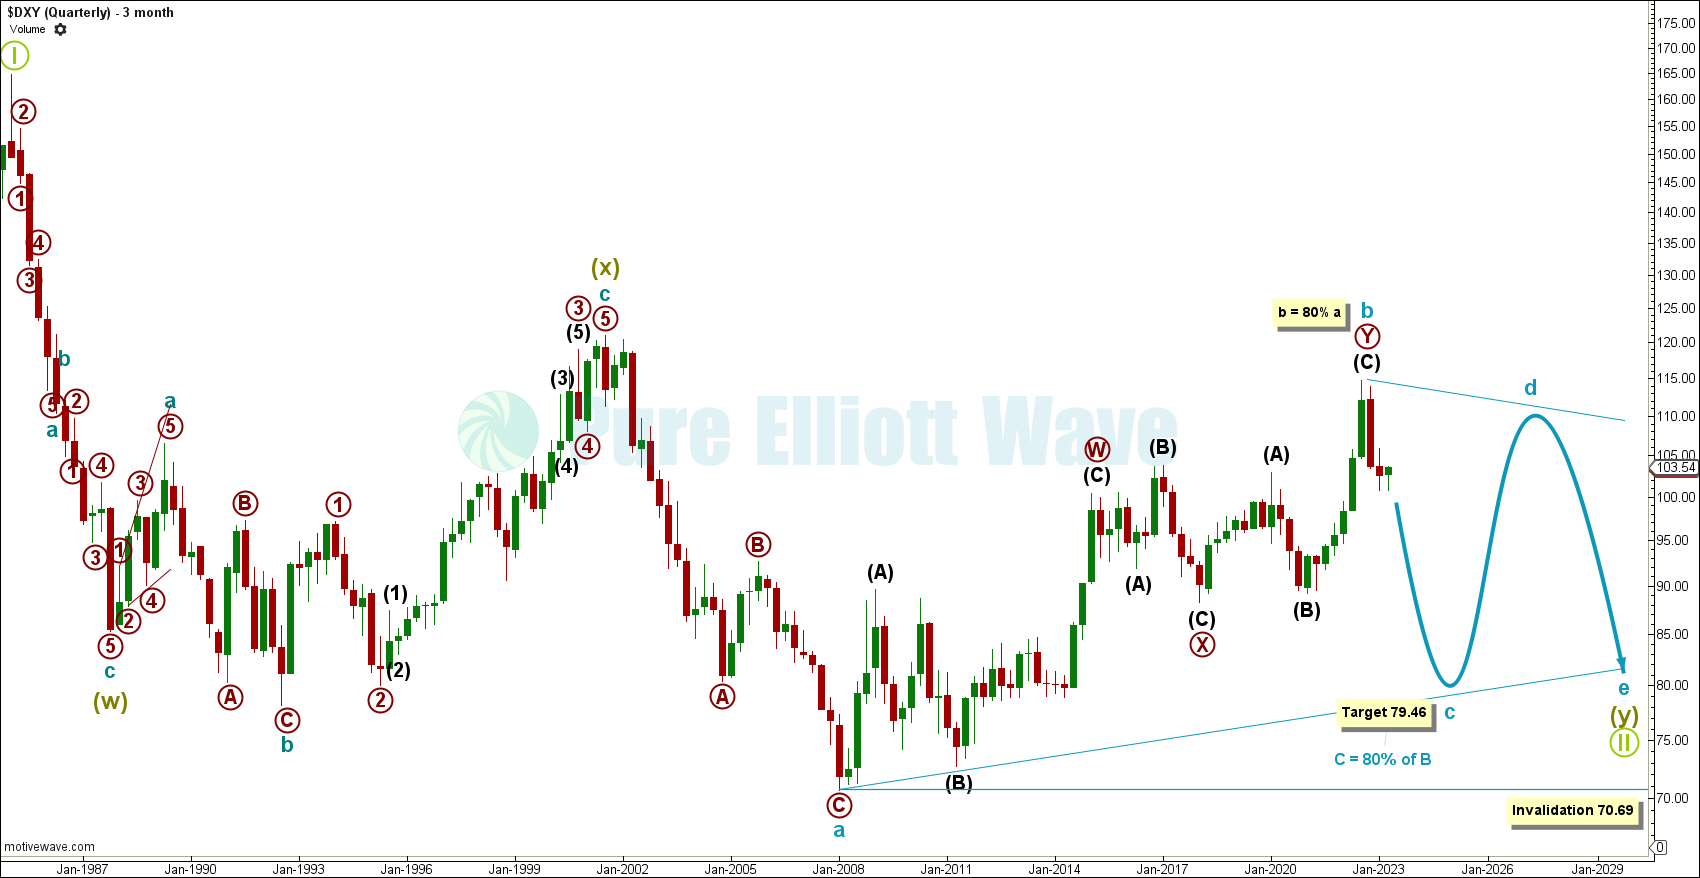
The quarterly chart shows a giant supercycle degree W-X-Y combination that correlates well with a strong inverse correlation with EUR-USD.
With supercycle wave (w) complete as a zigzag, wave (x) complete as an expanding flat, supercycle wave (y) may be unfolding as a regular contracting triangle, given the recent overlapping waves from 2008 to 2023. The high for the top of cycle wave b is indicated by a strong bearish engulfing candlestick pattern on this quarterly chart.
Within supercycle wave (y): Cycle waves a and b appear to be complete and cycle wave c may be underway.
Within a regular contracting triangle, wave c, d and e often retrace the same percentage as the preceding wave. With cycle wave b retracing 80% of cycle wave a, this gives us a target for cycle wave c of 79.46.
Invalidation for this triangle to the downside is if cycle wave c moves beyond the end of cycle wave a at 70.69. No upwards invalidation is given; if cycle wave b continues higher, then the triangle could be of the running variety.
MONTHLY
Click chart to enlarge.
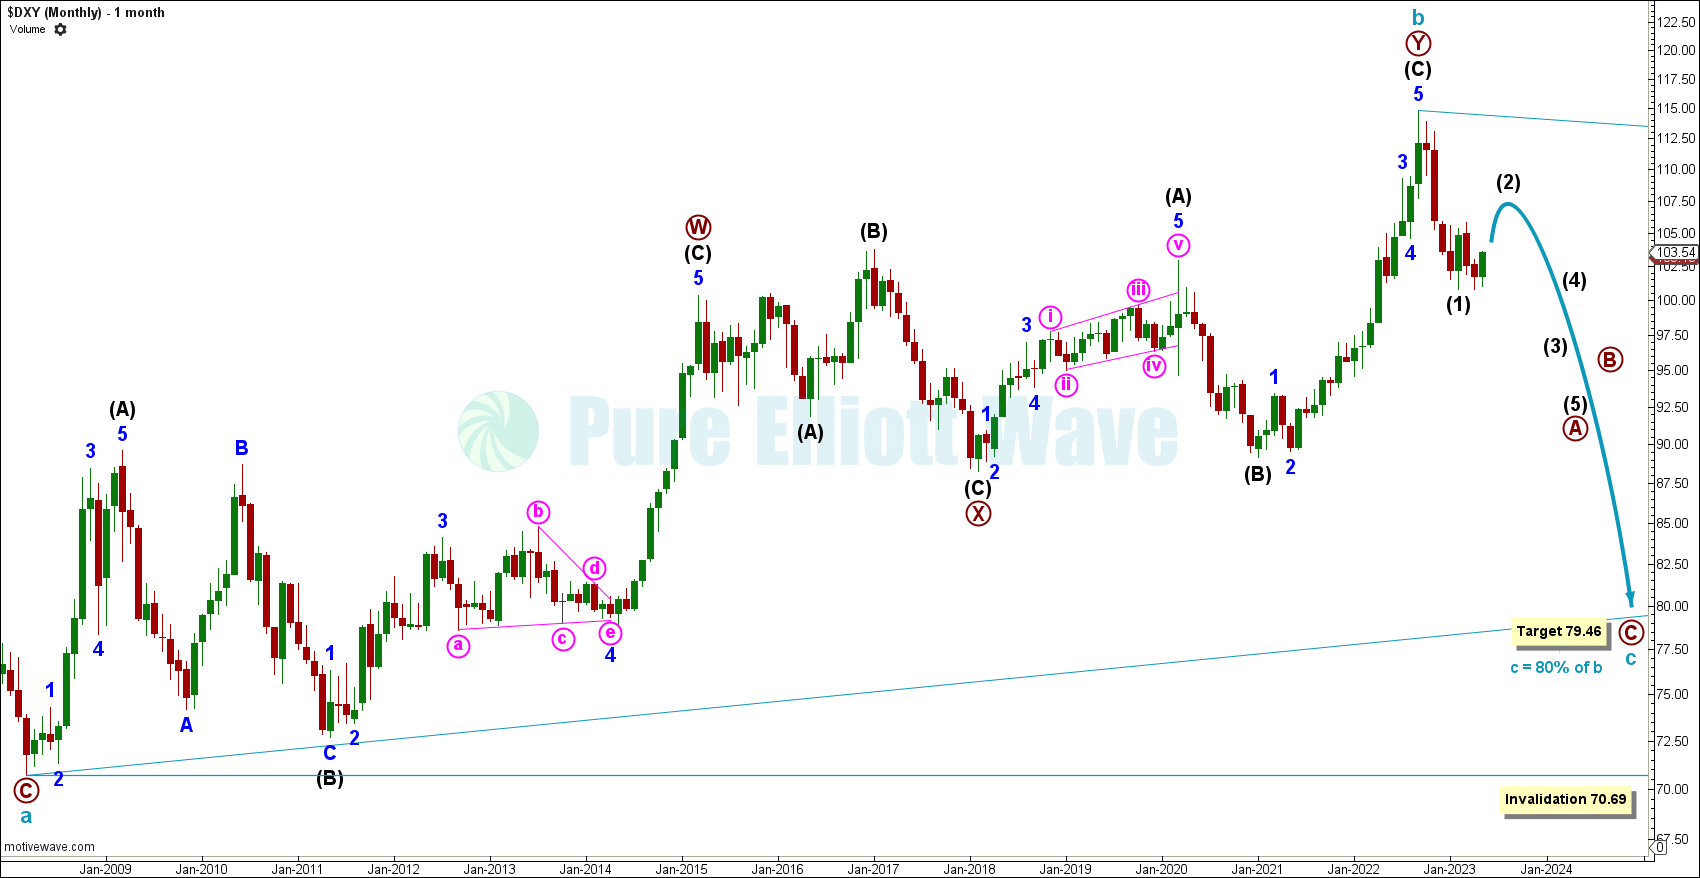
The monthly chart focuses on cycle wave b and the start of cycle wave c.
Cycle wave b may be complete, with a top in september 2022. Within a contracting triangle, all waves must subdivide as zigzags or multiple zigzags with only one subwave being a multiple. Within the primary A-B-C zigzag for cycle wave c: Intermediate (1) of primary wave A may be complete and intermediate wave (2) may be underway.
Once intermediate wave (2) is complete, the bear market is expected to resume downwards.
WEEKLY CHART
Click chart to enlarge.
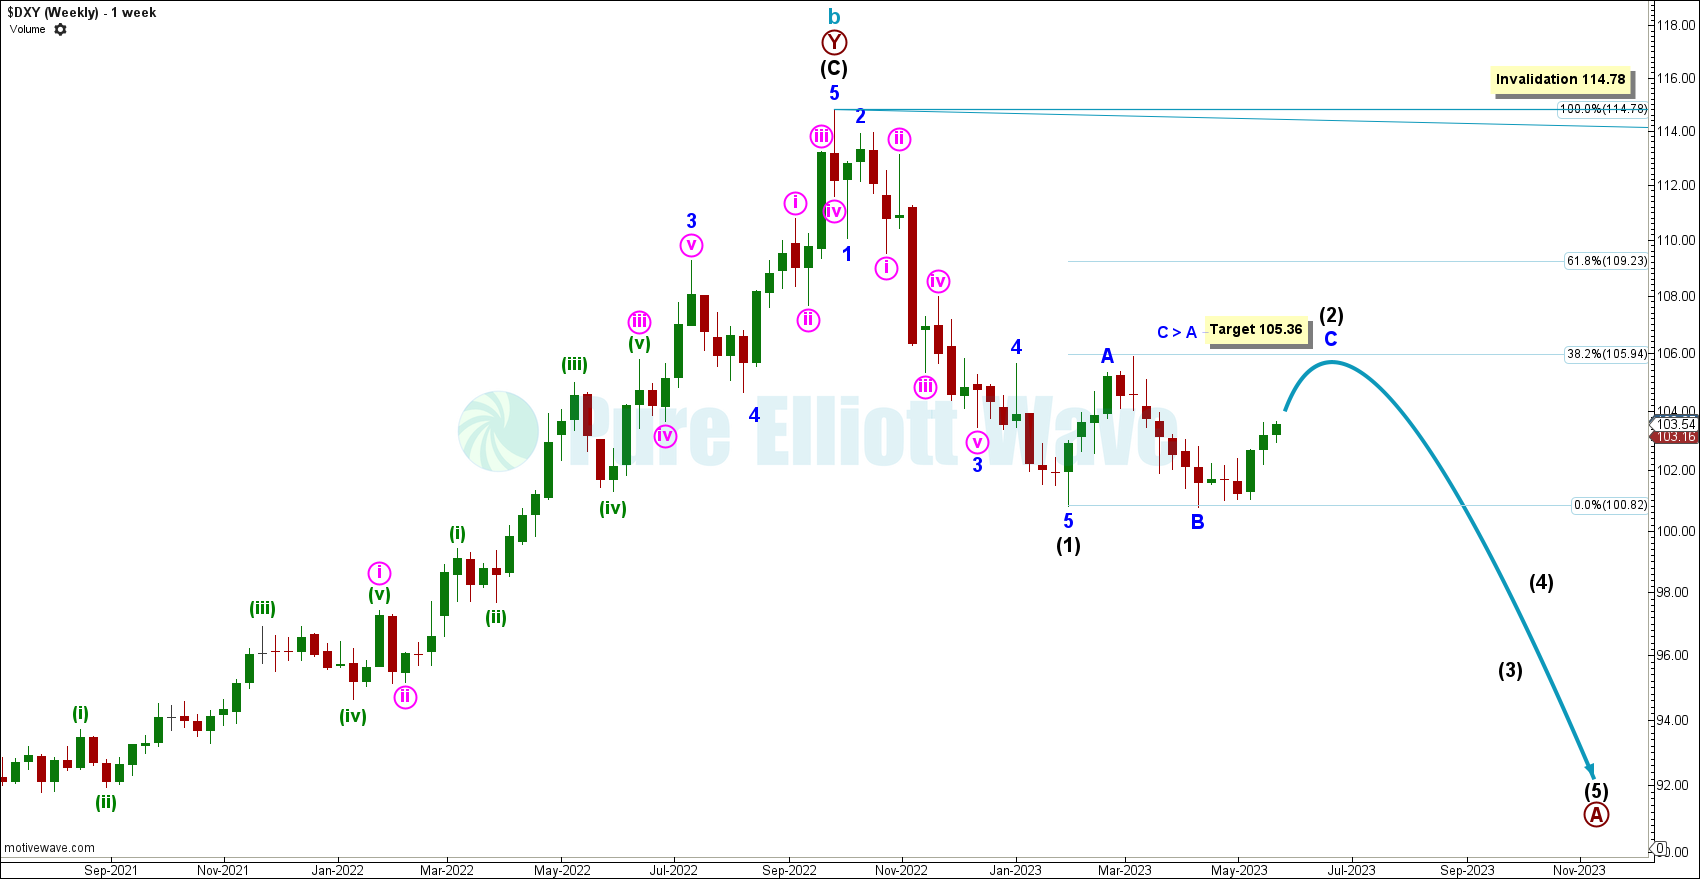
The weekly chart focuses on the end of cycle b, and gives more detail on intermediate waves (1) and (2) of primary A.
Intermediate (1) may be complete as a very clean impulse. Impulses indicate the main direction of the trend one degree larger, so this supports the major trend reversal from the top in September 2022.
Intermediate (2) may be underway as a regular flat correction, where minor waves A and B are complete, and minor wave C unfolding now upwards. Within a regular flat, wave C often ends just beyond the end of wave A. This gives us a target for price to reach at least 105.36. If price failed to reach upwards past the end of minor wave A, then this would be a rare running flat; but, this is not likely.
A bounce to 105.36 also correlates well with the 0.382 fibonacci retracement of intermediate wave (1).
Invalidation for the motive structure downwards sits above at 114.78 where intermediate wave 2 may not move beyond the start of intermediate wave (1).
DAILY CHART
Click chart to enlarge.
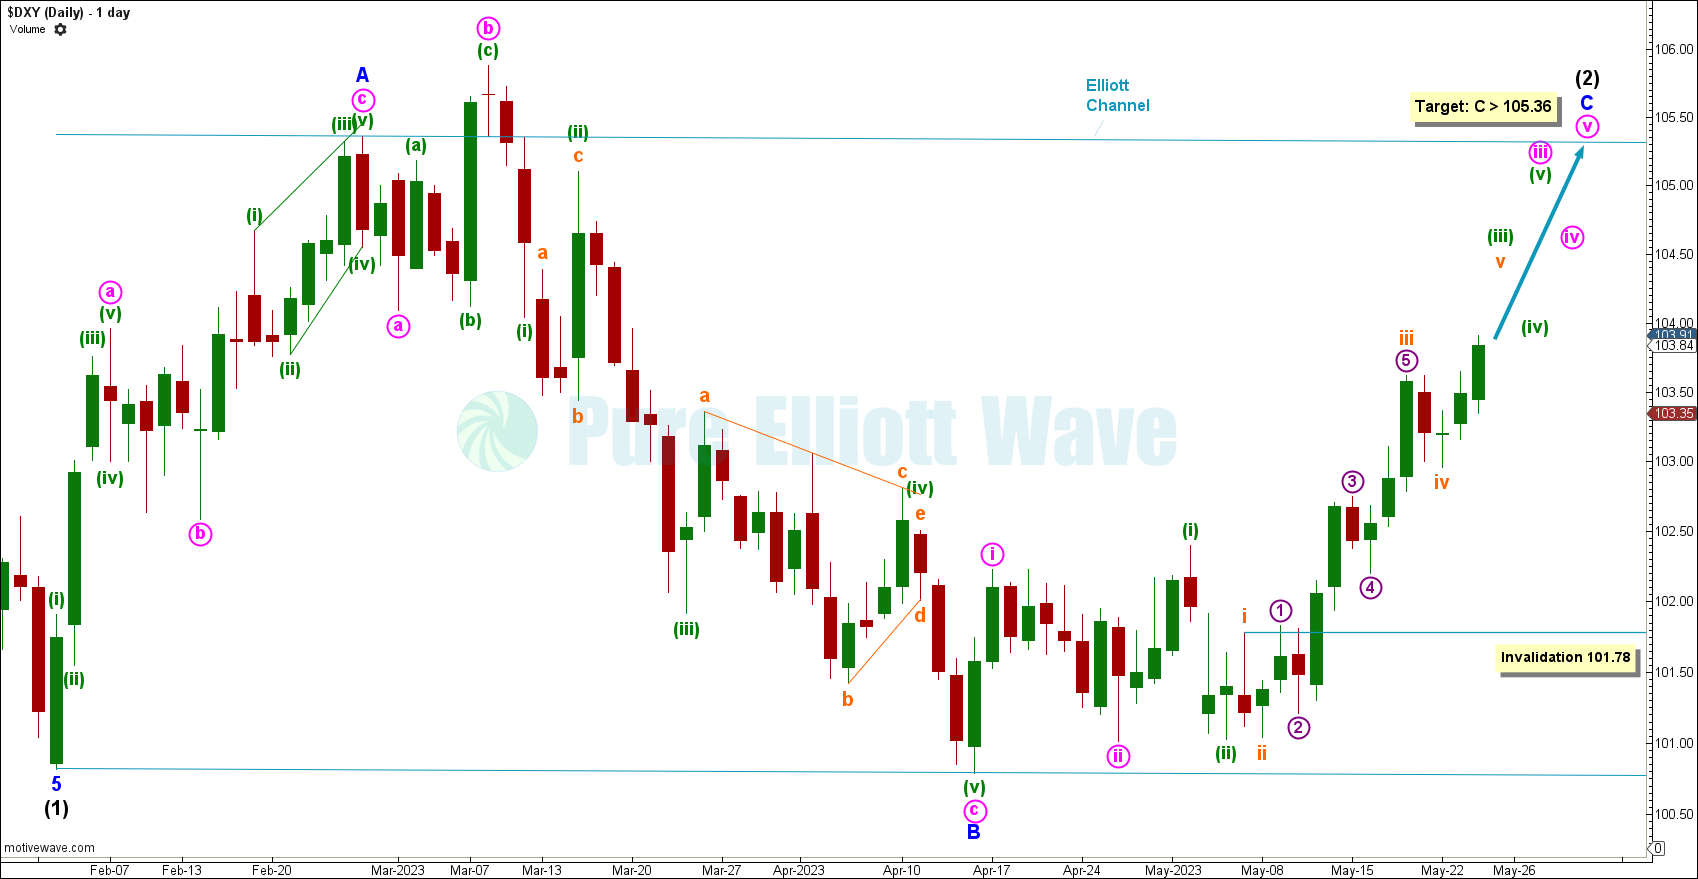
The daily chart focuses on minor waves A, B and C of intermediate (2).
With minor wave A possibly complete as a zigzag, and minor wave B as an expanding flat, minor wave C must unfold as a motive structure.
Within minor wave C, minute waves i and ii may be complete, with further lower degrees extending sharply higher. At minuette degree, the minuette wave iii impulse may nearly be complete. After the next pullback for minuette wave (iv), minuette wave (v) and minute wave v may continue upwards movement to reach the target at or above 105.36.
This wave count expects more short-term bullish price action.
TECHNICAL ANALYSIS
MONTHLY CHART
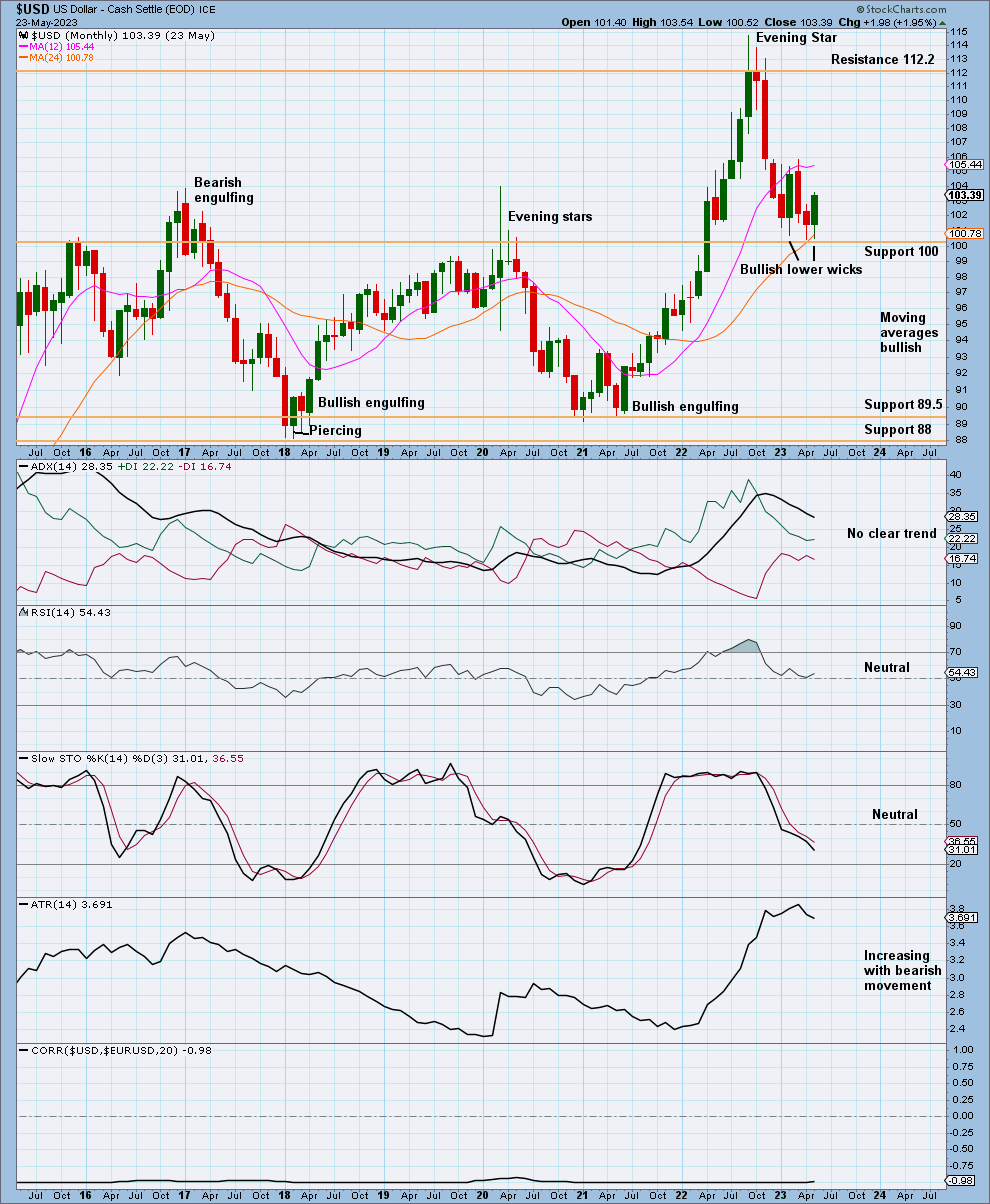
Click chart to enlarge.
On the monthly chart, recent bullish lower wicks add support to the Elliott Wave count. Support also sits closely below at 100.
The 1 and 2 year moving averages are sloping up with price trading below the 1 year moving average.
WEEKLY CHART
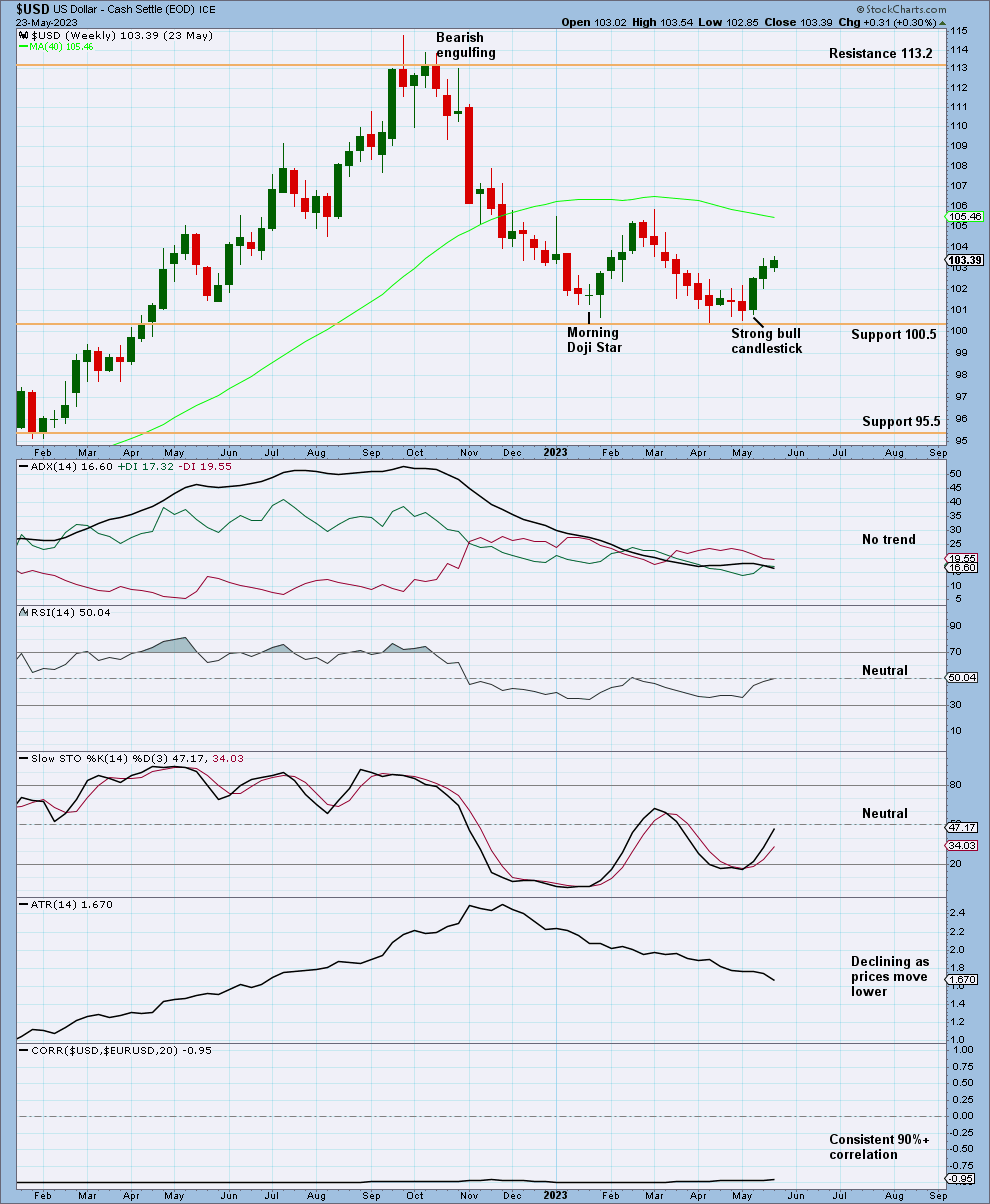
Click chart to enlarge.
The weekly chart shows the 200 day moving average sloping down and price trading below.
Recent strong bullish candlesticks add support to the Elliott wave count.
Correlation between the EURUSD and DXY is consistently above -0.9, showing a statistically reliable inverse relationship.
DAILY CHART
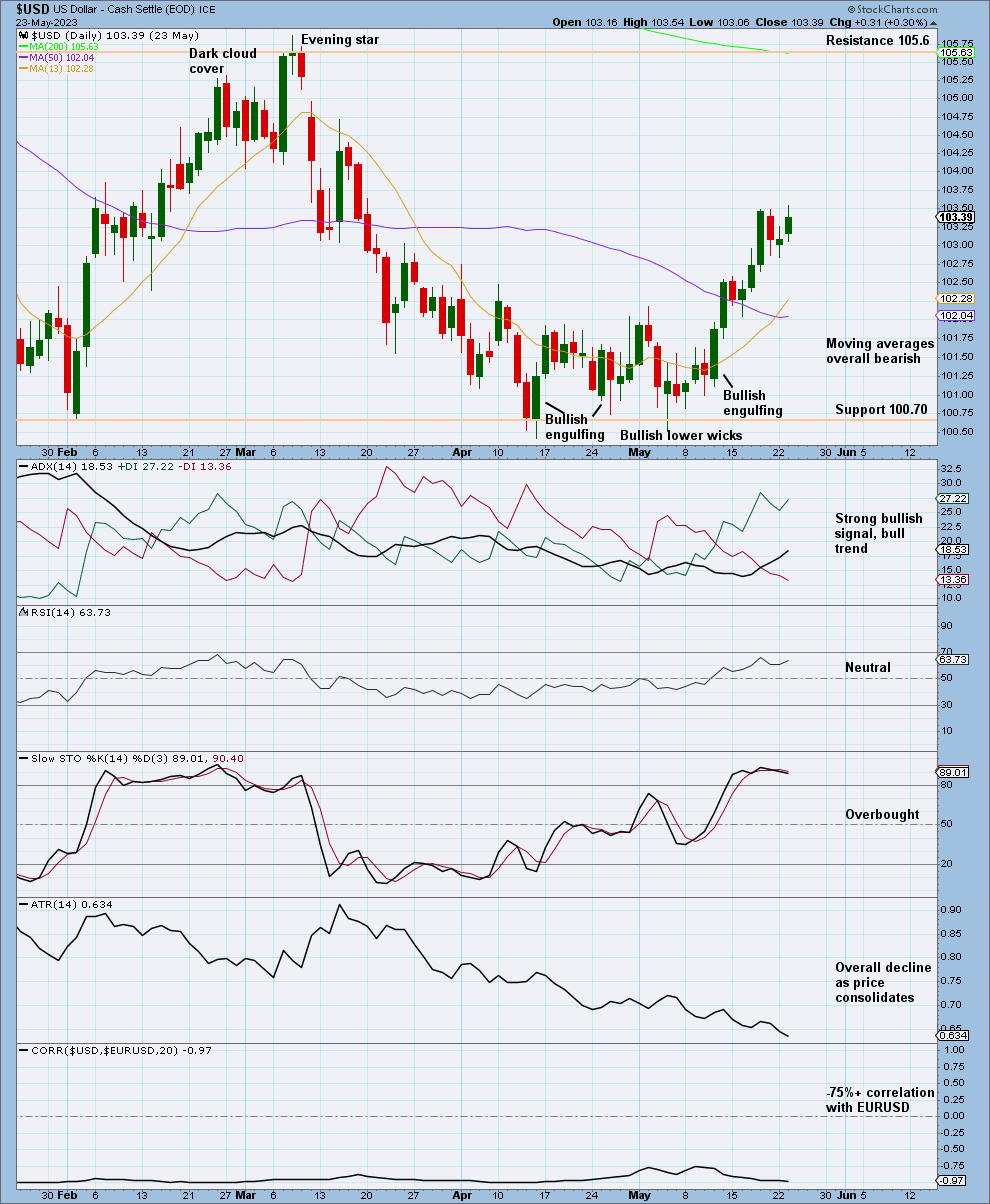
Click chart to enlarge.
Bullish lower wicks and multiple bottom reversal patterns support the recent price movement upwards.
The moving averages are overall bearish with the 200 day sloping down, 50 day flat, and 13 day sloping up. Price is trading below the 200, but above the 13 day and 50 day.
ADX recently gave a bullish signal. The new bullish trend has much further to go before it reaches extreme.
With ATR decreasing with bullish price movement, volatility could be limited to the upside.
The daily chart shows a consistent reliable inverse correlation with the EURUSD. Usually at -0.7 to -1, but occasionally in the past has shown correlations as low as -0.4 at extreme tops and bottoms.
Published @ 08:08 p.m. ET.
—
Careful risk management protects your trading account(s).
Follow our two Golden Rules:
1. Always trade with stops.
2. Risk only 1-5% of equity on any one trade.
—
New updates to this analysis are in bold.
—
 Save as PDF