May 2, 2023: XRP-USD Elliott Wave and Technical Analysis – Video and Charts
Summary: XRP may have found a sustainable low in November 2022. A third wave at primary and cycle degree may have begun. A possible target is calculated at 8.10, which may be met in June 2025.
The data used for this analysis comes from CryptoCompare.
Last full written analysis of XRP was on February 3, 2023.
All charts are on a semi-log scale.
MAIN ELLIOTT WAVE COUNT
MONTHLY
Click chart to enlarge.
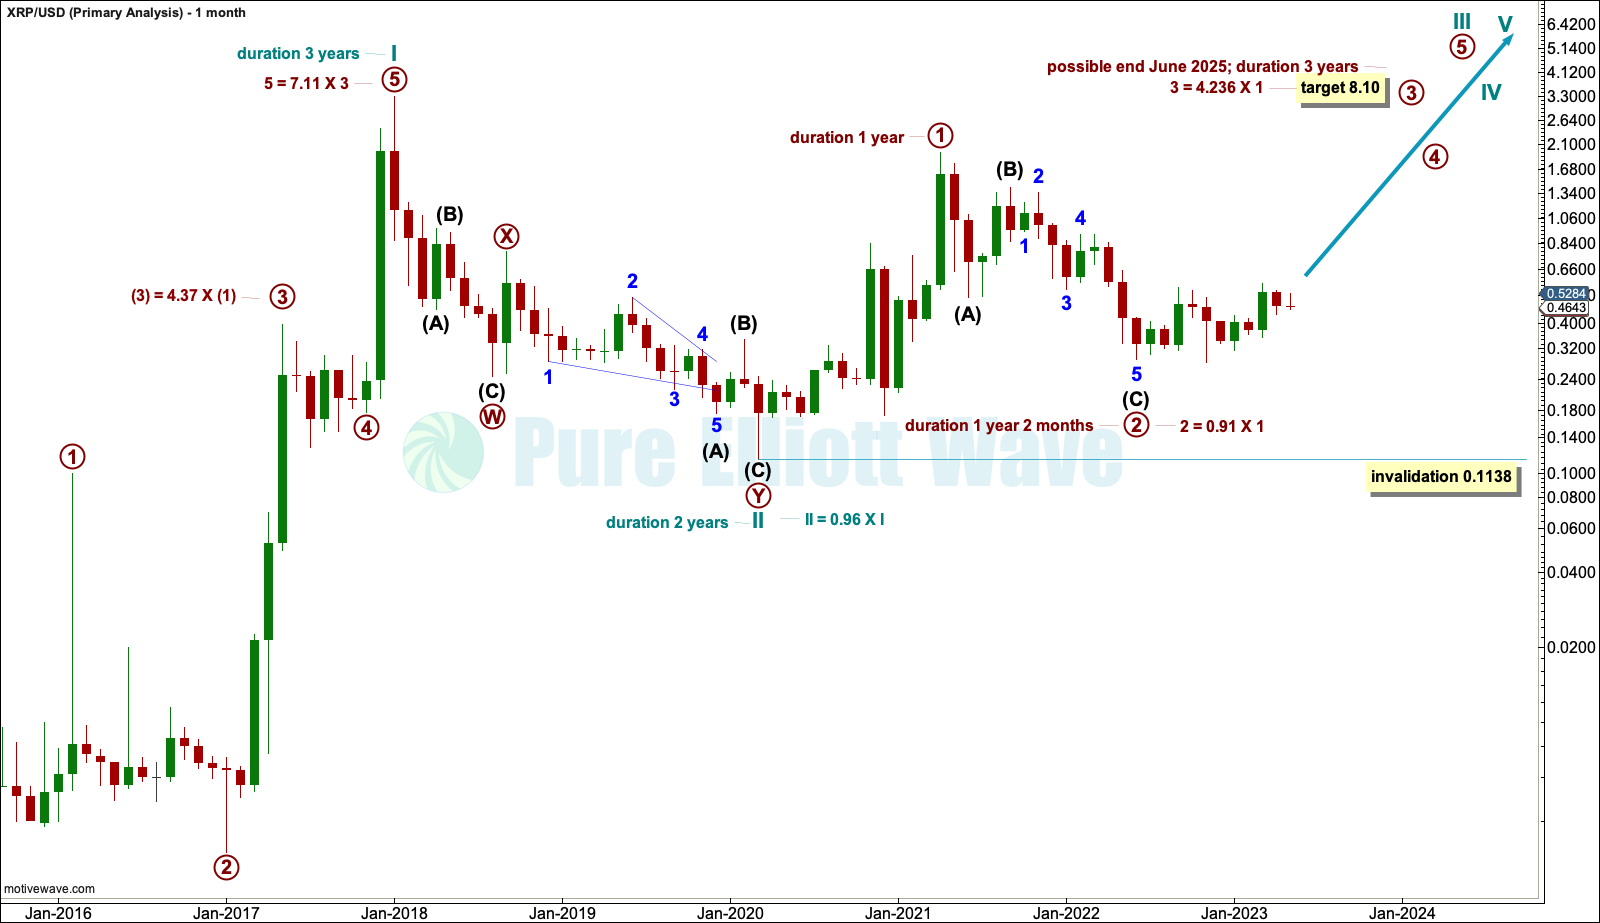
The wave count for XRP is very bullish.
An impulse may be unfolding higher. Within the impulse, cycle waves I and II may both be complete.
Within the impulse of cycle wave III, primary waves 1 and 2 may be complete. This wave count expects a third wave at cycle degree and primary degree may be in its early stages.
If primary wave 2 continues lower as a triple zigzag, then it may not move beyond the start of primary wave 1 below 0.1138. However, it is extremely likely now that primary wave 2 is over. If it were to continue lower, then it would now be longer in duration than cycle wave II one degree higher. Primary wave 2 at its end has already retraced 91% of primary wave 1, so it is unlikely to move deeper.
Wave lengths and durations are noted on this chart. The target for primary wave 3 is recalculated using a Fibonacci ratio. Primary wave 3 within cycle wave III is extremely likely to be extended; if it extends, then it would do so in both price and time. Primary wave 3 may last a Fibonacci 3 years.
WEEKLY
Click chart to enlarge.
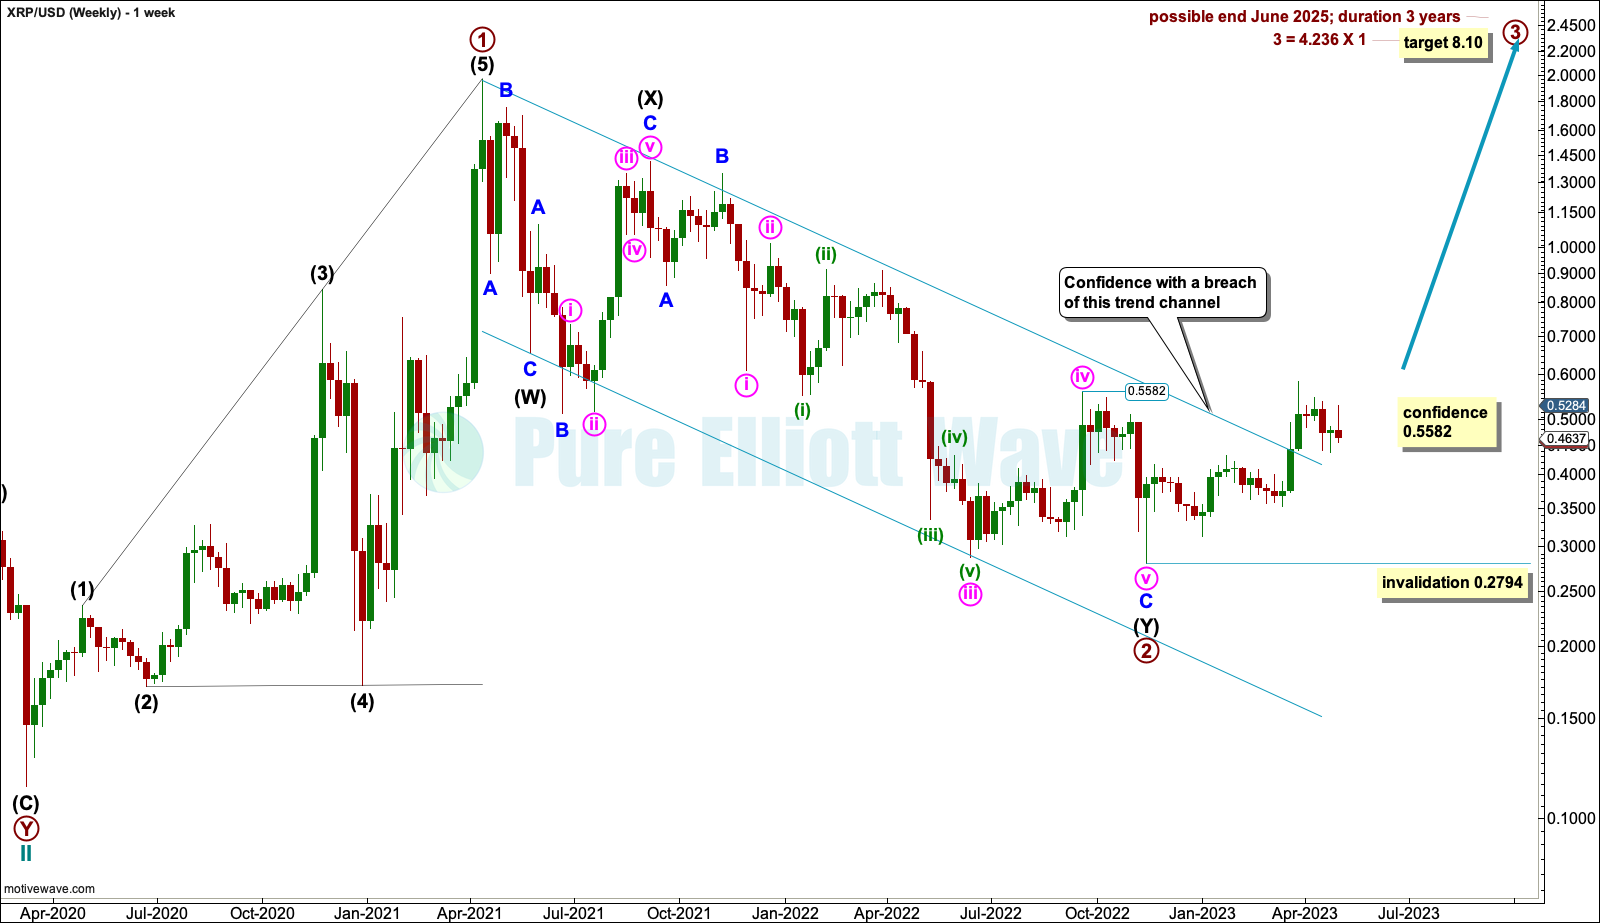
Primary wave 1 may have completed as a leading expanding diagonal.
Primary wave 2 may be complete as a double zigzag.
A conservative channel is drawn about the bear market of primary wave 2 to contain all movement. A breach of this channel adds confidence to this wave count.
A new high above 0.5582 also adds confidence. This was the last swing high within the prior bear market. A new high above this point breaks the series of lower highs and lower lows, the basic definition of a downwards trend; this indicates a trend change.
DAILY
Click chart to enlarge.
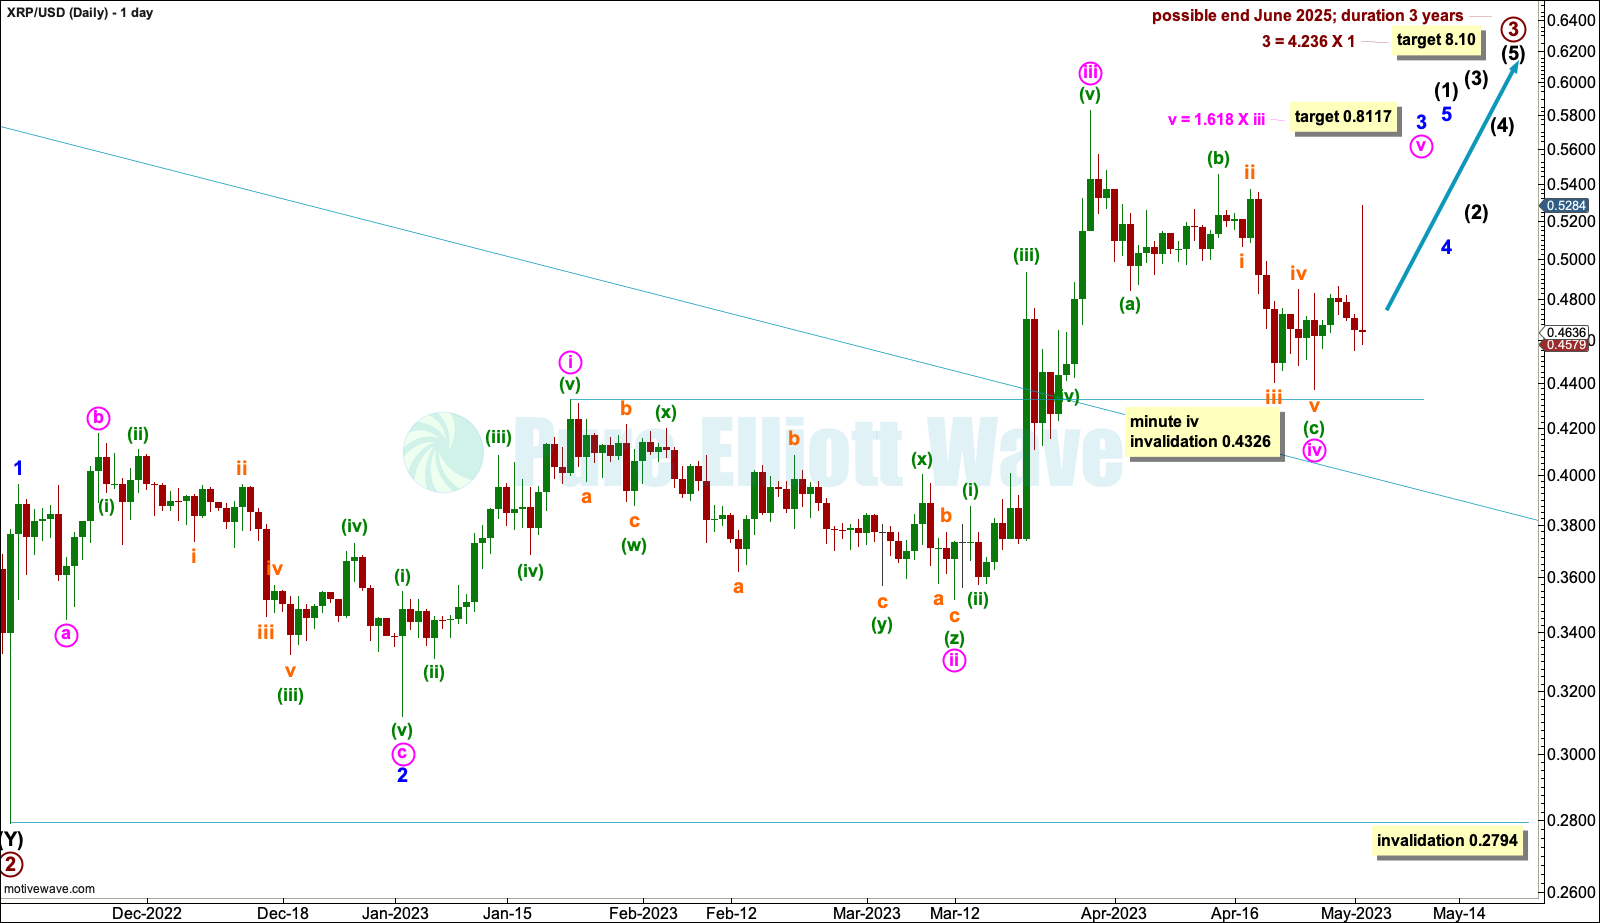
Primary wave 2 may be complete.
Primary wave 3 upwards may have begun. At 8.10 primary wave 3 would reach 4.236 times the length of primary wave 1.
Within the new trend, intermediate wave (1) may be incomplete.
Within intermediate wave (1): Minor waves 1 and 2 may be complete and, within minor wave 3, minute waves i through to iv may be complete. At 0.8117 minute wave v would reach 1.618 the length of minute wave iii. If minute wave iv continues lower, then it may not move into minute wave i price territory below 0.4326.
When intermediate wave (1) may be complete, then intermediate wave (2) should unfold over several weeks and may not move beyond the start of intermediate wave (1) below 0.2794.
TECHNICAL ANALYSIS
WEEKLY
Click chart to enlarge.
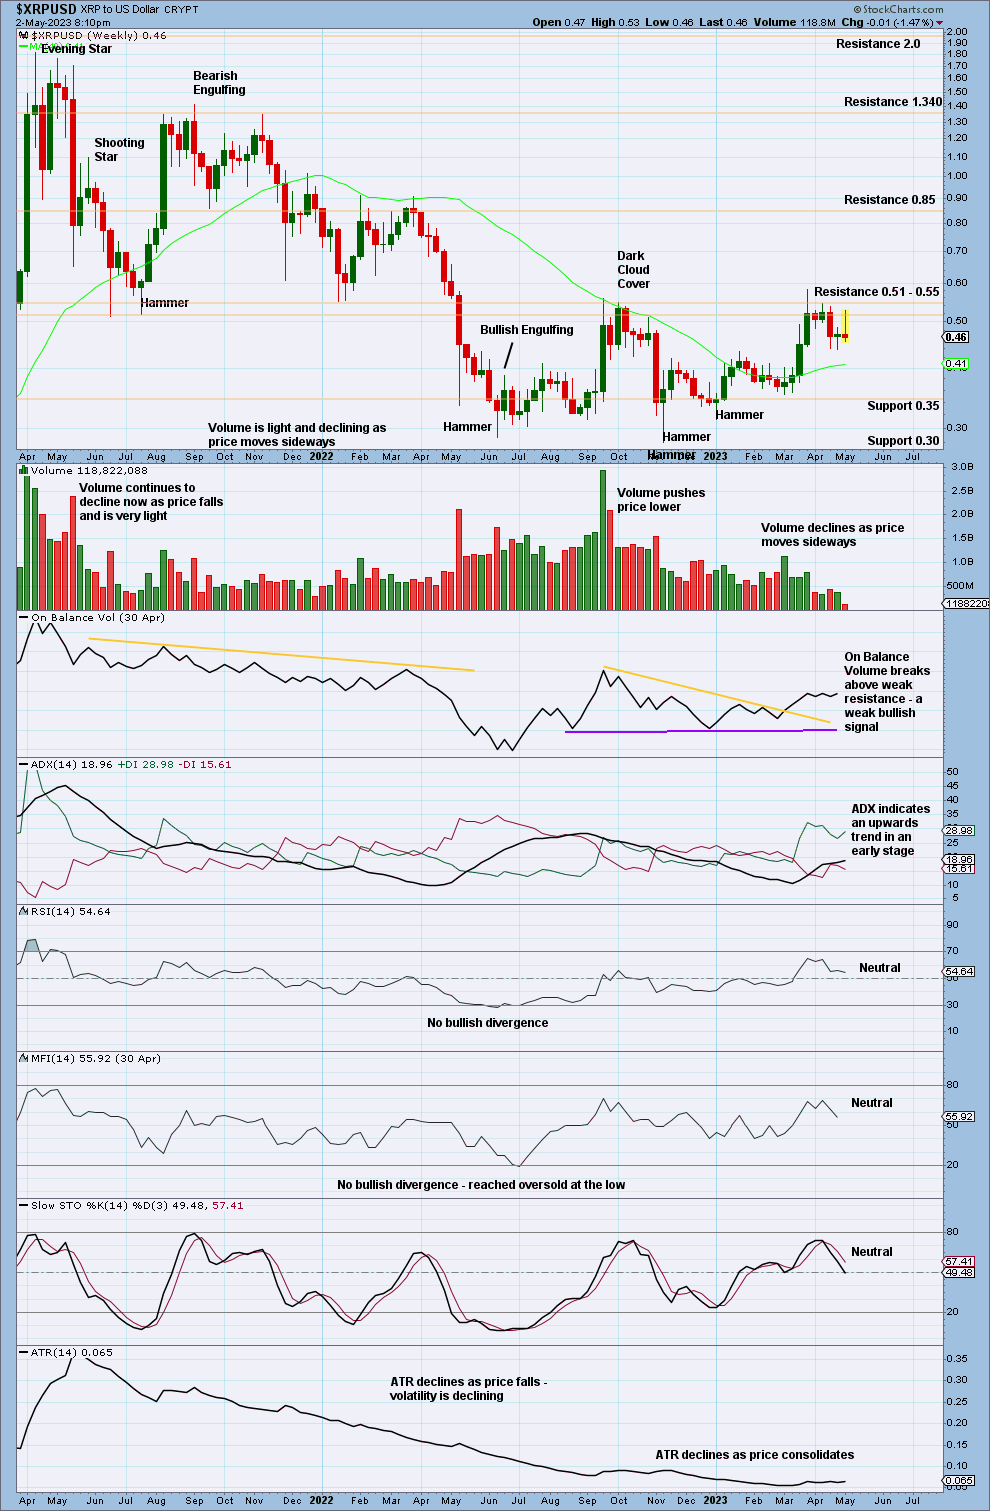
An upwards trend is now indicated to be in an early stage.
Price is currently close to a strong zone of resistance about 0.51 to 0.55. A clear break above this area would release energy to the upside.
DAILY
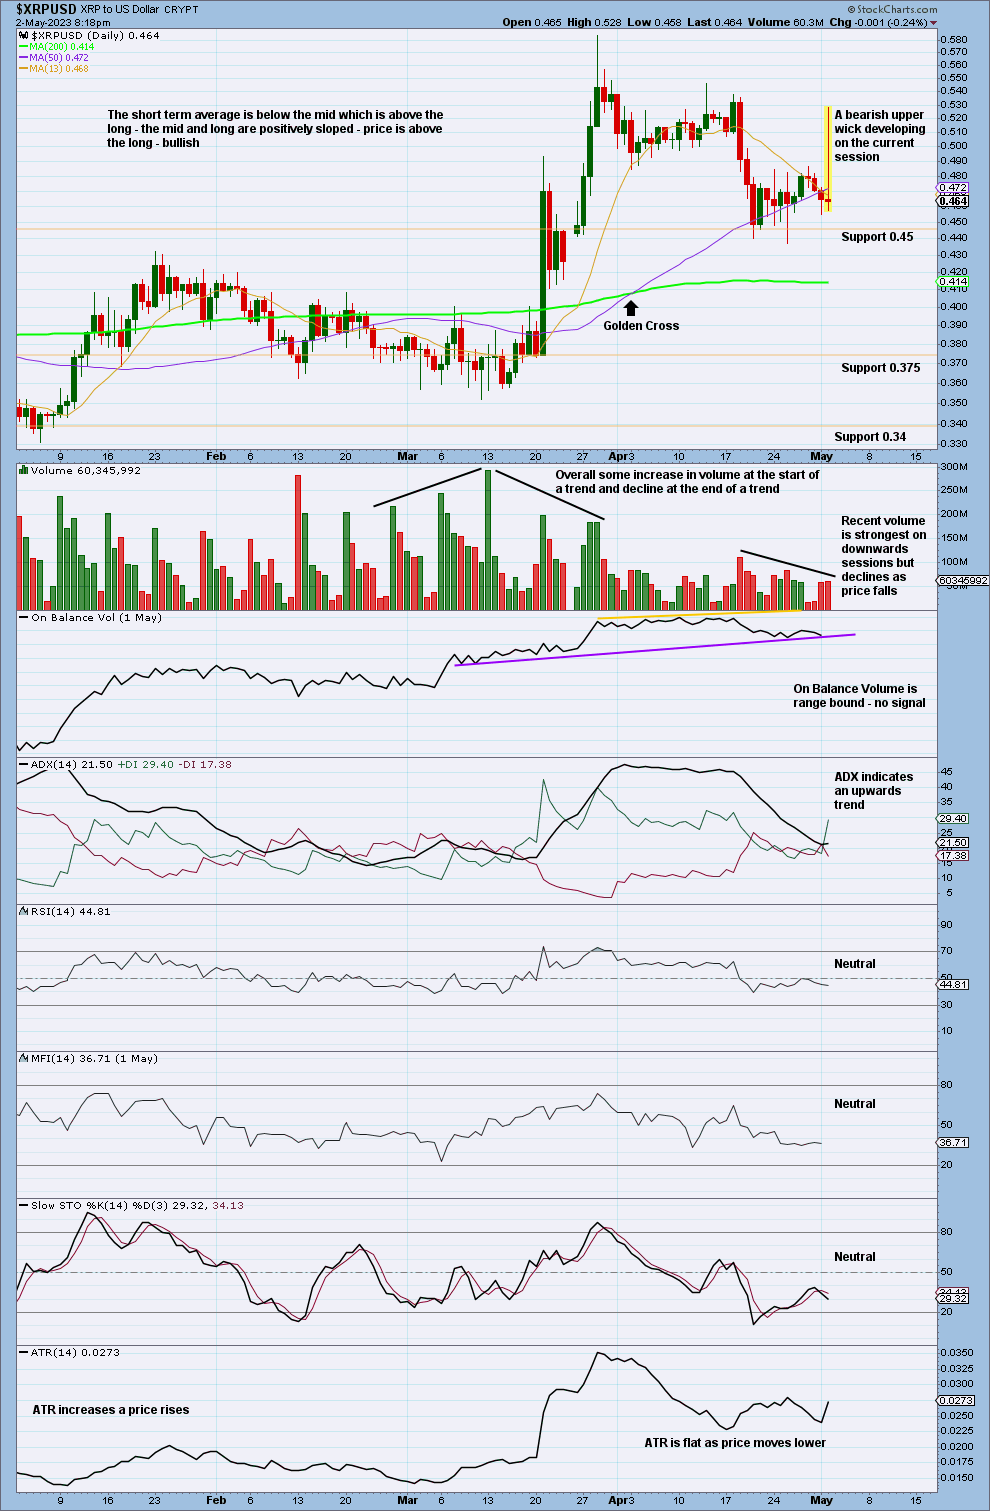
Click chart to enlarge.
The upwards trend reached extreme at the last high. Now a pullback has pulled ADX back down. A new upwards trend is now indicated.
The short-term volume profile is bearish. The pullback may not be complete.
Published @ 07:02 p.m. ET.
—
Careful risk management protects your investments.
Follow my two Golden Rules:
1. Invest only funds you can afford to lose.
2. Have an exit plan for both directions – where or when to take profit, and when to exit a losing investment.
—
New updates to this analysis are in bold.
–