June 24, 2023: ETH-USD (Ethereum) Elliott Wave and Technical Analysis – Video and Charts
Alternatively, it is possible that a downwards swing to a target at 1,397.59 may occur before the next bullish begins.
The data used for this analysis comes from CryptoCompare.
All charts are on a semi-log scale.
MAIN ELLIOTT WAVE COUNT
MONTHLY
Click chart to enlarge.
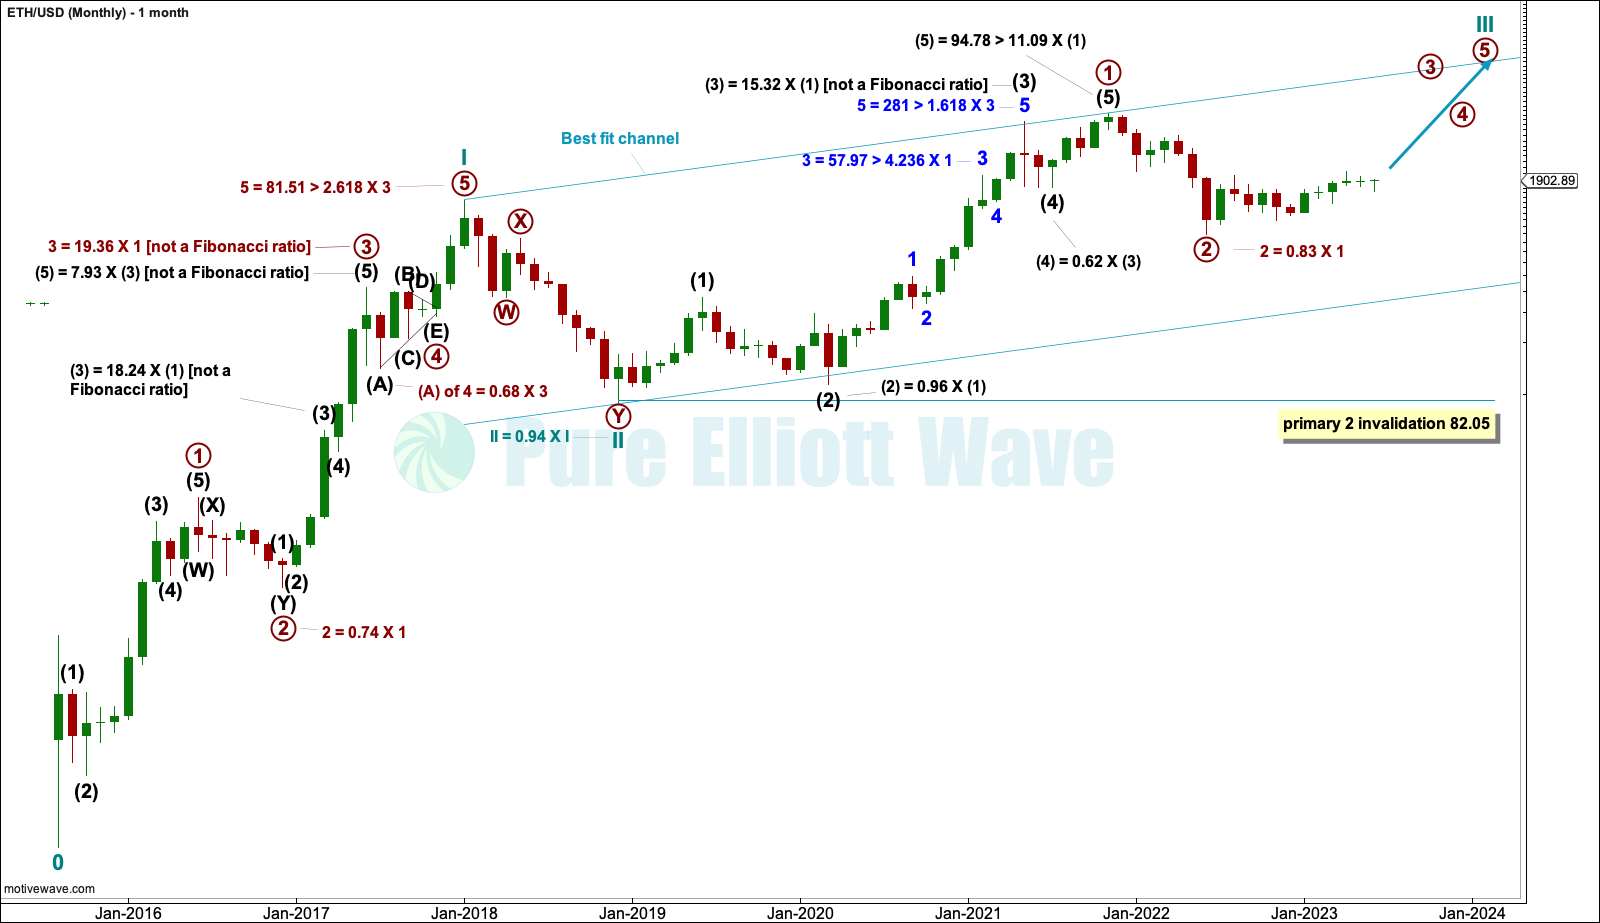
The monthly chart looks at the entire price history of Ethereum. The Elliott wave count begins at the low of October 2015.
From October 2015 to December 2017 this upwards wave subdivides perfectly as an Elliott wave impulse, labelled cycle wave I. The impulse lasted just over two years, which is within the expected duration for a cycle degree wave, so confidence that this degree of labelling is correct may be had.
Within cycle wave I, note that wave lengths noted on the chart are not Fibonacci ratios but guides to expected behaviour for Ethereum. Prior Ethereum price history exhibits very long third waves and fifth waves which are longer than third waves (with the exception of intermediate wave (5) within primary wave 1 within cycle wave III, and also of intermediate wave (5) within primary wave 1 within cycle wave I).
The depth of primary wave 2 and the deepest part of primary wave 4 within cycle wave I are also noted. Ethereum has had deep corrections, but not as deep as other cryptocurrencies.
Within cycle wave III, primary wave 2 may not move beyond the start of primary wave 1 below 82.05. If primary wave 2 within cycle wave III is over at the last low, then it would be 0.83 of primary wave 1. This is a normal to be expected depth.
Cycle wave III may only subdivide as an impulse. It must move far enough above the end of cycle wave I to allow room for cycle wave IV to unfold and remain above cycle wave I price territory.
MAIN WAVE COUNT
WEEKLY
Click chart to enlarge.
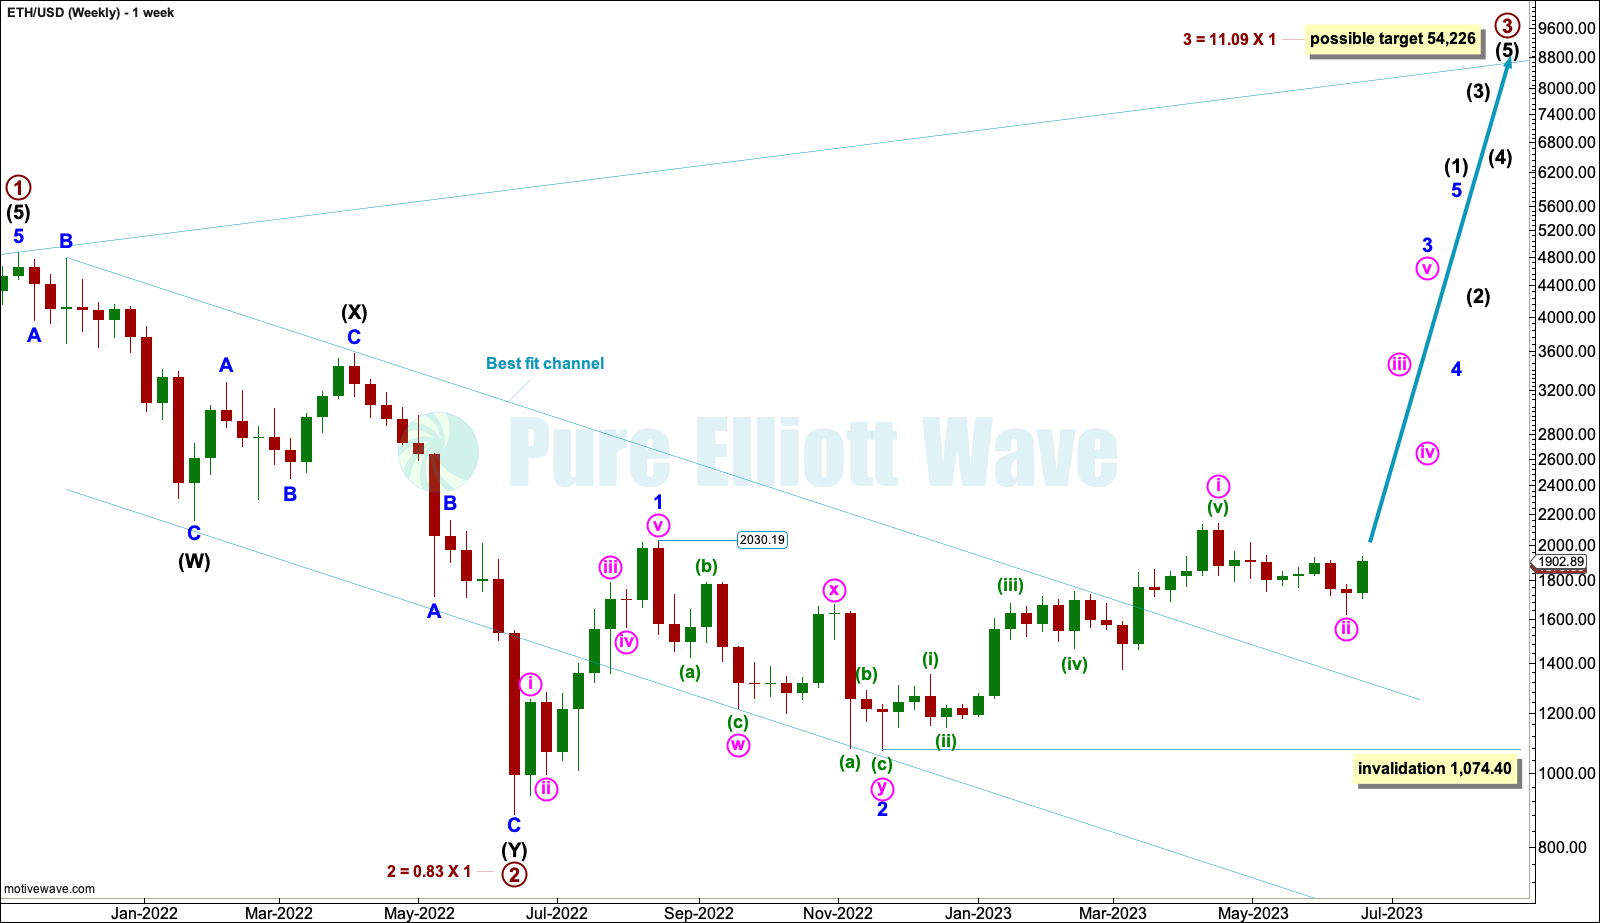
Primary wave 2 may be a complete double zigzag. Primary wave 3 within cycle wave III may be in its very early stages. This wave count is very bullish.
Within primary wave 3, intermediate wave (1) may be incomplete. However, in coming months it may be necessary to move the degree of labelling within primary wave 2 up one degree as it is possible that intermediate wave (1) could be complete.
When intermediate wave (1) may be complete, then intermediate wave (2) should unfold as a deep correction that may last a few weeks. Intermediate wave (2) may not move beyond the start of intermediate wave (1) below 896.109.
Intermediate wave (1) may have begun with two overlapping first and second waves for minor waves 1 and 2 and now minute waves i and ii.
Two daily charts below look at the possibility of minute wave ii complete and minute wave ii incomplete.
Minute wave ii may not move beyond the start of minute wave i below 1,074.40.
MAIN DAILY
Click chart to enlarge.
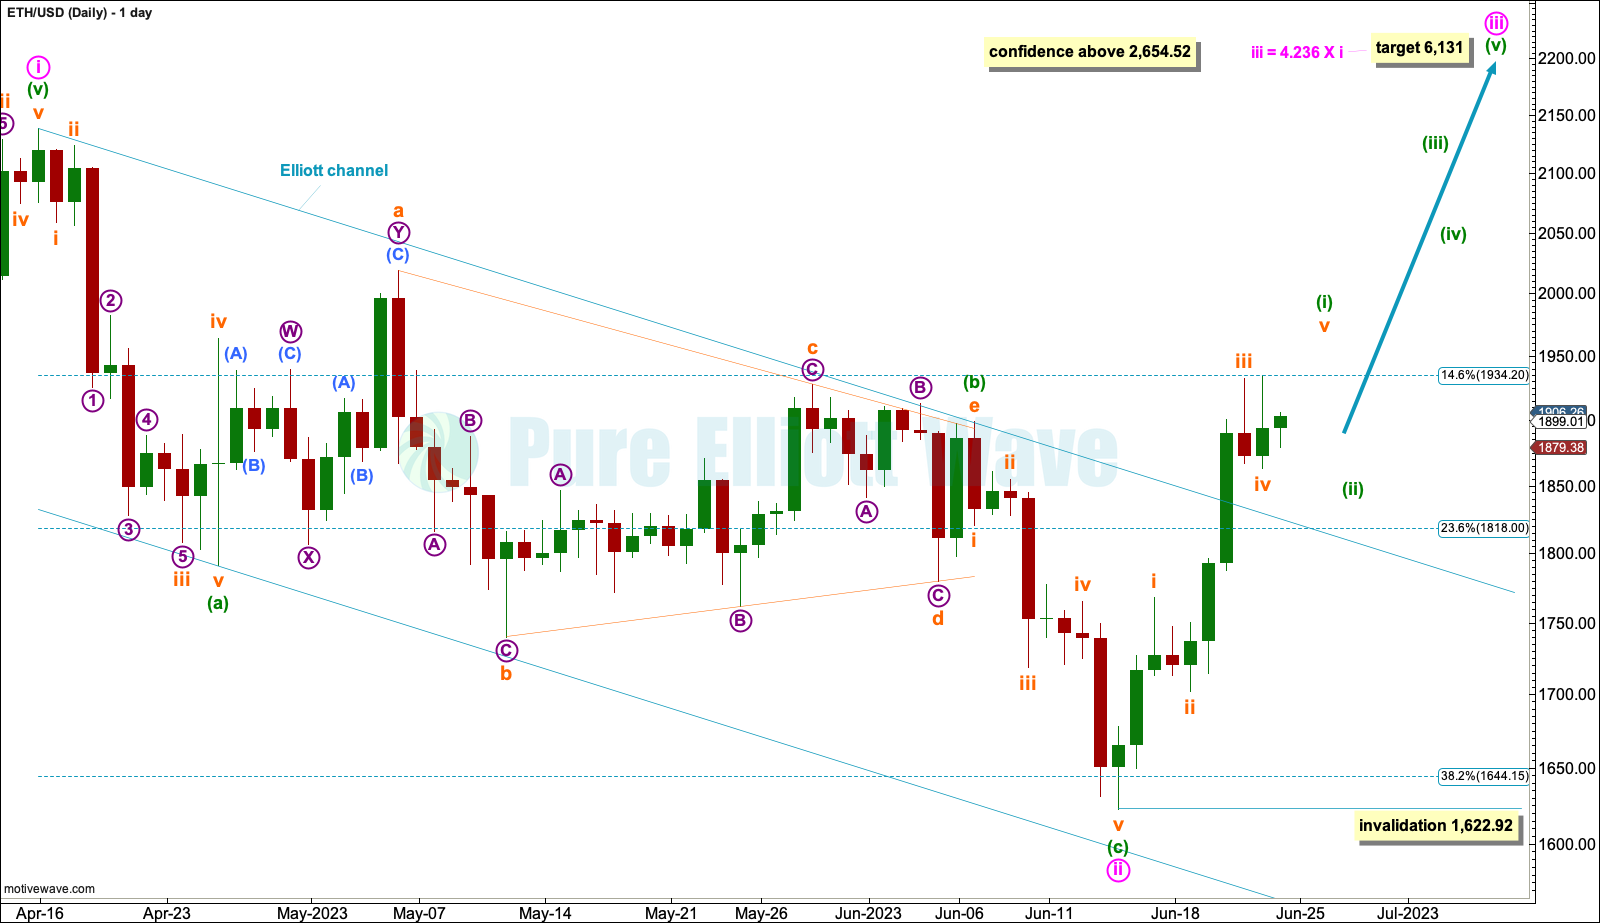
It is possible that minute wave ii may be a complete zigzag ending close the logarithmic function of the 0.382 Fibonacci ratio of minute wave i at 1,622.92. The strong upwards pull of a large third wave may have forced minute wave ii to be more brief and shallow than normal.
Minute wave iii may only subdivide as an impulse. Within the impulse: Minuette wave (i) may be incomplete and minuette wave (ii) to come may not move beyond the start of minuette wave (i) below 1,622.92.
A target is calculated for minute wave iii to reach 4.236 the length of minute wave i at 6,131. This is for Ethereum a reasonable target, but if it is wrong, then it may be too low.
If the degree of labelling within primary wave 3 is moved up one degree, then the wave count would currently see minor wave 3 within intermediate wave (3) within primary wave 3 within cycle wave III beginning now. A third wave at four large degrees would be expected to be explosive throughout its middle and even more explosive at the end of each third wave.
ALTERNATE DAILY
Click chart to enlarge.
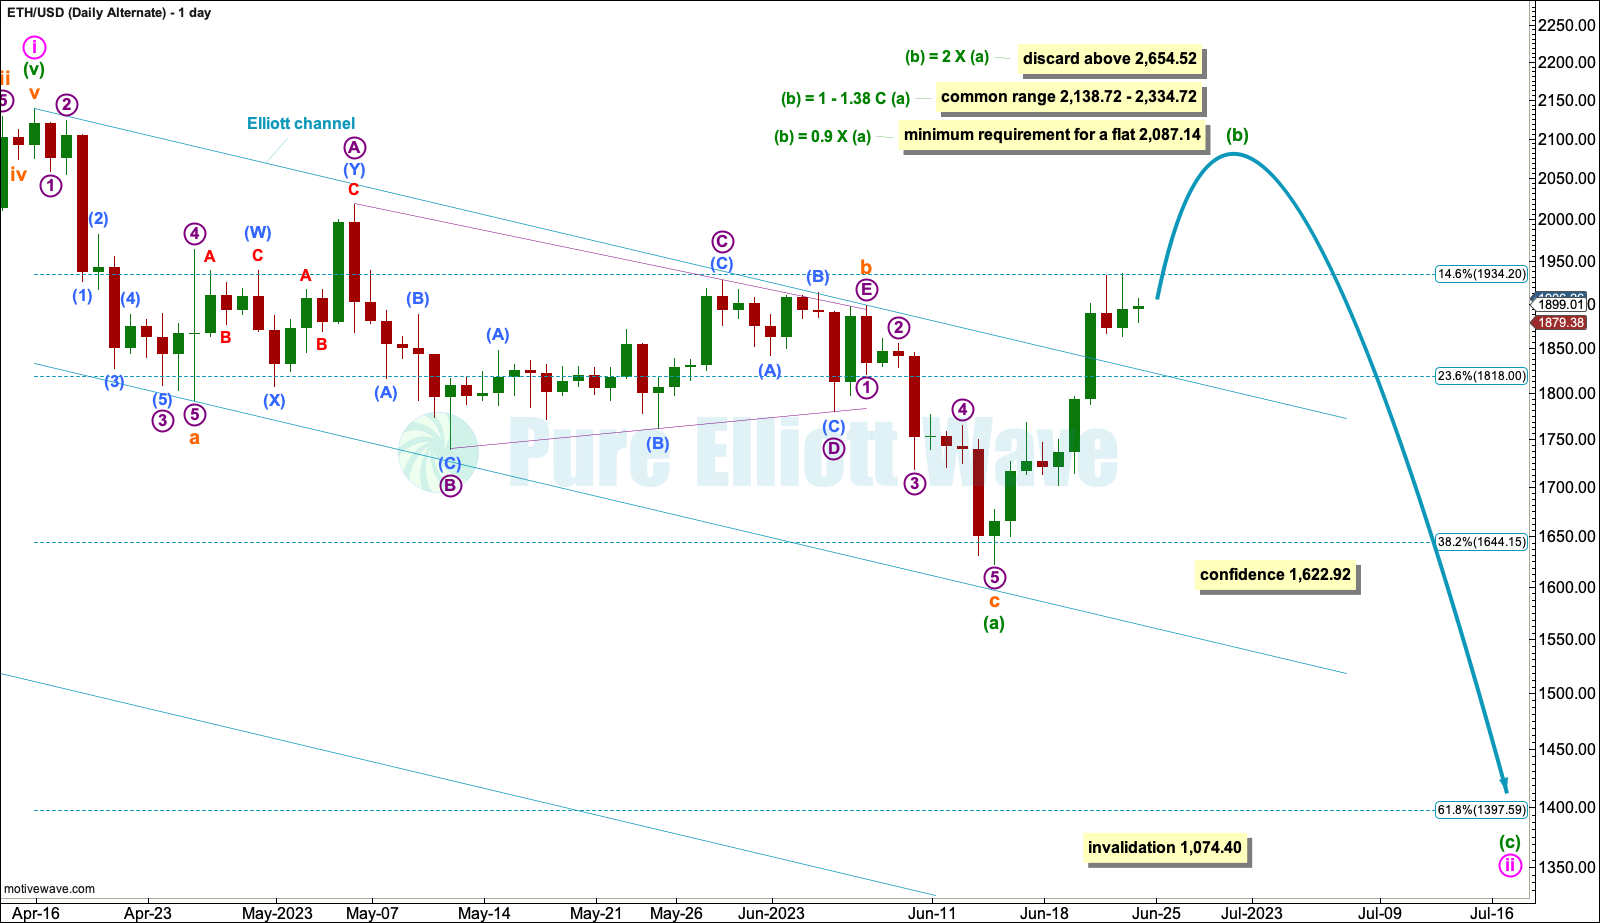
If the degree of labelling within the zigzag down is moved down one degree, it is possible that minute wave ii may be an incomplete flat, double zigzag or double combination. Only a flat is shown on this chart as that is a common structure.
Within the flat: Minuette wave (a) may be a complete zigzag and minuette wave (b) would now need to continue higher to reach a minimum 0.9 length of minuette wave (a) at 2,087.14. The common range for minuette wave (b) within a flat is from 1 to 1.38 times the length of minuette wave (a) giving a range from 2,138.72 to 2,334.72.
There is no Elliott wave rule stating a limit for B waves within flats. There is a convention that states when wave B is more than twice the length of wave A, the idea of a flat should be discarded based upon a very low probability. This wave count should be discarded above 2,654.52. However, in practice it may be discarded earlier using classic technical analysis techniques. B waves should exhibit weakness in one or more of volume, range, strength, or momentum. If price moves above 2,138.72 and there is strength and no weakness, then this wave count may be discarded.
When minuette wave (b) of a possible flat may be complete, then a target may be calculated for minuette wave (c). For now the target would be the logarithmic function of the 0.618 Fibonacci ratio at 1,397.59.
Minute wave ii may not move beyond the start of minute wave i below 1,074.40.
TECHNICAL ANALYSIS
WEEKLY
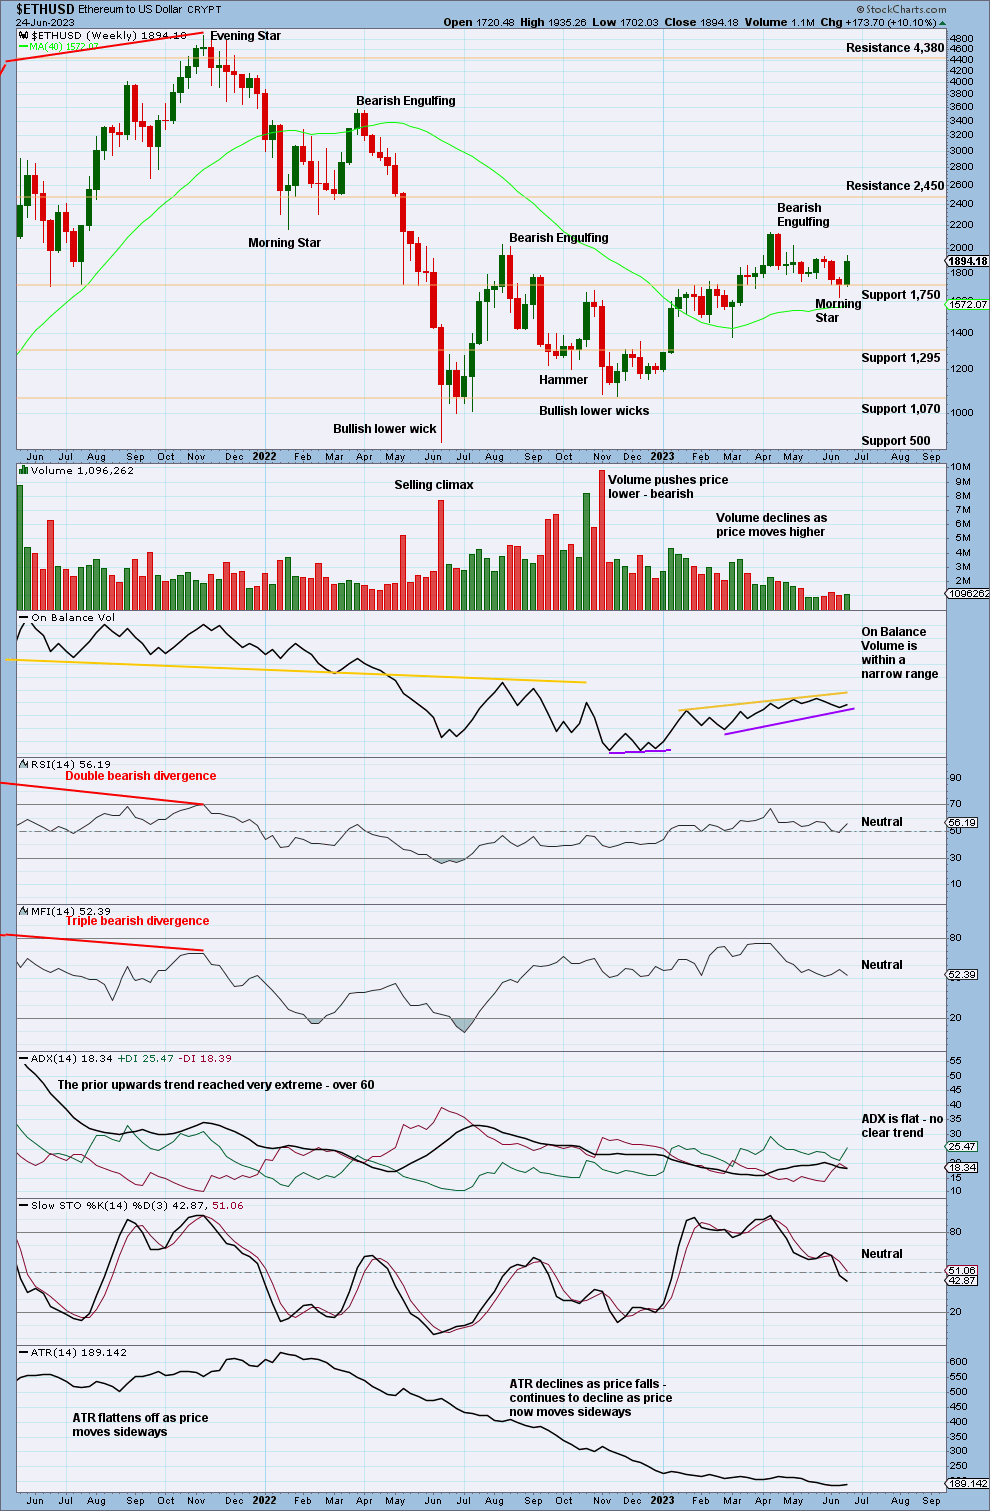
Click chart to enlarge.
RSI reached oversold on the weekly chart at the low in June 2022. This has only happened once before, in December 2018, which was a sustainable low.
Currently, ADX indicates no clear trend, but it will not take much to turn the ADX line back up to indicate an upwards trend.
Price is bouncing up off support about 1,750, and the Morning Star reversal pattern has a little support from volume in the third bullish candlestick, so it looks like support here may hold. This chart offers a little support to the main daily Elliott wave analysis.
DAILY
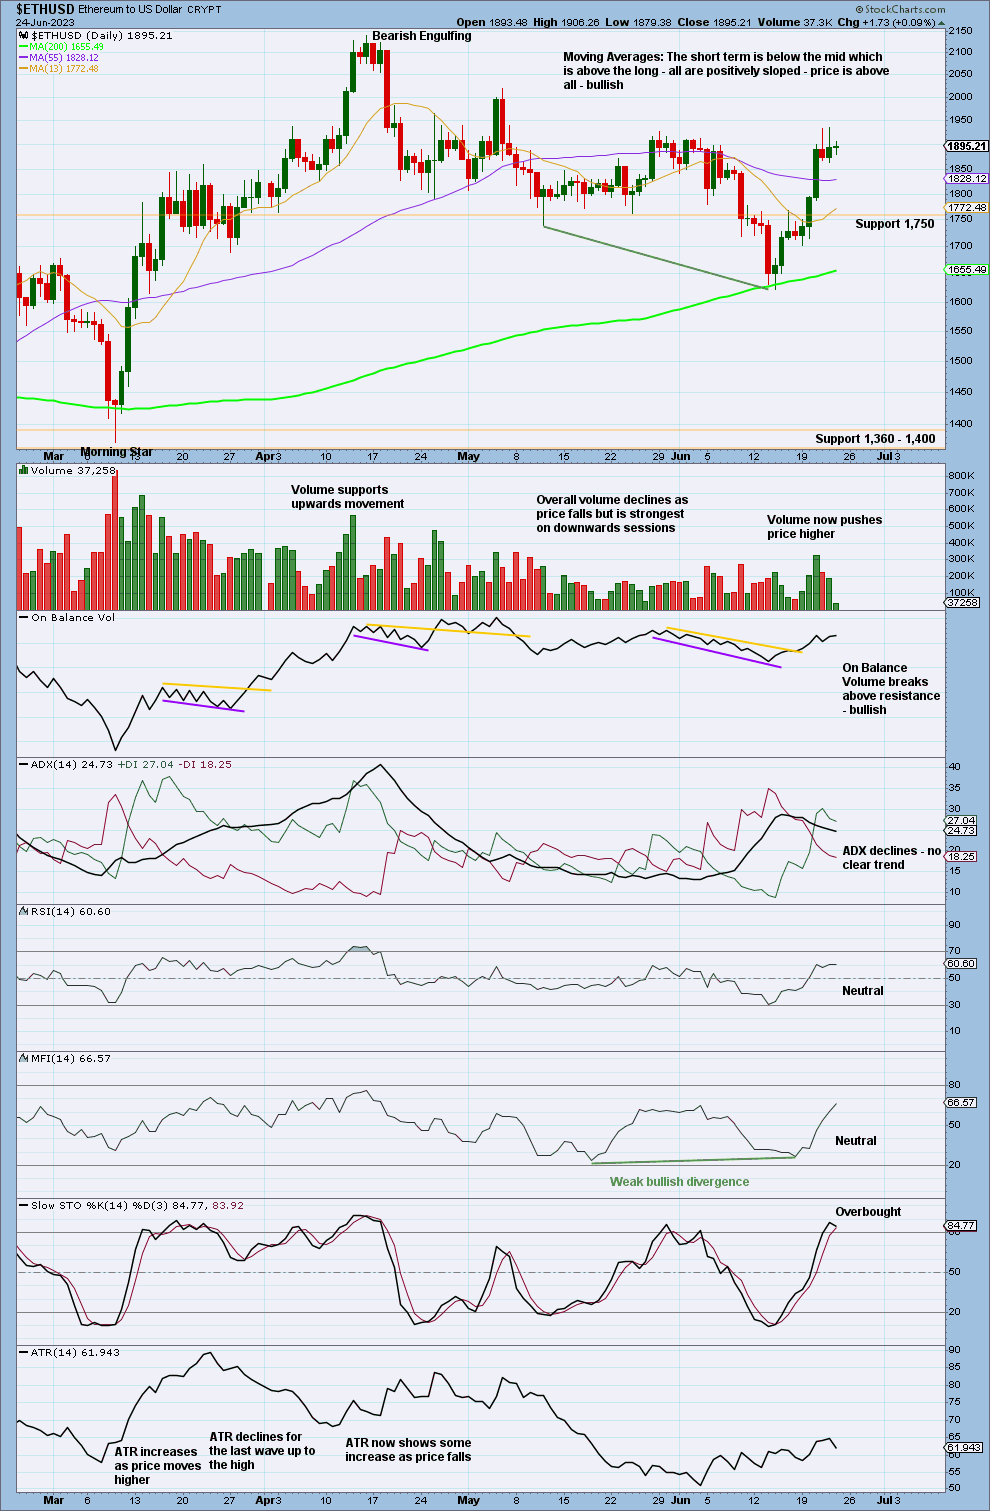
Click chart to enlarge.
At the low in June 2023, RSI was very close to oversold, MFI exhibited bullish divergence (and still does), and ADX indicated a downwards trend that was not extreme. Volume is now pushing price higher. It is possible that the June low may be sustained.
Published @ 11:43 a.m. ET.
—
Careful risk management protects your investments.
Follow my two Golden Rules:
1. Invest only funds you can afford to lose.
2. Have an exit plan for both directions – where or when to take profit, and when to exit a losing investment.
—
New updates to this analysis are in bold.
–