June 21, 2023: RIOT Elliott Wave and Technical Analysis – Video and Charts
Summary: Upwards movement is expected to a short-term target at 13.788. Thereafter, another multi-week correction may begin that should remain above 3.250.
A new long-term target is calculated at 338, which may be a few years away.
ELLIOTT WAVE COUNT
MONTHLY CHART
Click chart to enlarge.
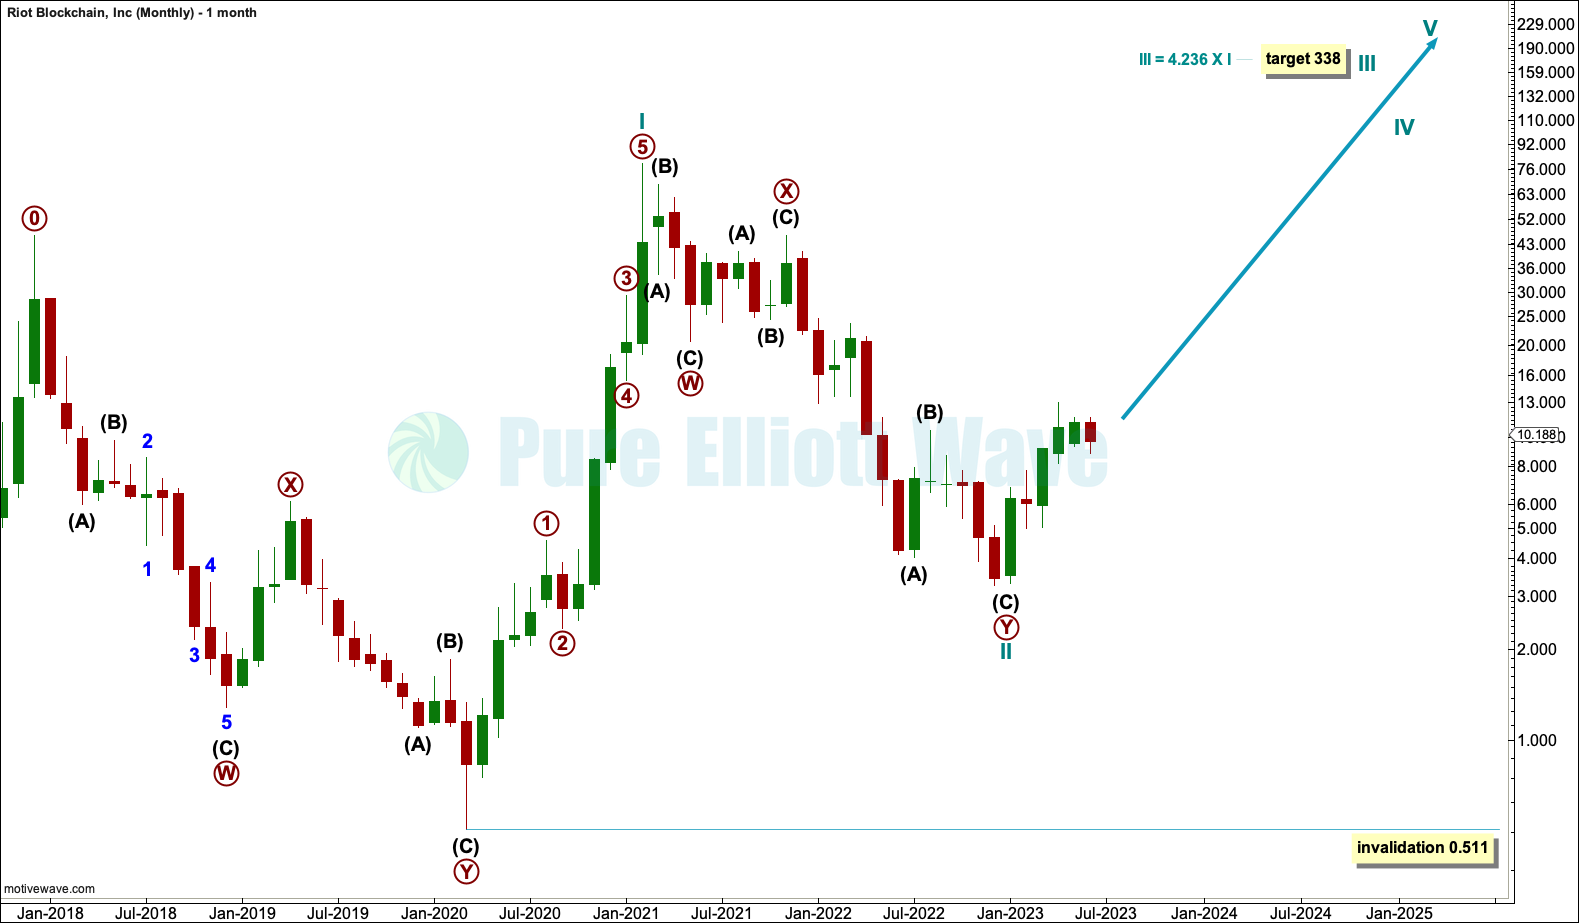
It is difficult to see where to begin the Elliott wave count for RIOT. I have analysed the structure of the bear market from December 2017 to March 2020 as a double zigzag, which is a counter trend structure, and I will see a first wave beginning at the end of it.
It is possible to see from the March 2020 low a completed five wave impulse up to the high in February 2021. This is labelled cycle wave I.
Cycle wave II may be a complete double zigzag. If it moves lower, then cycle wave II may not move beyond the start of cycle wave I below 0.511.
WEEKLY CHART
Click chart to enlarge.
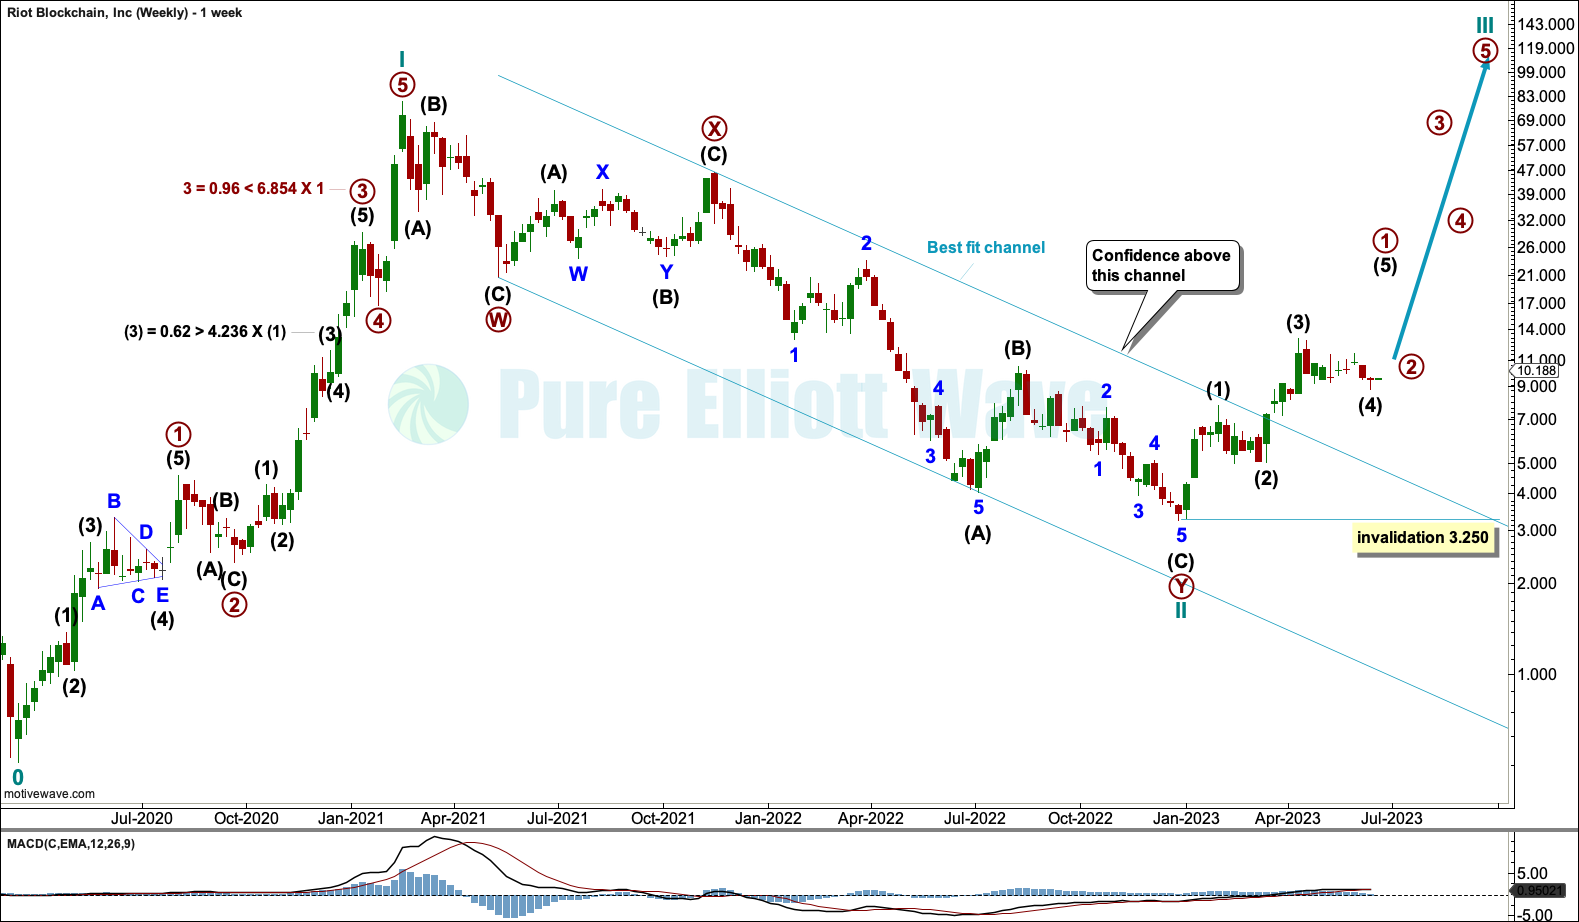
The weekly chart focuses on cycle waves I and II. Where I have found Fibonacci ratios between actionary waves within cycle wave I, these are noted on the chart. It is my judgement that a variation of less than 10% from a perfect ratio is sufficient to say the two waves exhibit a Fibonacci ratio to each other.
Where no Fibonacci ratios have been found then no notation has been made.
RIOT appears to exhibit Fibonacci ratios occasionally, but not regularly. These ratios are extreme compared to most equities but less extreme compared to most cryptocurrencies in my experience with these markets.
This may be useful in target calculation.
Cycle wave II may be a complete double zigzag. The channel about cycle wave II is confidently breached by upwards movement, which suggests the bear market labelled cycle wave II may be over.
Cycle wave I lasted just 4 weeks short of 1 year. Cycle wave II has lasted about 1.5 years. These durations look about right for cycle degree.
Cycle wave II is a 96.5% correction of cycle wave I; there would be almost no room left for it to continue lower. If cycle wave II were to continue lower, then it may do so as a triple zigzag (but this type of corrective structure is uncommon).
DAILY CHART
Click chart to enlarge.
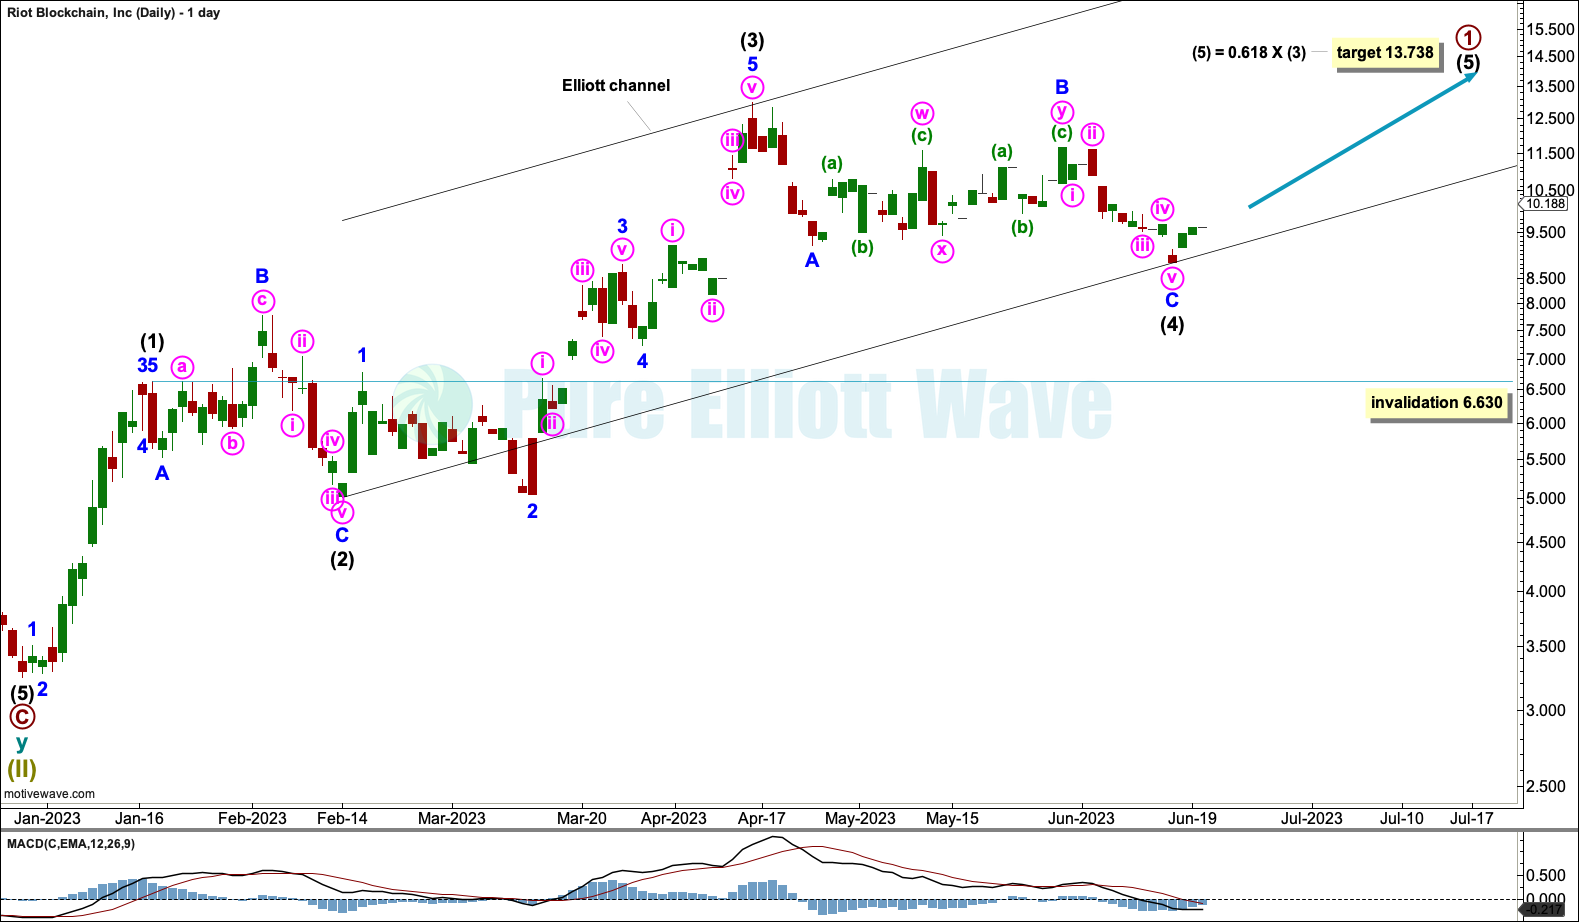
Within the new upwards trend, the first five up for primary wave 1 looks like an incomplete impulse.
Within the impulse: Intermediate wave (2) subdivides as an expanded flat and intermediate wave (4) as a zigzag, giving good alternation.
A channel is drawn using Elliott’s second technique. Draw the first trend line from the ends of intermediate waves (2) to (4), then place a parallel copy on the end of intermediate wave (3). Intermediate wave (5) may end midway within the channel. When the channel is breached by subsequent downwards movement, then it may be used to indicate a trend change.
At 13.738 intermediate wave (5) would reach 0.618 the length of intermediate wave (3).
If intermediate wave (4) continues lower, then it may not move into intermediate wave (1) price territory below 6.630.
TECHNICAL ANALYSIS
WEEKLY CHART
Click chart to enlarge. Chart courtesy of StockCharts.com.
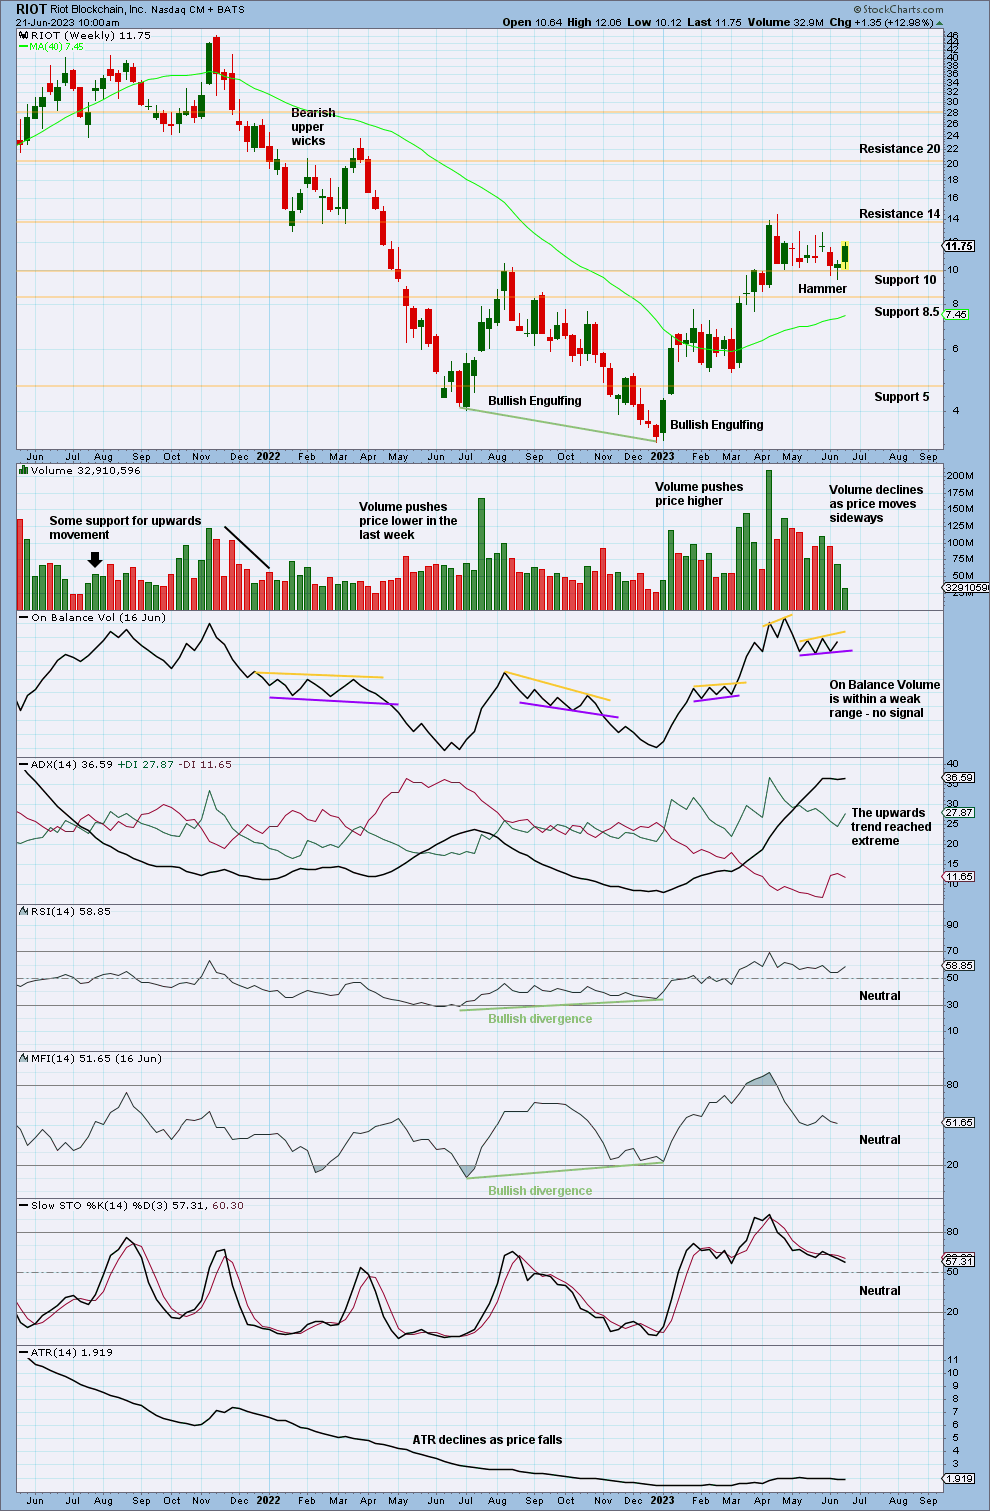
At the December 2022 low, RSI and MFI had reached oversold then exhibited bullish divergence and ADX had not exhibited an extreme downwards trend. At the low is a strong Bullish Engulfing reversal pattern that should be given weight. This low is reasonably likely now to be sustained for the long term.
Currently, ADX indicates the new upwards trend has reached extreme. RSI has reached overbought as has MFI, but they have not yet exhibited divergence. The trend may become a little more extreme and RSI and MFI may exhibit divergence before a trend change. An Elliott fifth wave would fit this nicely.
Price is consolidating with resistance about 14 and support about 10. The Hammer candlestick suggests a short-term low.
DAILY CHART
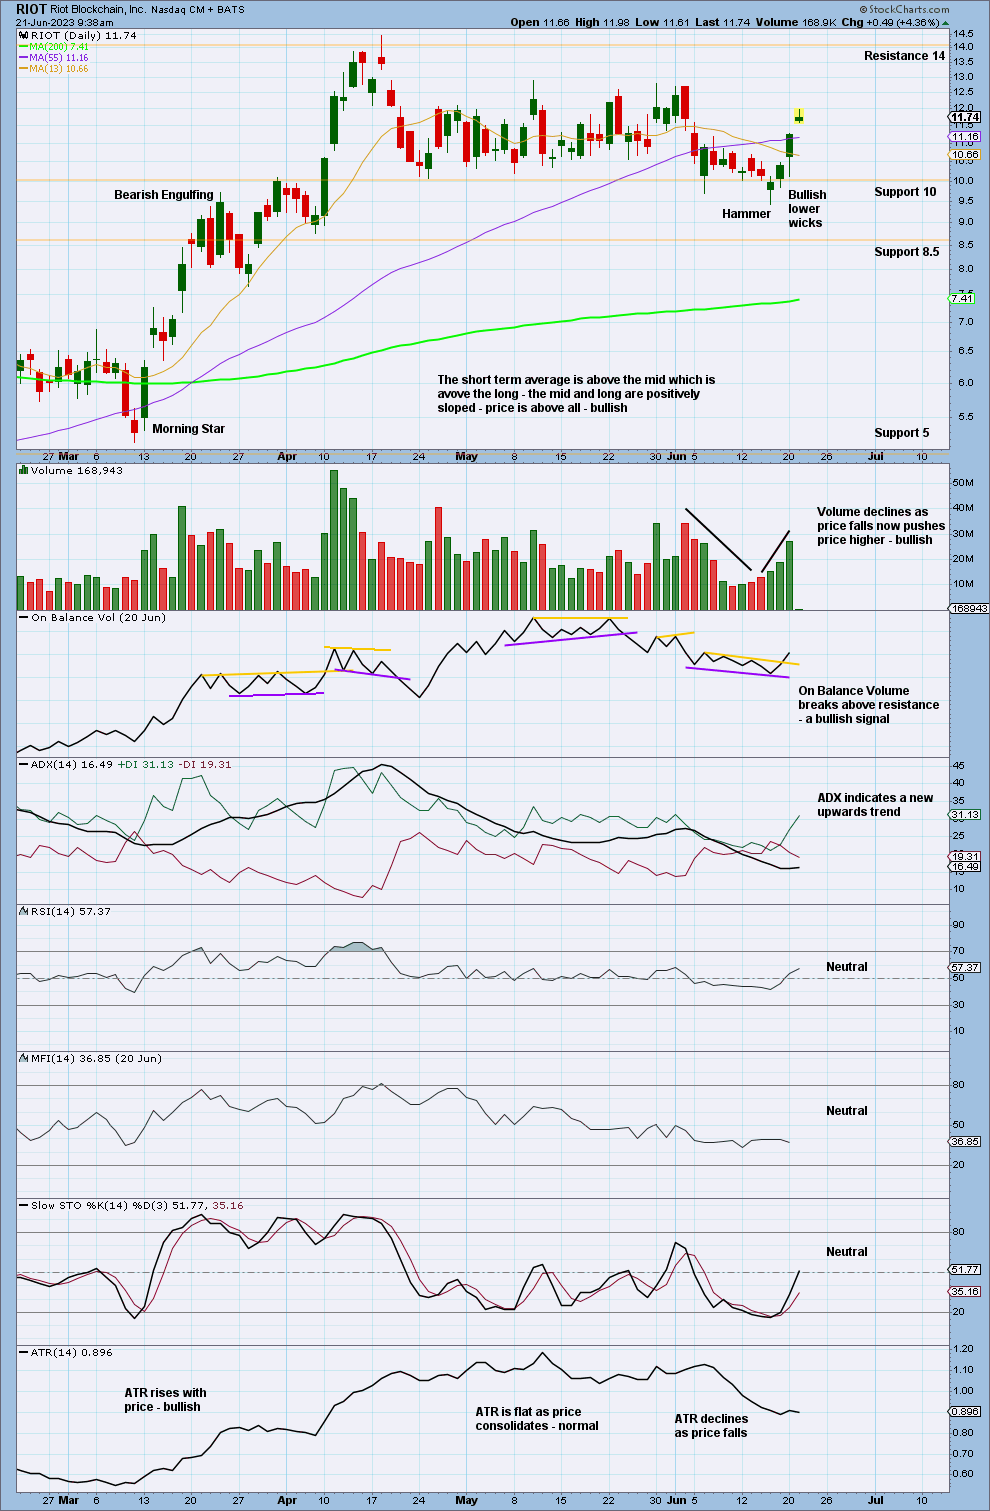
Click chart to enlarge. Chart courtesy of StockCharts.com.
For the short term, volume is pushing price higher with bullish lower wicks. Expect upwards movement here.
Today ADX gives a strong bullish signal, a new upwards trend. RSI and MFI are not overbought; there is a long way to go before this trend is extreme at this time frame.
Published @ 01:00 p.m. ET.
—
Careful risk management protects your investment account(s).
Follow my two Golden Rules:
1. Invest only funds you are prepared to lose entirely.
2. Always have an exit strategy for both directions; when or where to take profit on a winning investment, and when or where to close a losing investment.
—
New updates to this analysis are in bold.
—
 Save as PDF