June 21, 2023: USDJPY Elliott Wave and Technical Analysis – Charts and Video
Summary: The bigger picture for the USDJPY expects overall downwards movement to around 83.245. Another alternate is presented that also expects downwards movement to a target at 9.0019.
For the short term, the recent bull trend is expected to continue for one more wave upwards, to a target of 146.934. Thereafter, bearish price movement is expected for the longer term.
Technicals heavily support a top in October 2022, so further bear movement is expected.
QUARTERLY CHART
Click chart to enlarge.
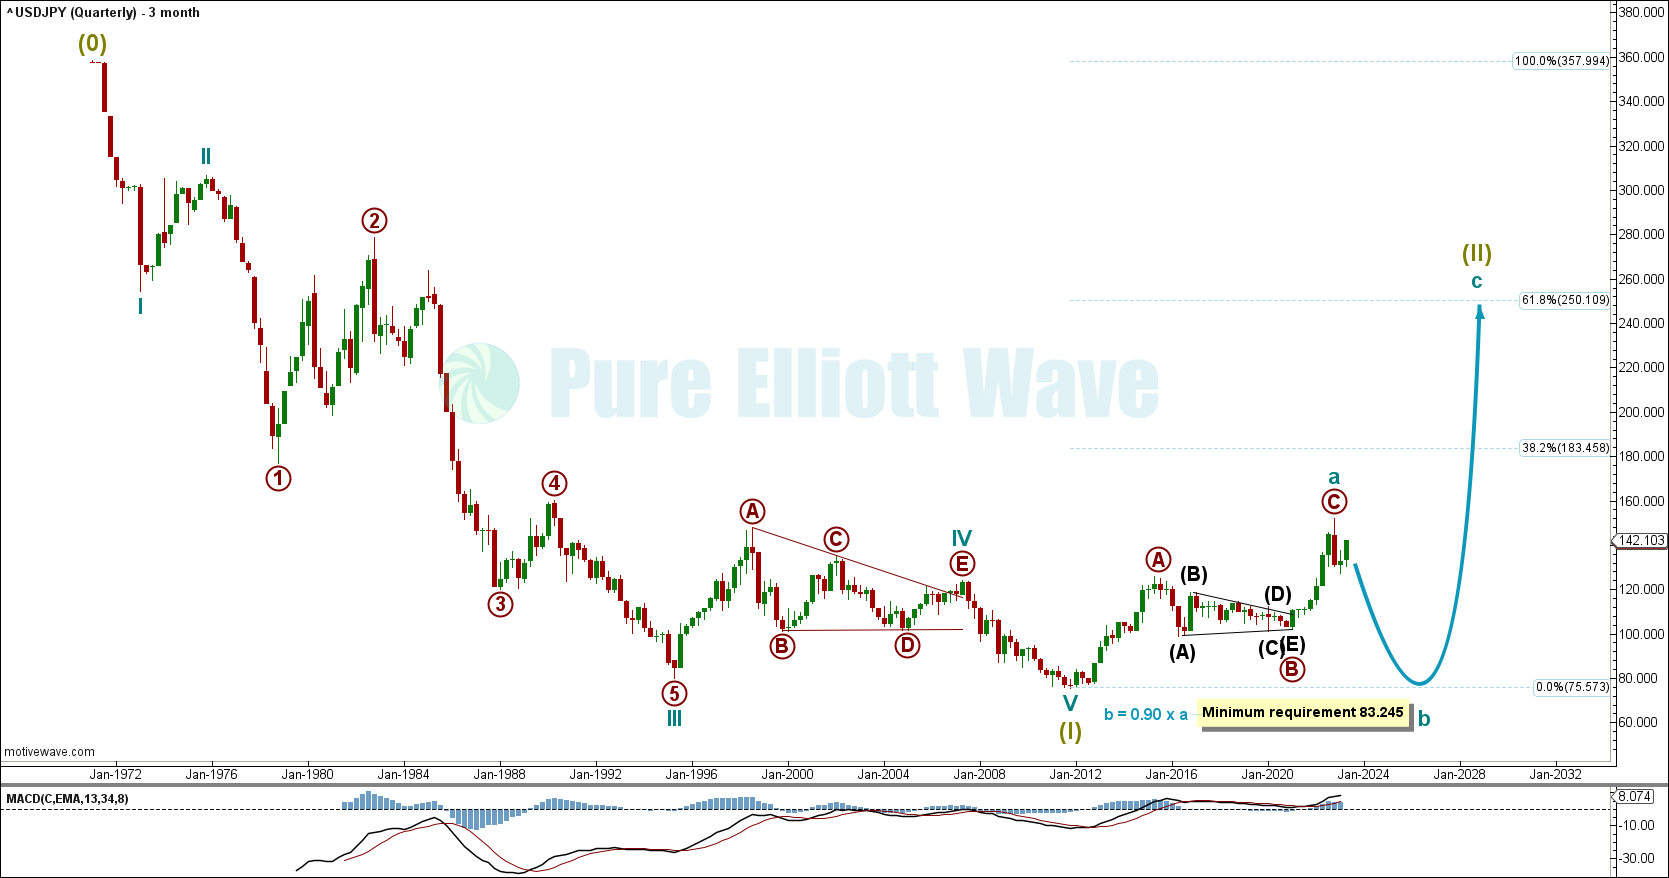
The quarterly chart shows the entire price history for the USDJPY.
A very clean 5 wave impulse can be seen starting in 1971. This impulse at Supercycle degree (I) is subdivided into cycle waves I-II-III-IV-V and may be complete in October 2011. With Supercycle wave (I) complete, we expect Supercycle wave (II) to correct upwards.
Within Supercycle wave (II), cycle wave a may be complete as an A-B-C zigzag that is very easy to count. Because cycle wave a only corrected 27% of Supercycle wave (I), we believe this correction is not yet complete. Corrections in wave 2 positions usually correct much deeper, around 50-60%. Since Supercycle wave (II) is more likely not complete, we have labelled the structure as the most common structure where cycle wave a can be a zigzag, a flat.
Within a flat, B waves must reach 90% of wave A, so our minimum requirement for cycle wave b in this correction is 83.245.
After cycle wave b is complete downwards, we will have targets for cycle wave c, which will possibly yield a huge bull market.
QUARTERLY ALTERNATE CHART
Click chart to enlarge.
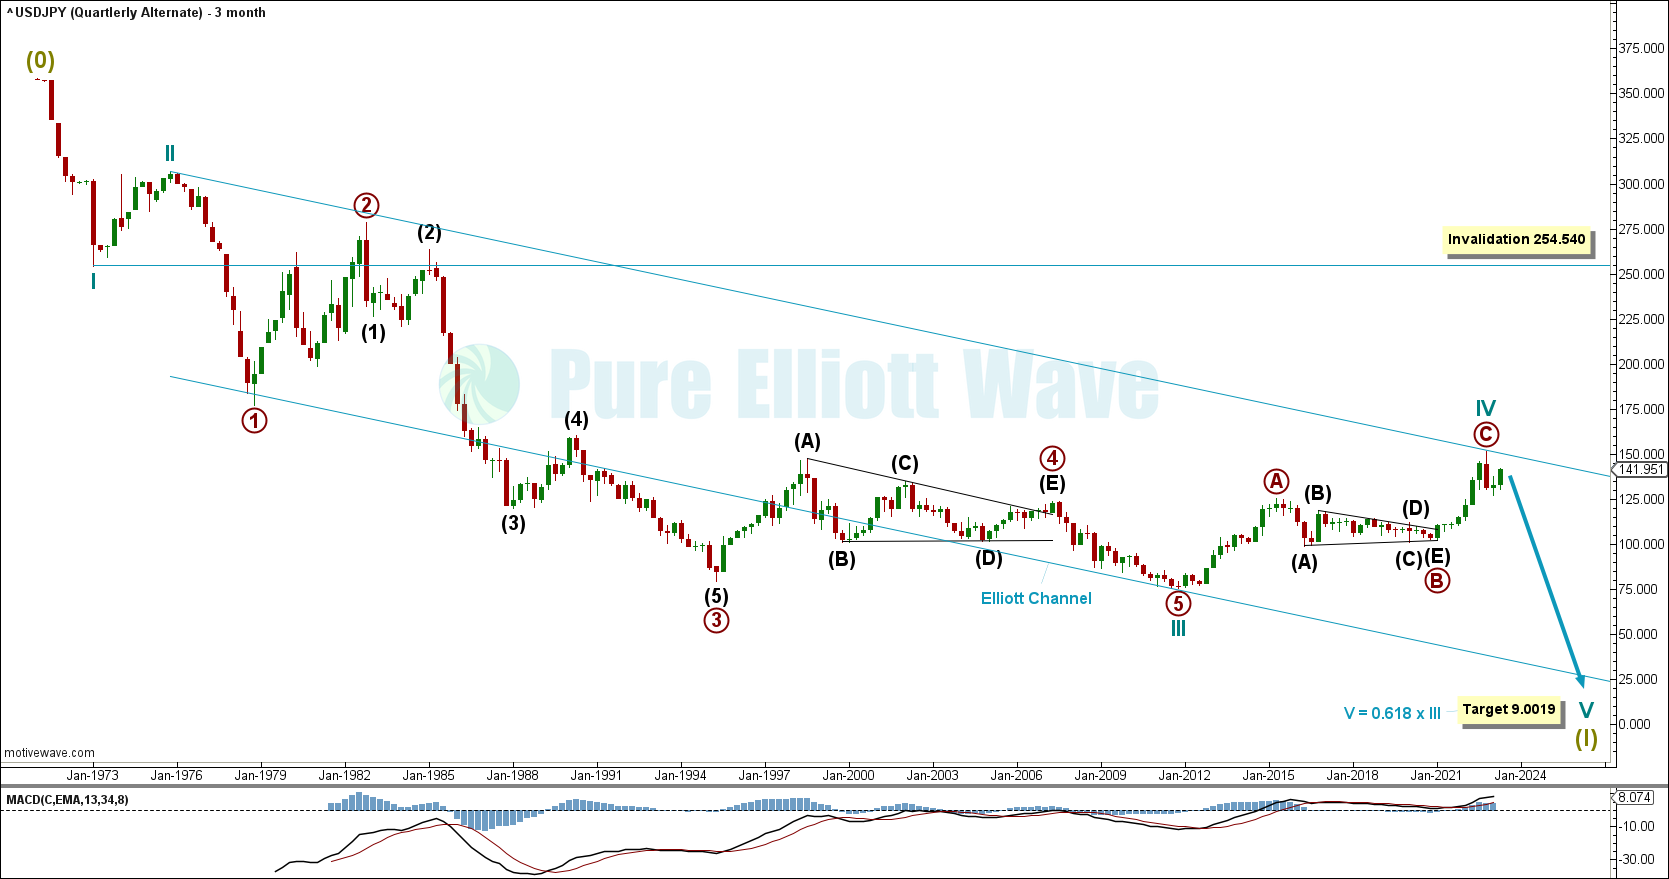
This quarterly alternate shows the possibility that supercycle wave (I) is not yet complete. This alternate also shows the same price action as likely with cycle wave IV nearly complete and then a large bear market to unfold thereafter for cycle wave V.
Instead of labelling cycle wave III complete in April 1995, this chart sees cycle wave III complete in October 2011 with the recent bull market as cycle wave IV. This Elliott wave count is much more bearish with targets for cycle wave V sitting very low. The most common target for wave five positions is to reach the 0.618 ratio with wave three. This gives us a target for cycle wave V of 9.0019. Other targets calculated on this chart also fit in that area for cycle wave V.
Price may also find support at the lower edge of the blue Elliott channel.
Invalidation for this idea is above at 254.540, where cycle wave IV moves into the price territory of cycle wave I.
Because both charts are bearish expecting the same price movement, we will use the shallower main count for the rest of the charts at lower time frames.
MONTHLY CHART
Click chart to enlarge.
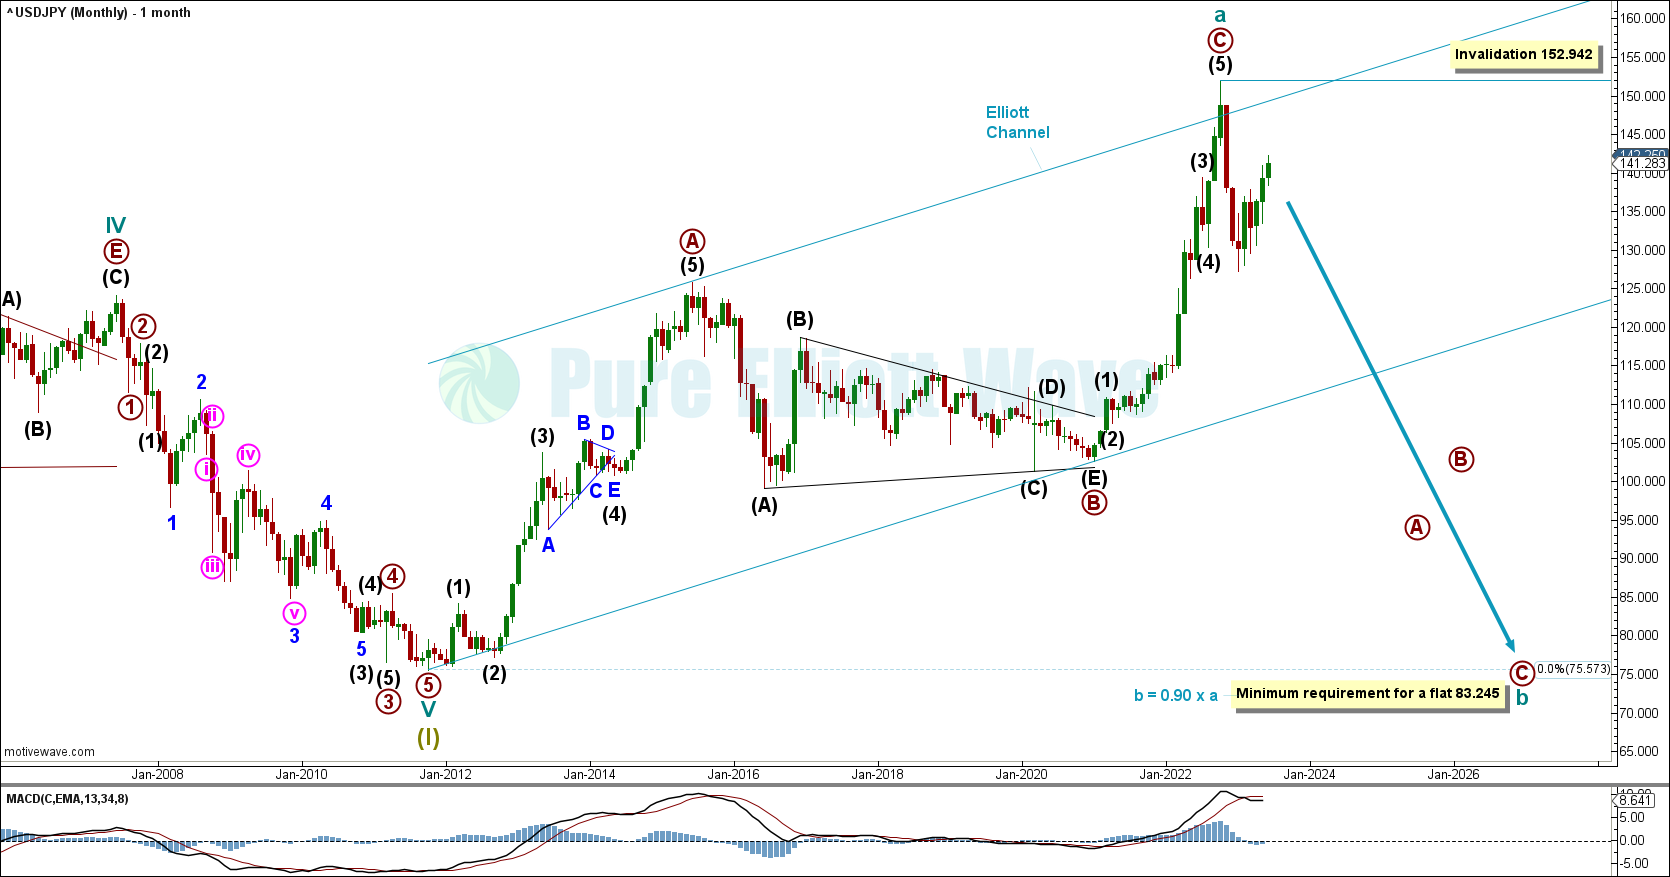
The monthly chart focuses on cycle wave V, cycle wave a, and the start of cycle wave b, which is underway downwards.
Cycle wave V completes as an impulse, with the third wave being one of the steepest portion.
Cycle wave a is complete as a very clean A-B-C zigzag, with primary wave B a contracting triangle. The impulse waves for primary wave A and C are very easy to count. Primary wave C ends with a ginormous Bearish Engulfing candlestick in November 2022. Since this Bearish Engulfing is over 2x the length of the green candlestick before it, and clearly visible on the monthly chart, this a strong indication of a trend shift at the top.
With cycle wave a likely complete, cycle wave b is expected to continue downwards as an A-B-C zigzag, the most common structure for wave B positions.
Invalidation for this count sits above at 152.942.
WEEKLY CHART
Click chart to enlarge.
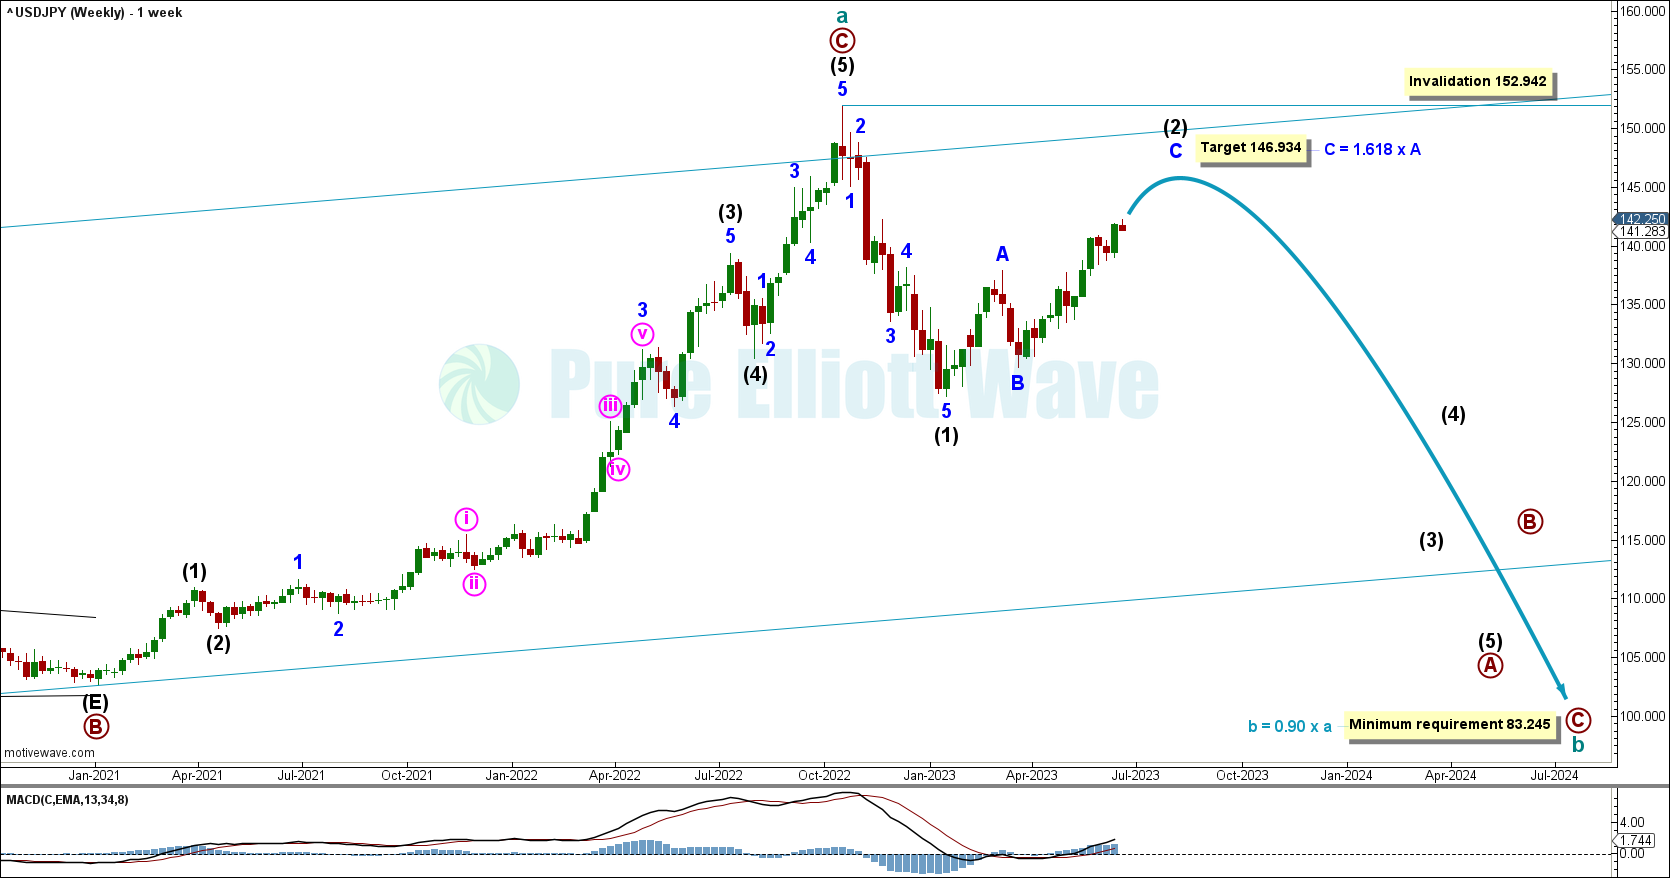
The weekly chart focuses on primary wave C within cycle wave a and the recent bearish price action for primary wave A within cycle wave b.
Within primary wave A of cycle wave b: Intermediate wave (1) is likely complete and intermediate wave (2) is nearly complete as a common A-B-C zigzag at minor degree.
A target is calculated for minor wave C to reach the 1.618 extension of minor wave A at 146.934. The structure inside of minor wave C is also not complete, leaving us to believe more bullish prices are likely.
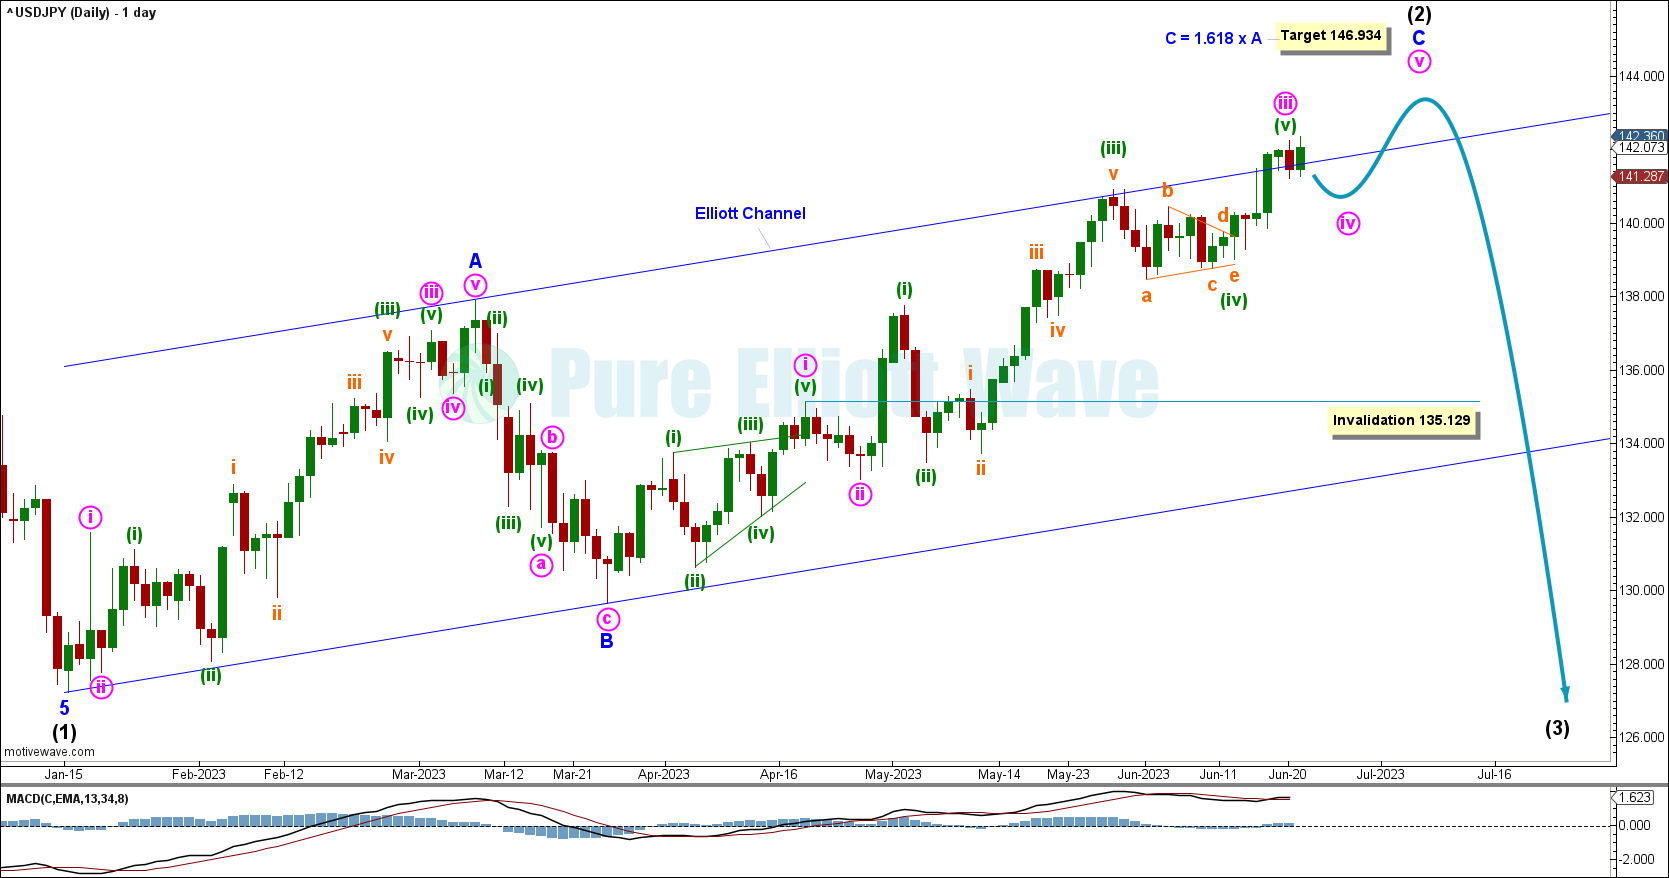
DAILY CHART
Click chart to enlarge.
The daily chart focuses on intermediate wave (2) within primary wave A.
Within intermediate (2): Minor wave A subdivides as a clean 5 wave structure, minor wave B as a zigzag, and minor wave C as an incomplete impulse.
Within minor wave C: Minute waves 1-2-3 are complete, a brief pullback may occur for minute wave iv, and then one last upwards move for minute wave v. Once minute wave iv is complete, we could also calculate targets at that degree for greater accuracy upwards.
TECHNICAL ANALYSIS
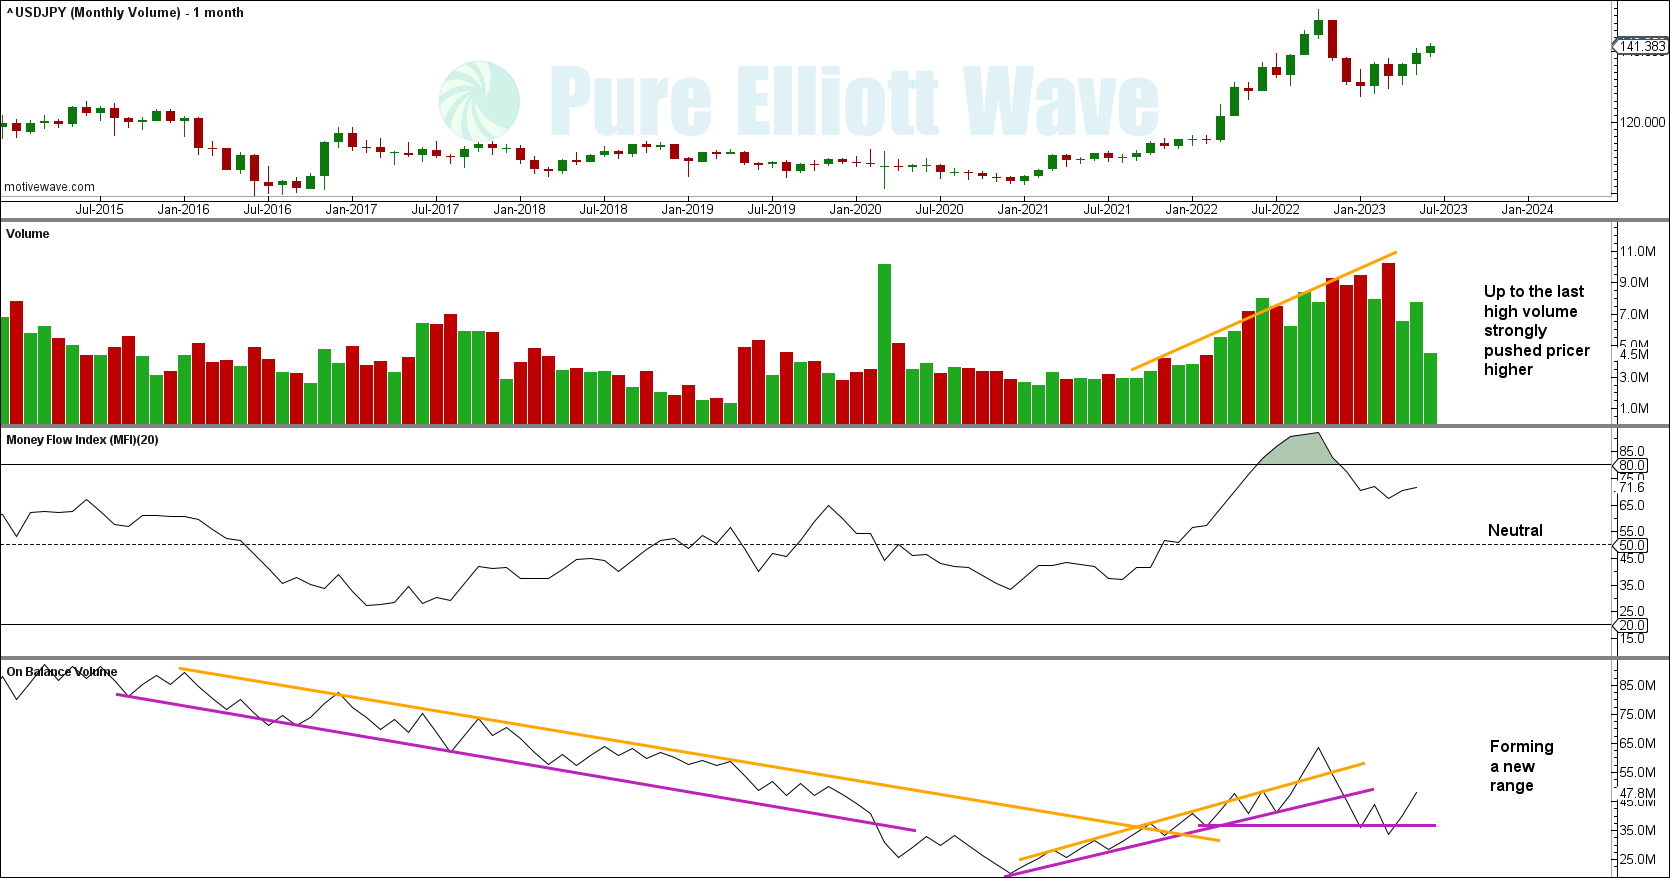
MONTHLY VOLUME
Click chart to enlarge.
On the monthly chart, volume increased with the bull trend and then increased even more with the bear movement in November-December 2022 and January 2023. Since then volume has declined with a bounce. This volume profile indicates more conviction from traders with the bear price movement.
Money Flow Index reversed from overbought conditions.
On Balance Volume has no significant range at the monthly level.
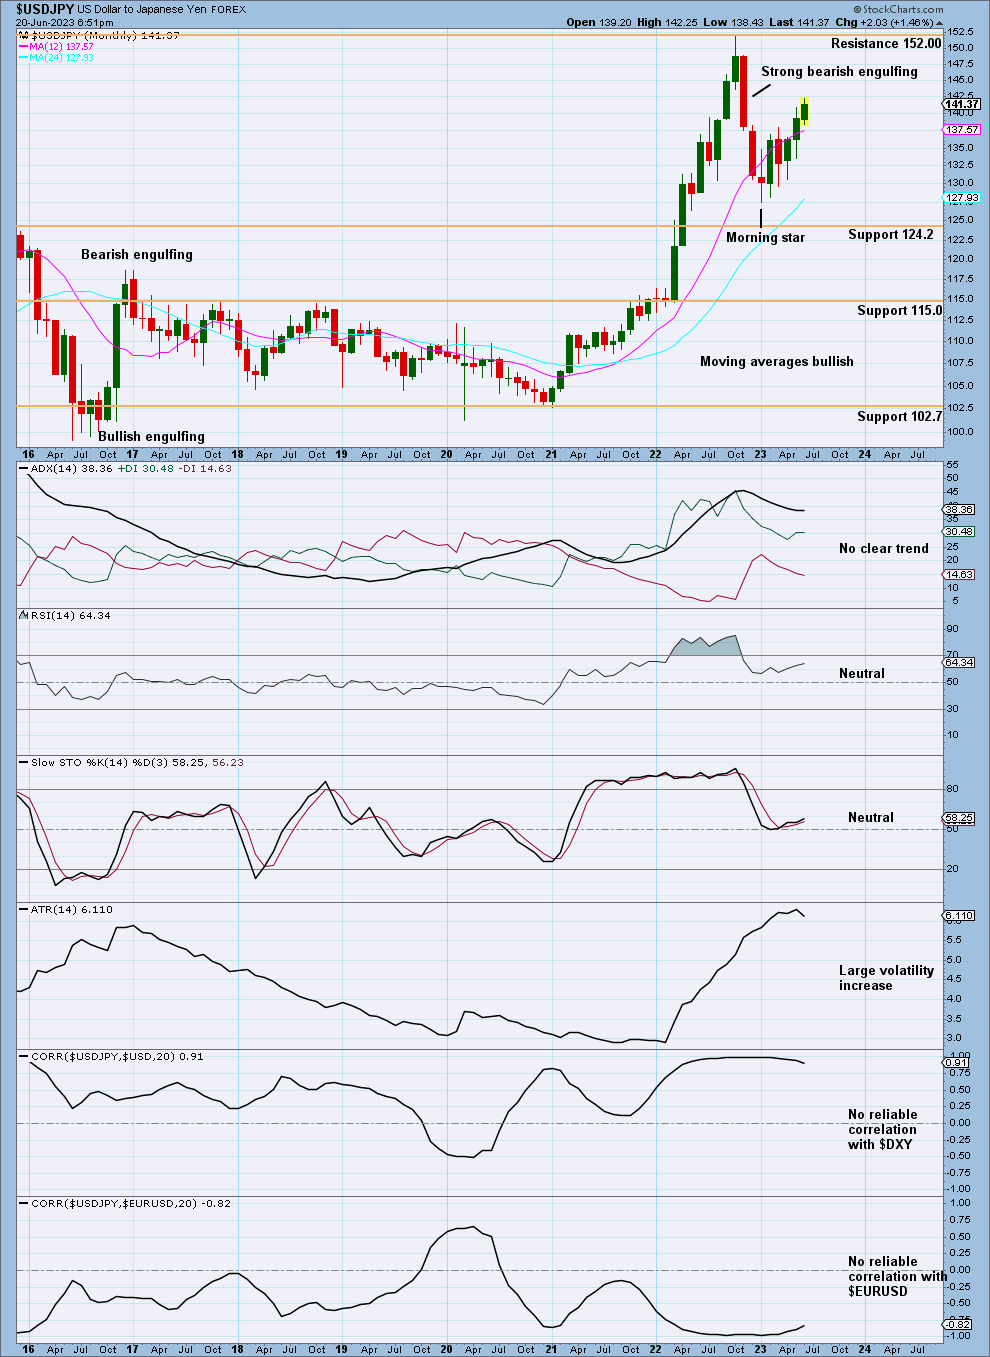
MONTHLY CHART
Click chart to enlarge.
On the monthly chart, price sits between support below at 124.2 and resistance above at 152.00.
The large Bearish Engulfing candlestick provides confidence in the Elliott wave count expecting a top there, and a morning star in January 2023 adds support for the short-term bounce.
RSI is reversing from very overbought conditions and is now neutral.
ADX is reversing from a very extreme bull trend, adding support to the wave count top in October 2022. Now ADX is indicating no clear trend.
Our model expects price to continue decreasing until RSI reaches oversold and support is reached. Price may not travel in a straight direction to get there.
With volatility increasing, and the wave count expecting a third wave, volatility could increase downwards.
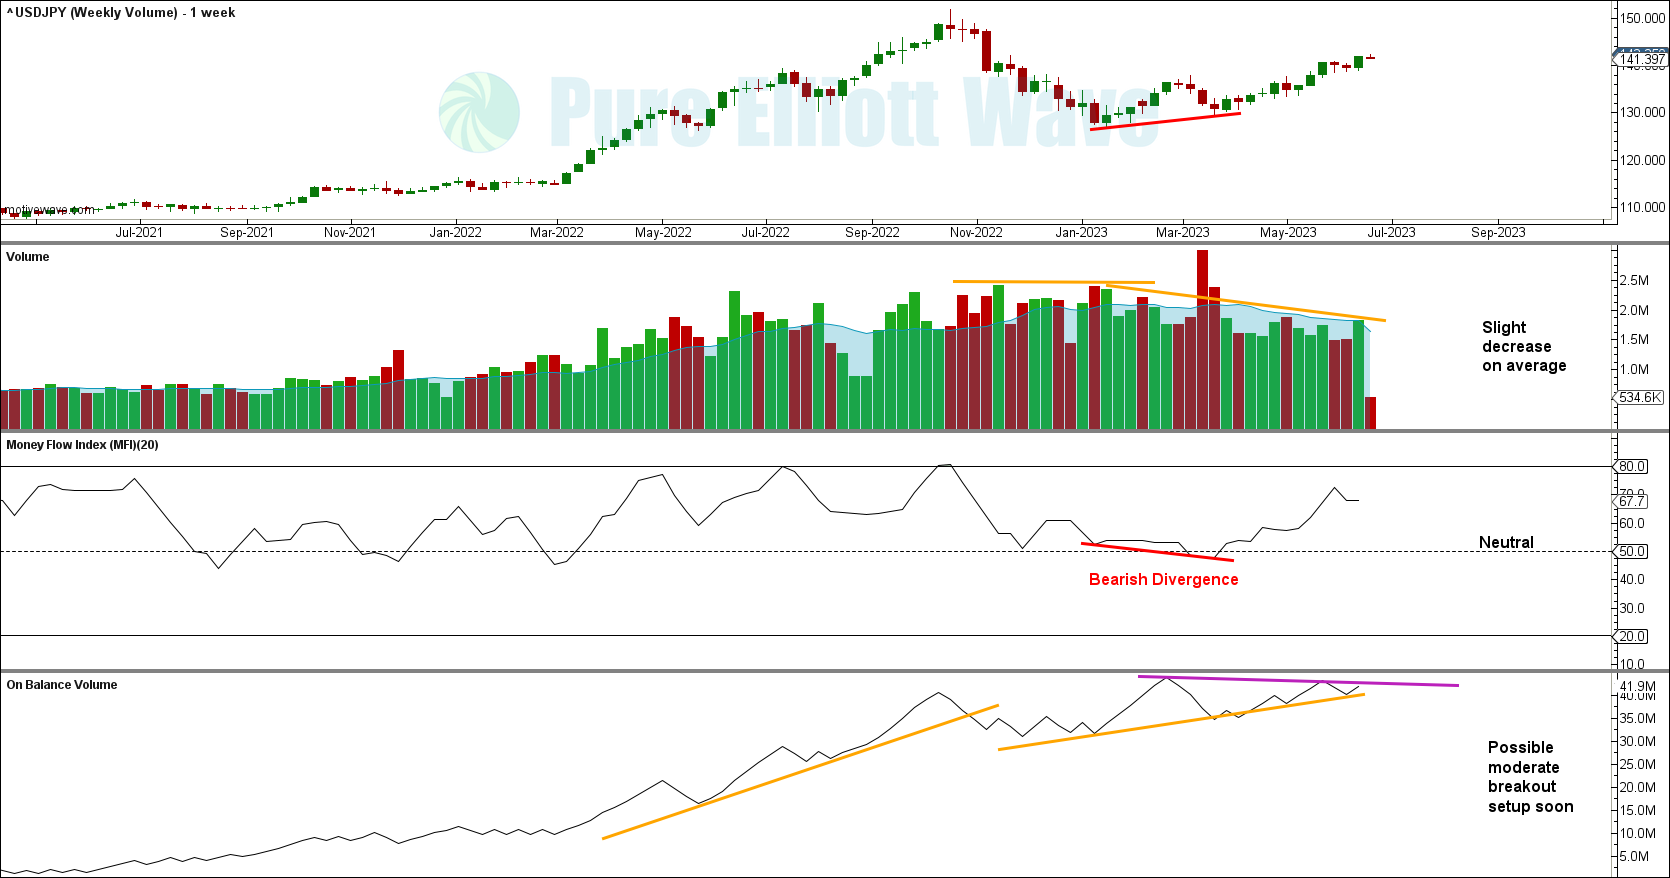
WEEKLY VOLUME
Click chart to enlarge.
The volume profile looks bearish, with volume decreasing with bullish price movement.
There was bearish divergence between Money Flow and price from January to mid-March, 2023. This is a potential sign that bullish price movement may not be sustained. Volume supports this.
WEEKLY CHART
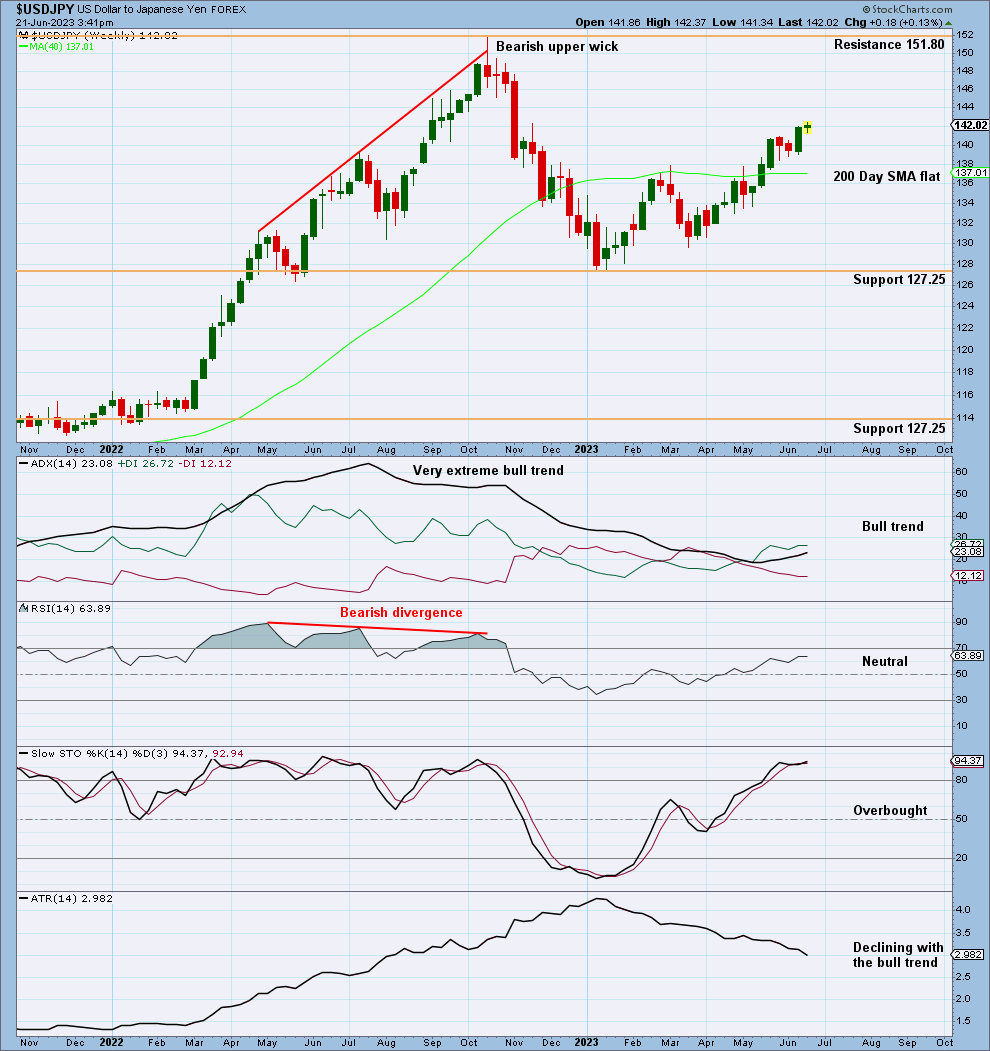
Click chart to enlarge.
Price is squarely between support and resistance. No recent reversal patterns are seen.
ADX indicates a recent bull trend, not yet extreme. ADX and RSI still have room to move upwards, with no support or resistance overhead. This supports the Elliott wave count for more short-term upwards price movement. However, range upwards could be limited with declining ATR and volume.
DAILY VOLUME
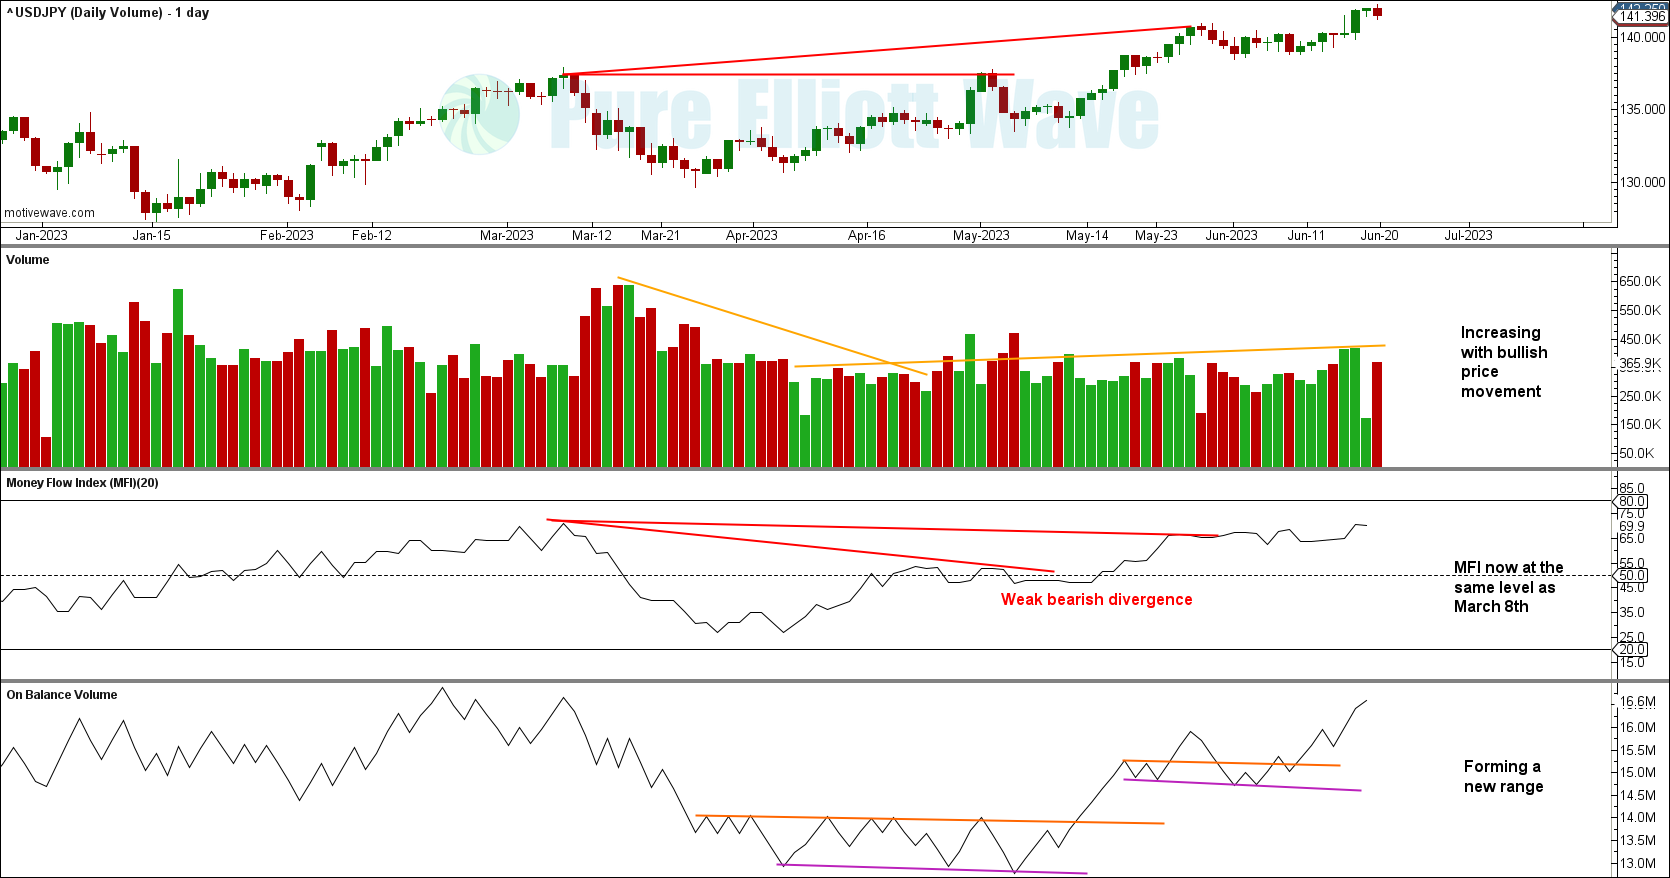
Click chart to enlarge.
A closer look at the daily volume actually shows the opposite of the weekly volume profile. Volume is slightly increasing with bullish price movement.
There is some bearish divergence between price and Money Flow index, indicating the bull price movement may not be sustained too much longer.
DAILY CHART
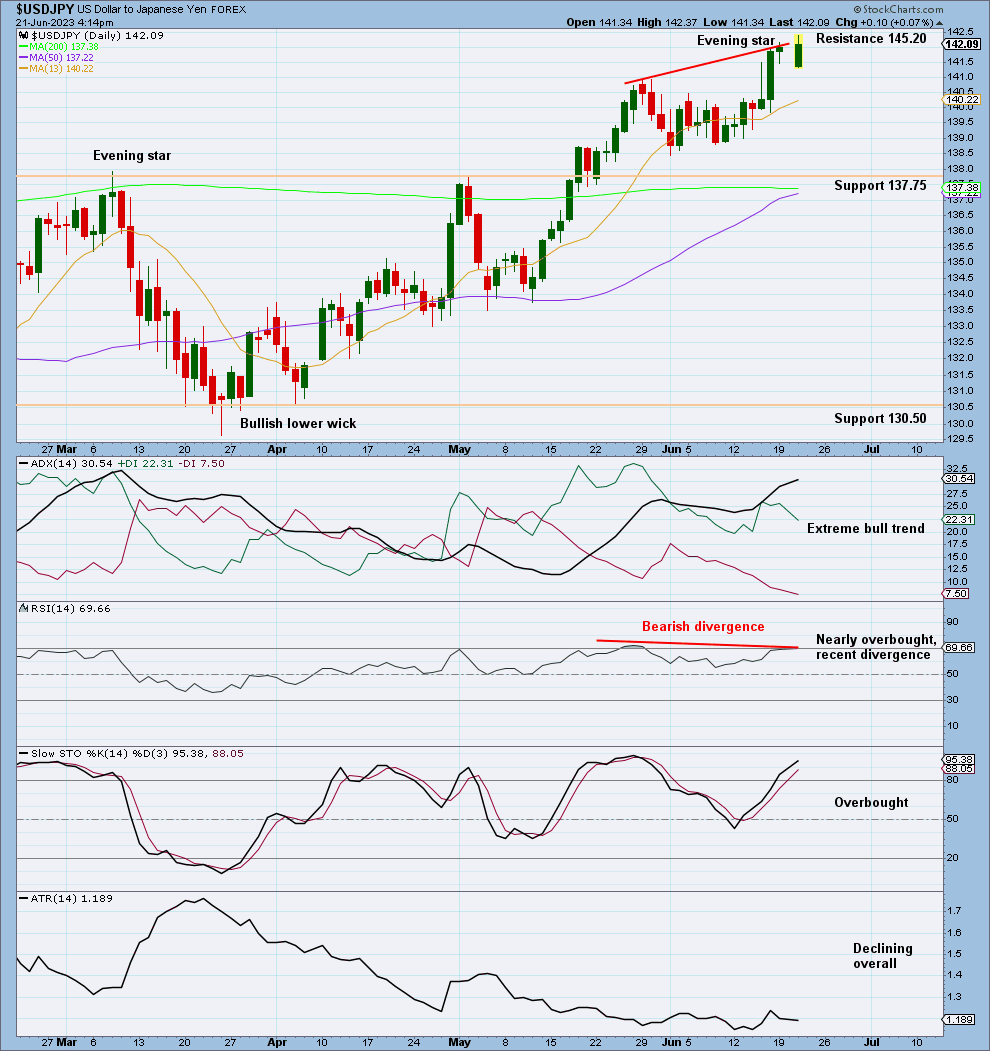
Click chart to enlarge.
An evening star at the top of the technical chart with bearish divergence between price and RSI is very bearish.
With ADX showing an extreme bull trend, RSI nearly overbought, and short-term resistance overhead at 145.20, this correlates well with the Elliott wave count that upwards price movement is likely limited.
Overall, the technicals agree with the Elliott counts for the short and long-term views.
Published @ 06:09 p.m. ET.
—
Careful risk management protects your trading account(s).
Follow our two Golden Rules:
1. Always trade with stops.
2. Risk only 1-5% of equity on any one trade.
—
New updates to this analysis are in bold.
—
 Save as PDF