June 21, 2023: SILVER Elliott Wave and Technical Analysis – Video and Charts
Summary: Price moves downwards, away from resistance. Downwards movement is expected to continue.
Monthly charts were last updated here.
BEARISH ELLIOTT WAVE COUNT
WEEKLY CHART
Click chart to enlarge.
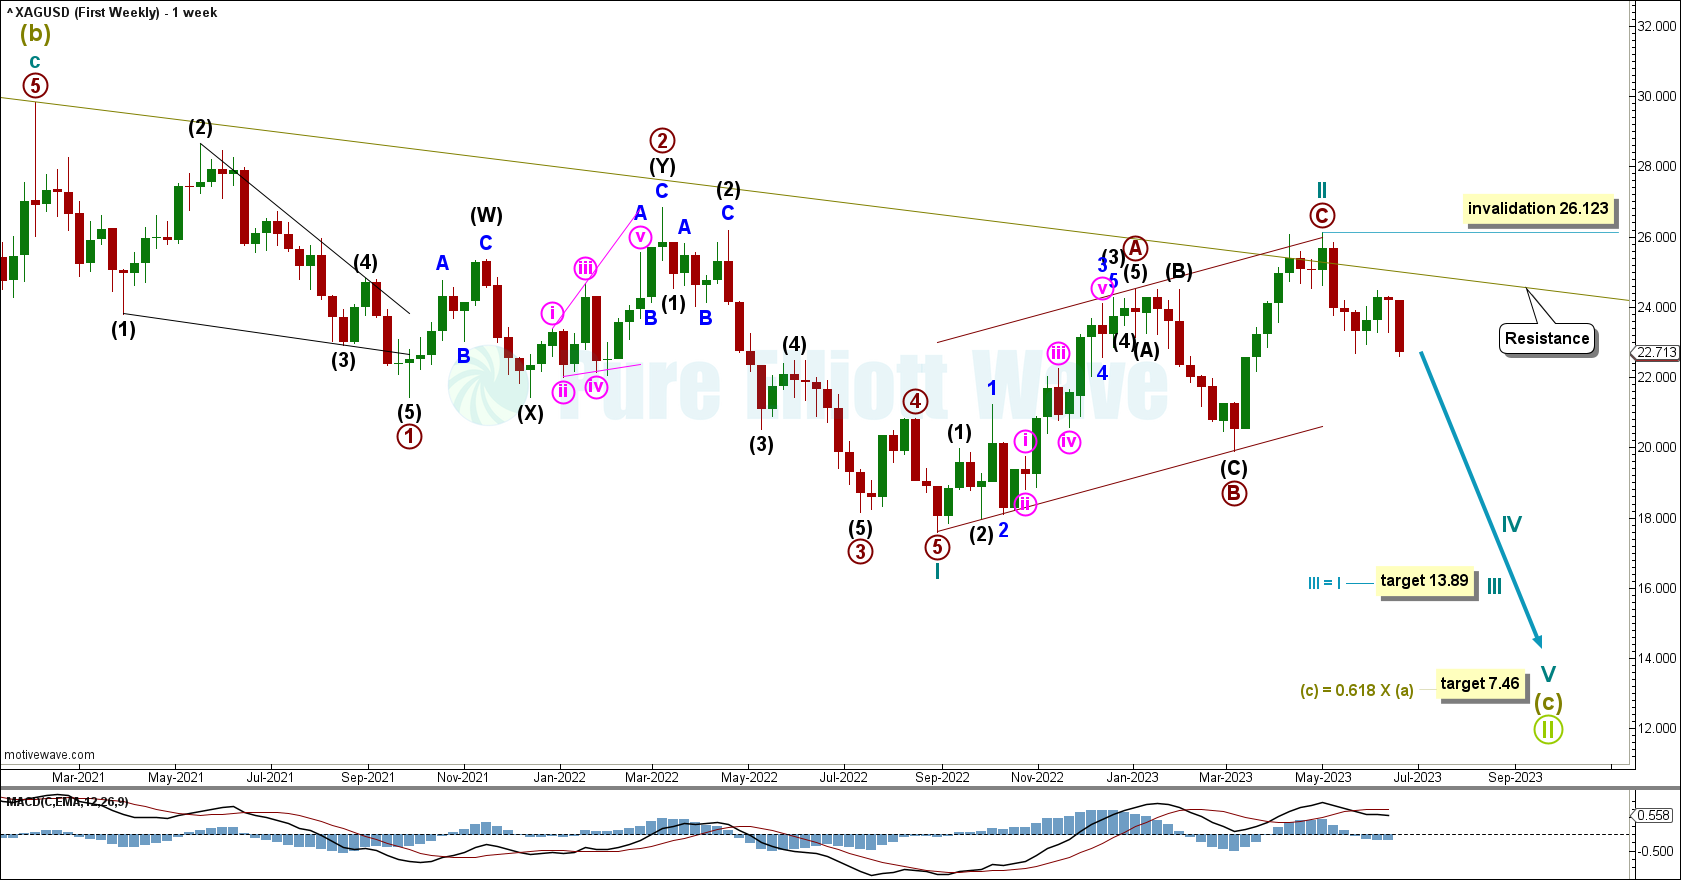
There are two possible structures that Super Cycle wave (c) may subdivide as, an impulse (more likely) or an ending diagonal (less likely). An impulse requires cycle wave I to subdivide as a five wave motive structure. Cycle wave I fits well as an impulse, which indicates Super Cycle wave (c) would most likely be subdividing as an impulse.
Within the impulse, cycle waves I and II may be complete, with price now moving down for cycle wave III.
No corrective movement within cycle wave III can move above its start at 26.123.
With recent downwards movement there is added confidence in Cycle wave II being over at the last high, corresponding with resistance at the Supercycle degree trend channel. Price is now expected to continue downwards for Cycle wave III.
Cycle wave III has a target calculated to reach equality in length with cycle wave I at 13.89.
DAILY CHART
Click chart to enlarge.
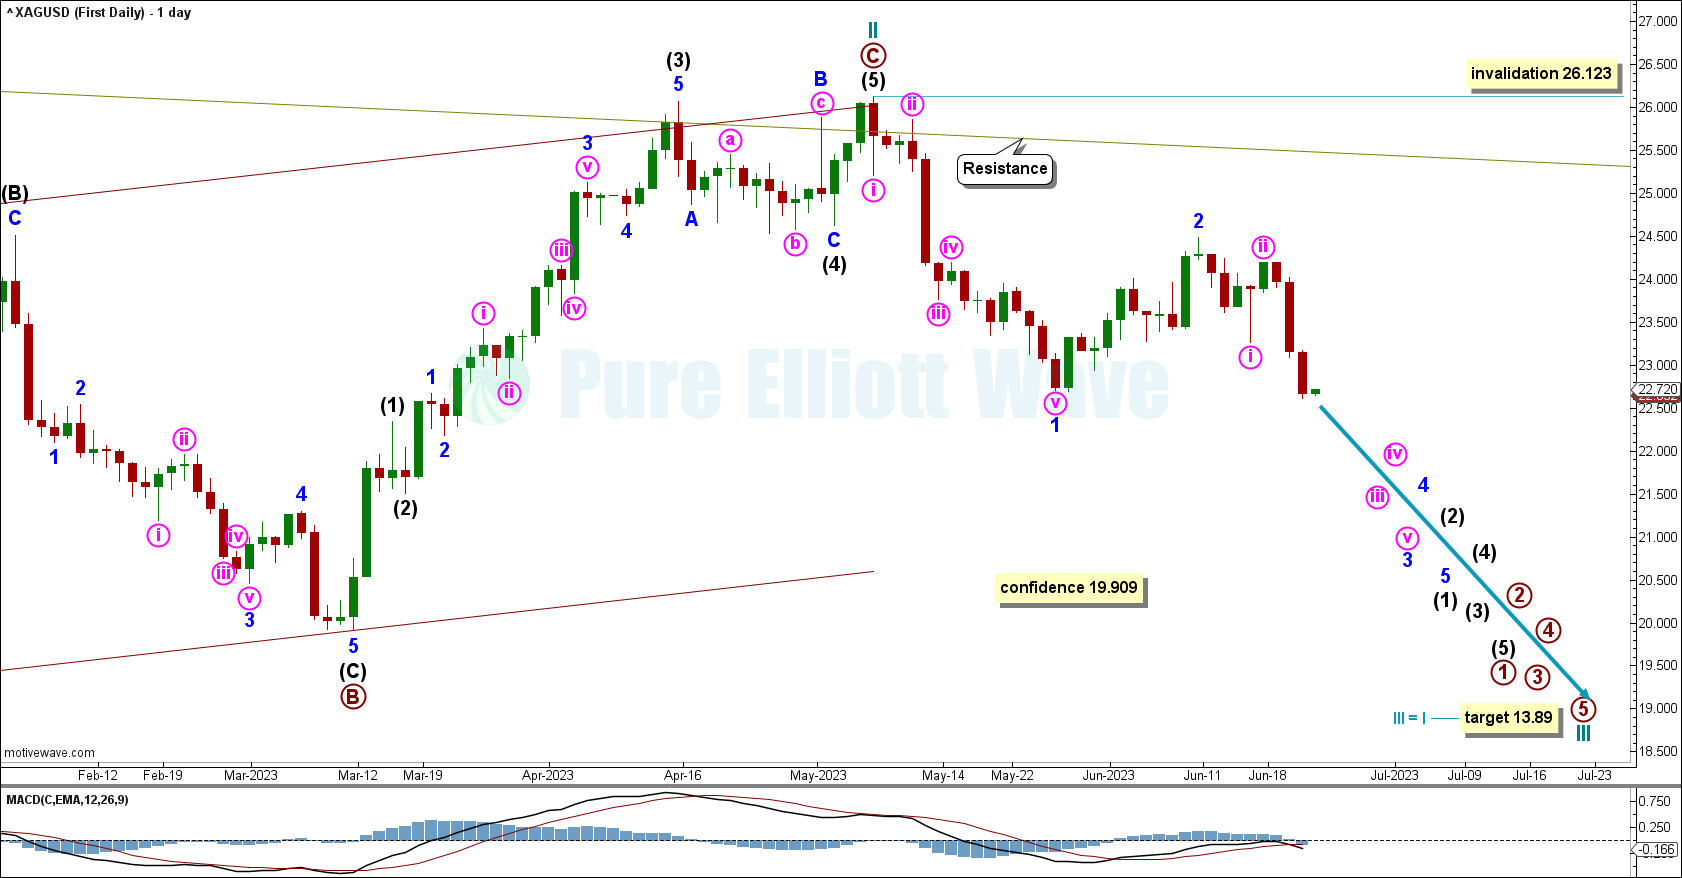
Cycle wave III has to unfold as an impulse. Within the impulse, minor waves 1 and 2 may be complete along with minute waves i and ii within minor wave 3. Increased downwards movement is expected for minute wave iii within minor wave 3 to move price lower.
If price moves below the last low of primary wave B within cycle wave II at 19.909, then there will be added confidence to this wave count as at that point the alternate wave count below would be invalidated.
BULLISH ELLIOTT WAVE COUNT.
WEEKLY CHART
Click chart to enlarge.
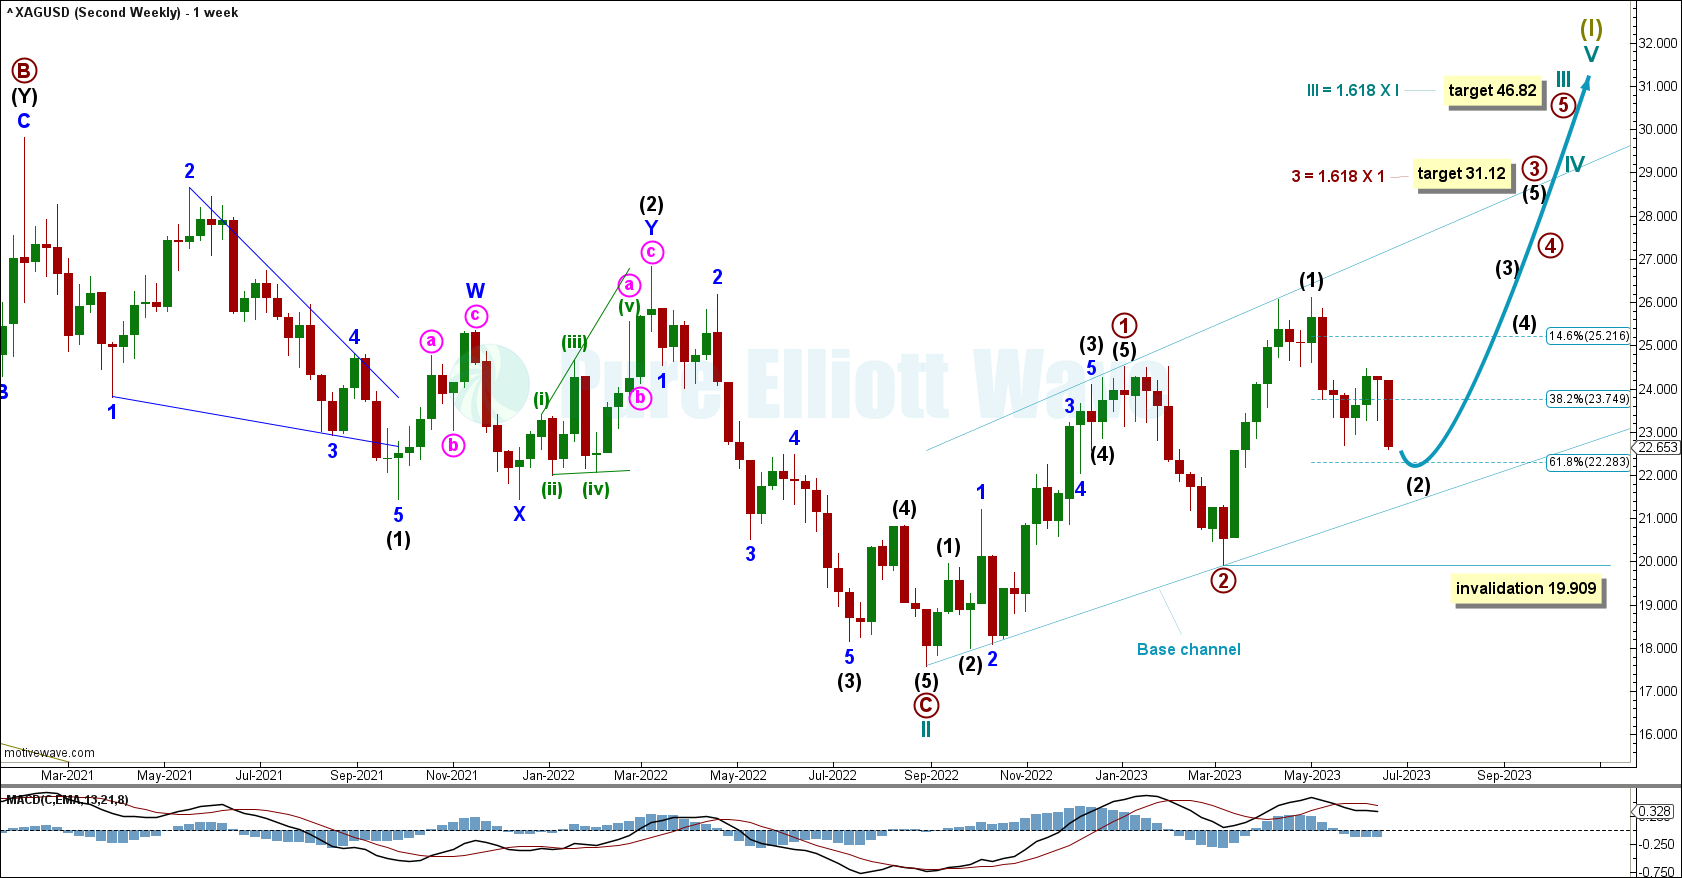
Within the new trend of Super Cycle wave (I), cycle waves I and II may be complete. Cycle wave II subdivides as a regular flat with an abnormally long primary wave C.
Cycle wave III may have begun. Cycle wave III may only subdivide as an impulse. Within the impulse, primary waves 1 and 2 may be complete. At 31.12 primary wave 3 would reach 1.618 the length of primary wave 1. Within primary wave 3, a second wave correction may not move below 19.909.
Draw a base channel about primary waves 1 and 2. Draw the first trend line from the start of primary wave 1 to the end of primary wave 2, then place a parallel copy on the end of primary wave 1. The lower edge of the base channel may show where deep corrections may find support. Primary wave 3 should have the power to break through resistance at the upper edge of the channel.
At 46.82 cycle wave III would reach 1.618 the length of cycle wave I. This target may be met in some years.
Within primary wave 3, intermediate wave (2) may move slightly lower, reaching the 0.618 Fibonacci ratio of intermediate wave (1) at 22.283.
DAILY CHART
Click chart to enlarge.
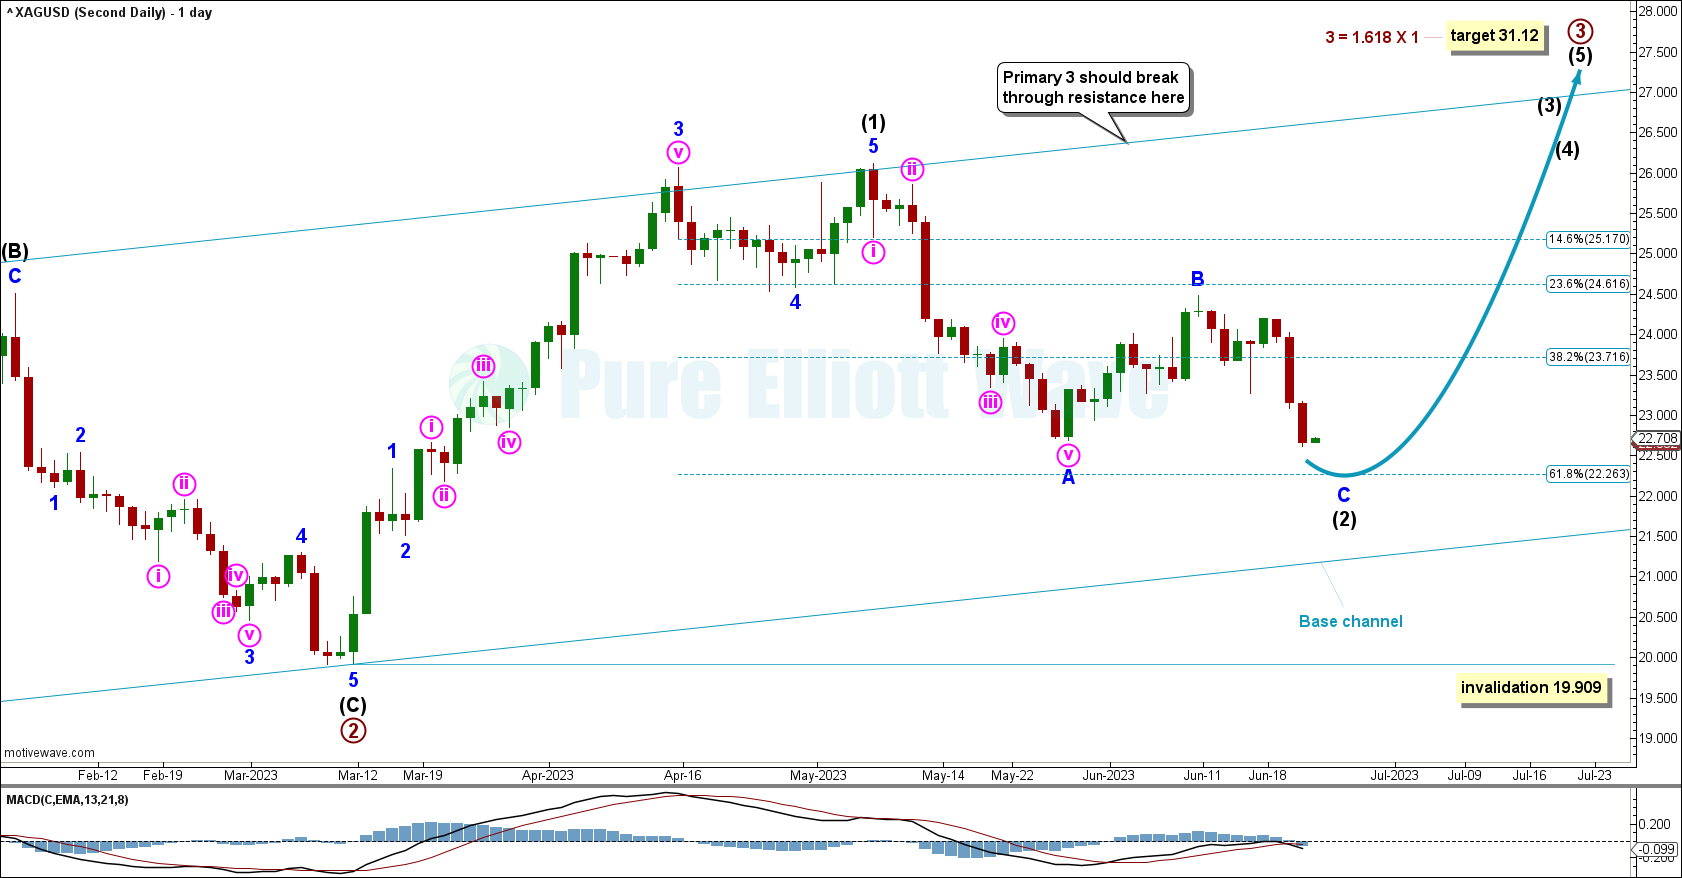
Within primary wave 3: Intermediate wave (1) may be complete and intermediate wave (2) may be unfolding as a zigzag.
Within intermediate wave (2), minor wave C may move lower to complete a five wave impulse that may end about the 0.618 Fibonacci ratio of intermediate wave (1), or it may find support on the given base channel.
TECHNICAL ANALYSIS
WEEKLY CHART
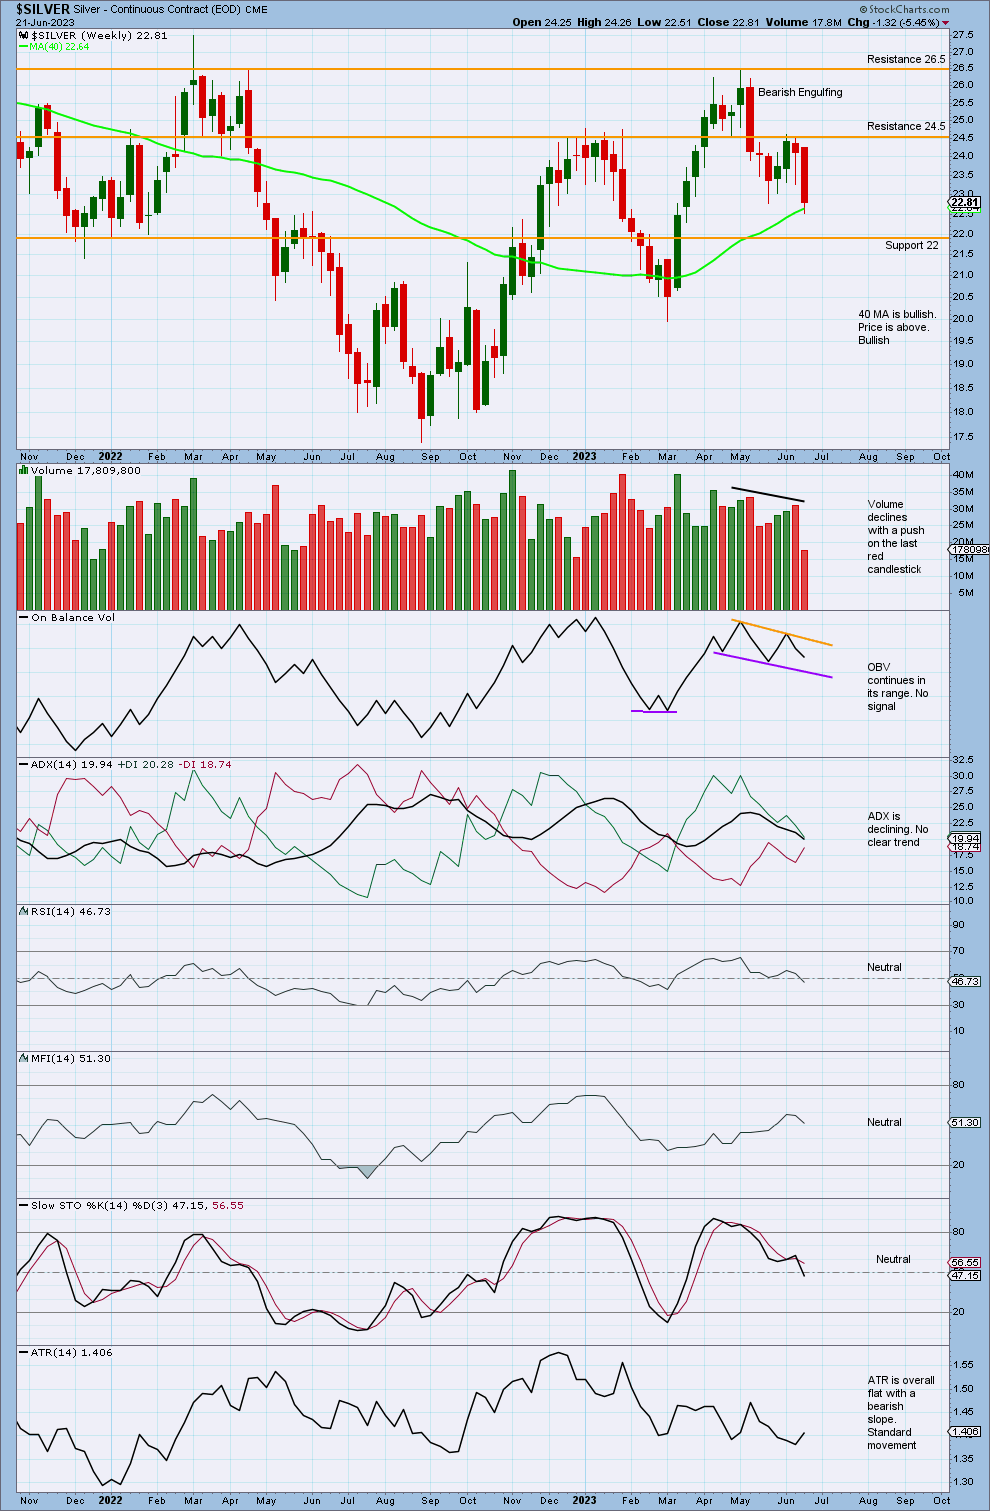
Click chart to enlarge.
There is no clear trend currently, with price falling of its own weight.
Declining volume from the last high, with a slight push in recent movement as price fell below initial resistance at 24.5, supports the main Elliott wave count.
Price is expected to continue to fall.
DAILY CHART
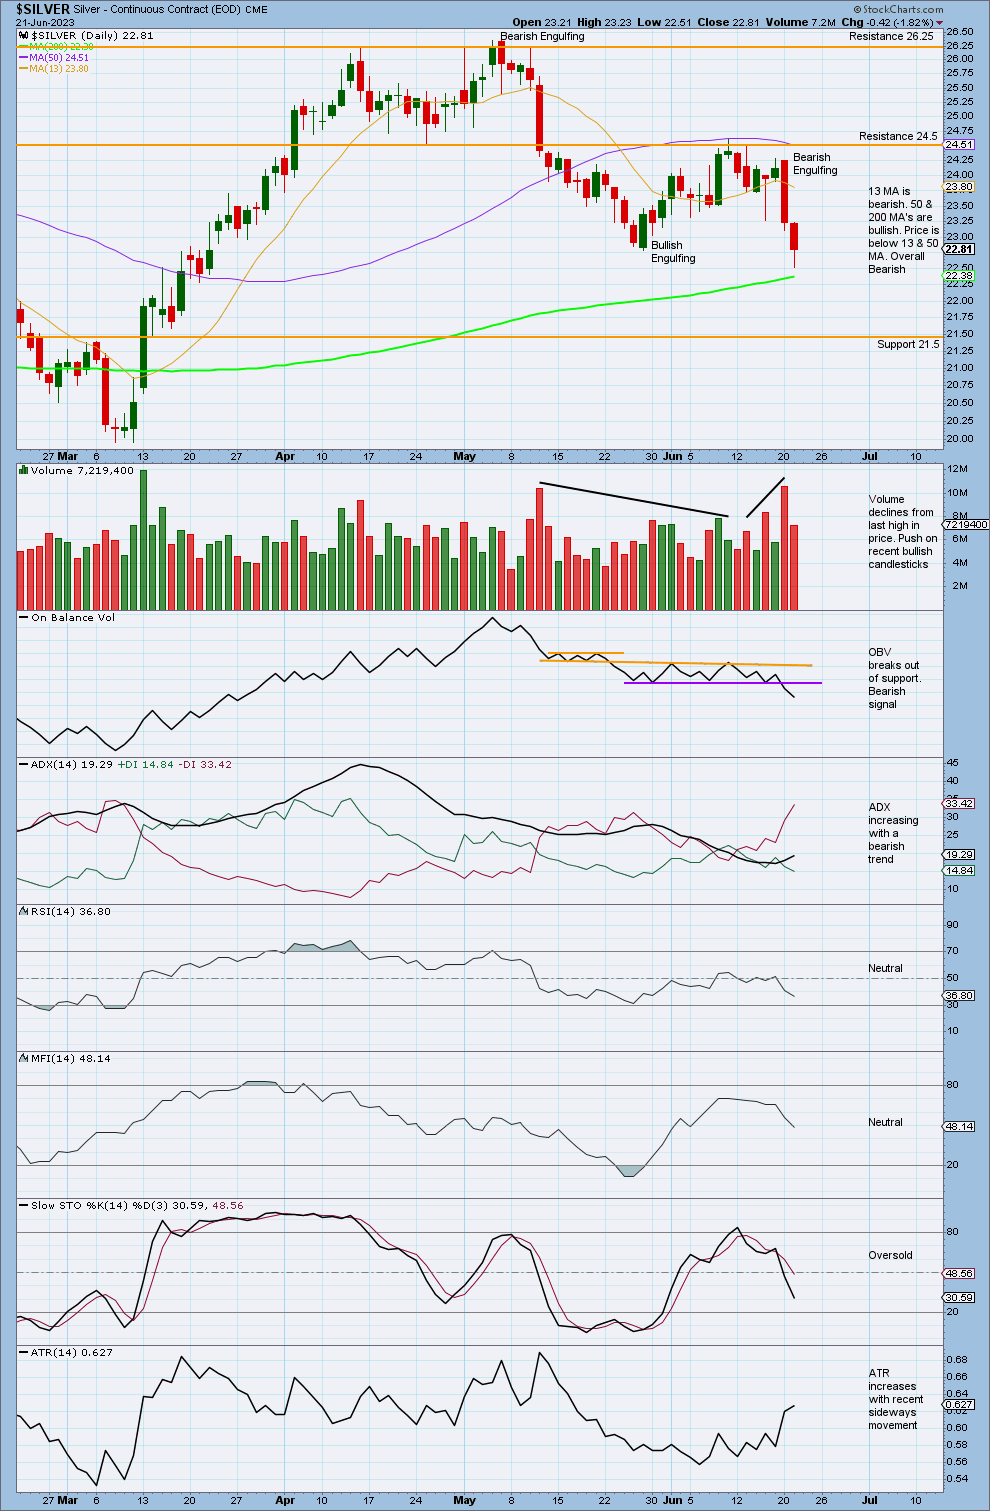
Click chart to enlarge.
There is a bearish trend that is not yet extreme.
Volume is overall flat but with a push on recent bearish candlesticks, indicating strength in bearish movements.
A bearish engulfing pattern after a short bullish movement indicates more strength in bearish movements, which also comes with On Balance Volume breaking out of support within a somewhat technically significant range.
Both volume and range declined as price moved higher to the last high in early May. This supports the first Elliott wave count and not the second. For the second Elliott wave count, a third wave up should not come with weak volume and declining range.
Published @ 02:48 p.m. ET on June 22, 2023.
—
Careful risk management protects your trading account(s).
Follow my two Golden Rules:
1. Invest only funds you can afford to lose.
2. Have an exit strategy for both directions; when to take profit and when to exit a losing investment.
—
New updates to this analysis are in bold.
—
 Save as PDF