May 31, 2023: SILVER Elliott Wave and Technical Analysis – Video and Charts
Summary: Upwards movement may continue until about 24.756.
Monthly charts were last updated here.
BEARISH ELLIOTT WAVE COUNT
WEEKLY CHART
Click chart to enlarge.
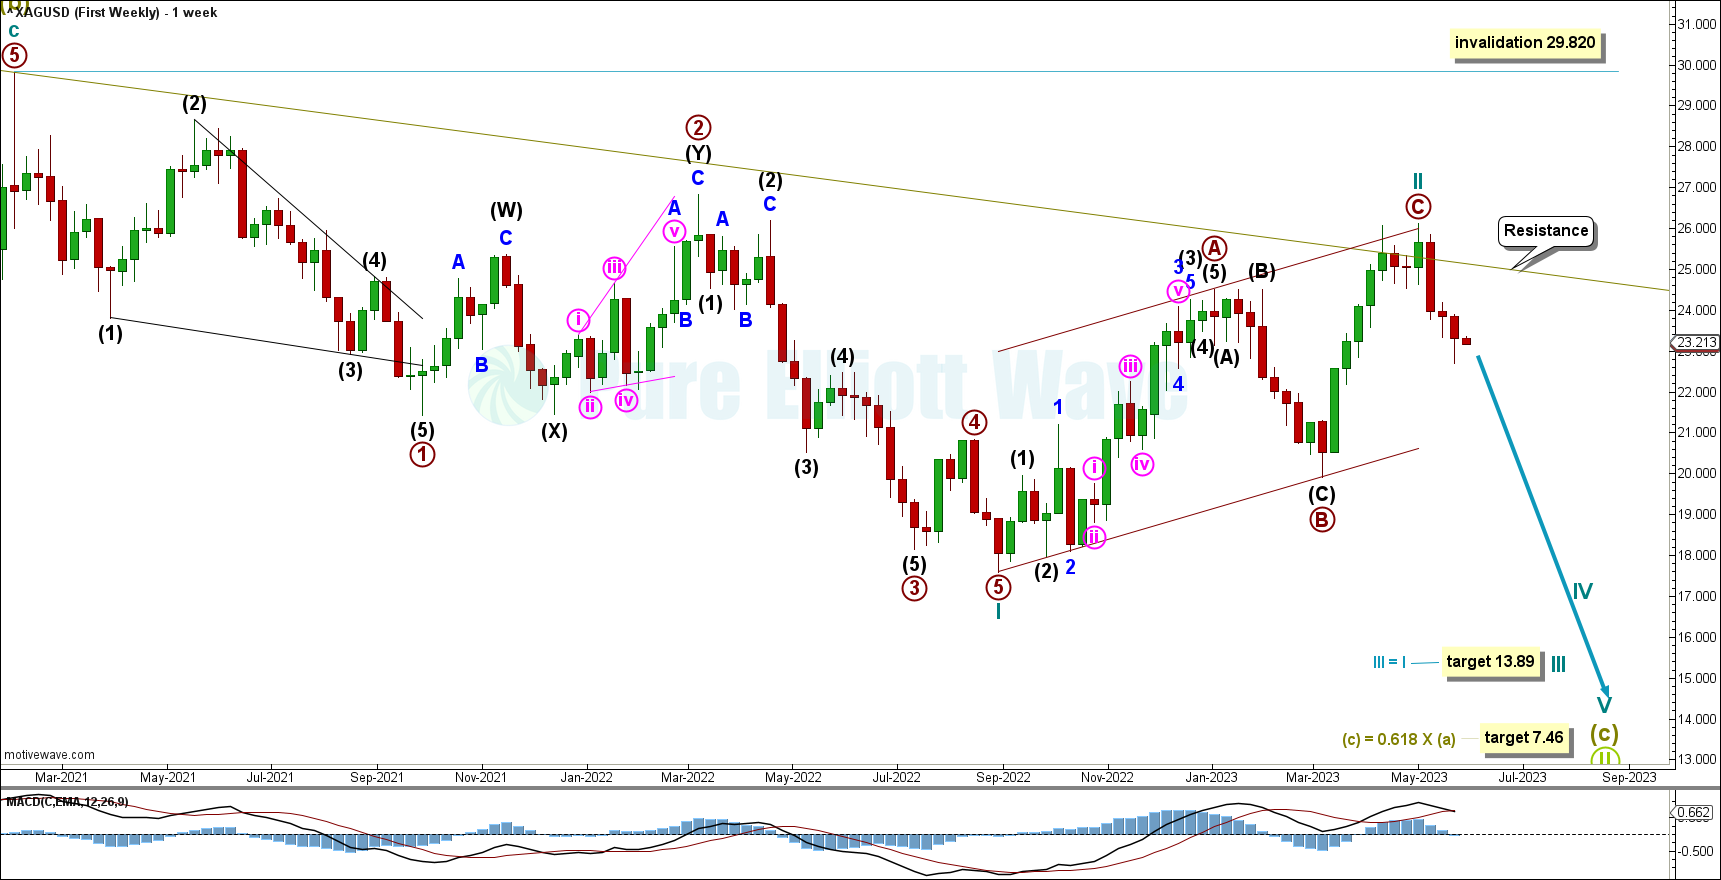
There are two possible structures that Super Cycle wave (c) may subdivide as, an impulse (more likely) or an ending diagonal (less likely). An impulse requires cycle wave I to subdivide as a five wave motive structure. Cycle wave I fits well as an impulse, which indicates Super Cycle wave (c) would most likely be subdividing as an impulse.
Within the impulse: Cycle wave I may be complete and cycle wave II may now be nearly complete. Cycle wave II may find resistance at the upper edge of the channel copied over from the monthly chart.
Cycle wave II may not move beyond the start of cycle wave I above 29.820.
With recent downwards movement there is added confidence in Cycle wave II being over at the last high, corresponding with resistance at the Supercycle degree trend channel. Price is now expected to move downwards for Cycle wave III.
DAILY CHART
Click chart to enlarge.
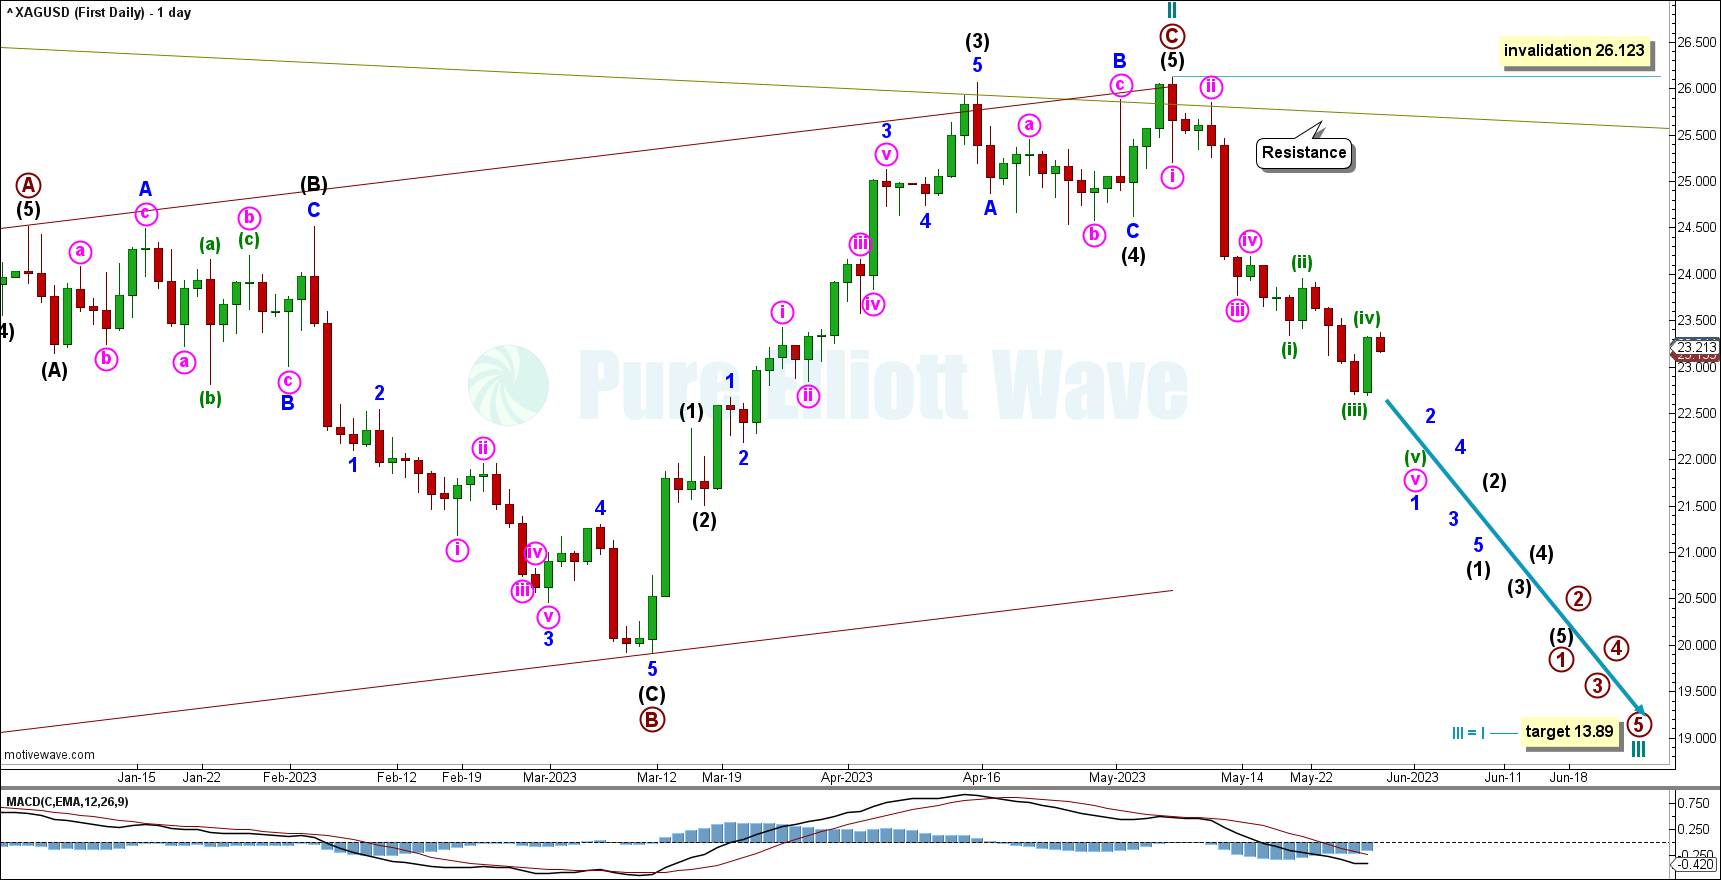
It is possible that minor wave 1 is over at the last short-term low. Coupled with MFI entering oversold and a bullish engulfing pattern, there is increased likelihood for this wave count. Minor wave 2 may correct to the 0.618 Fibonacci ratio of minor wave 1 at 24.756.
DAILY ALTERNATE CHART
Click chart to enlarge.
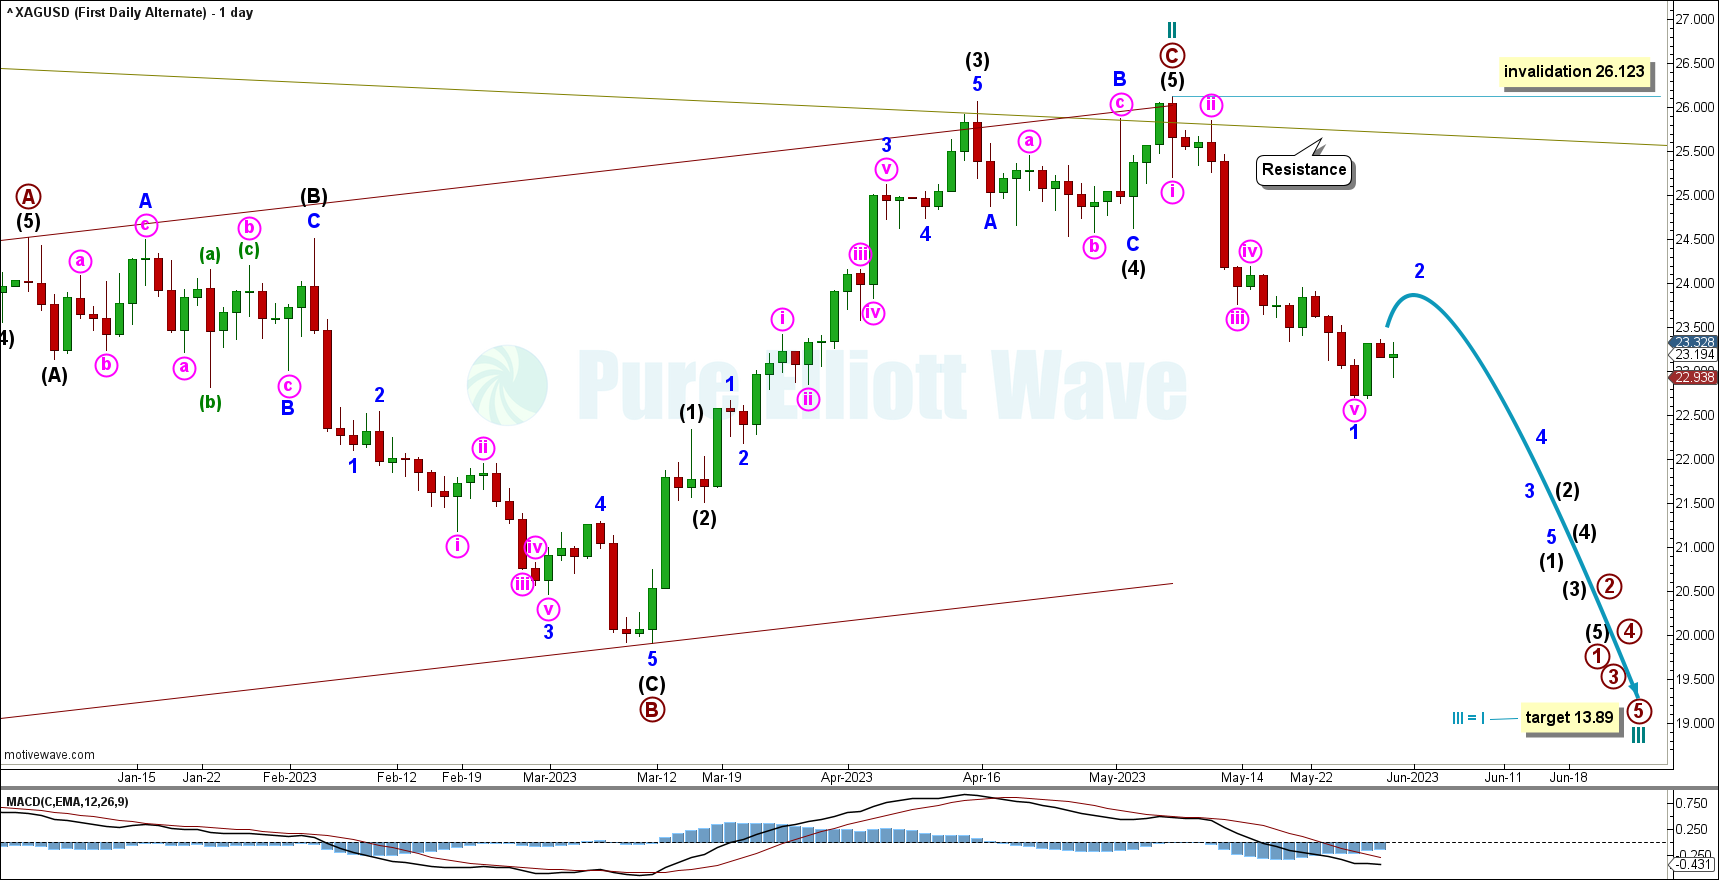
Cycle wave III has to unfold as an impulse. Within that, minor wave 1 may be nearly complete, with minute wave v expecting increased downward movement to end the structure with both minute wave v and minuette wave (v).
BULLISH ELLIOTT WAVE COUNT.
WEEKLY CHART
Click chart to enlarge.
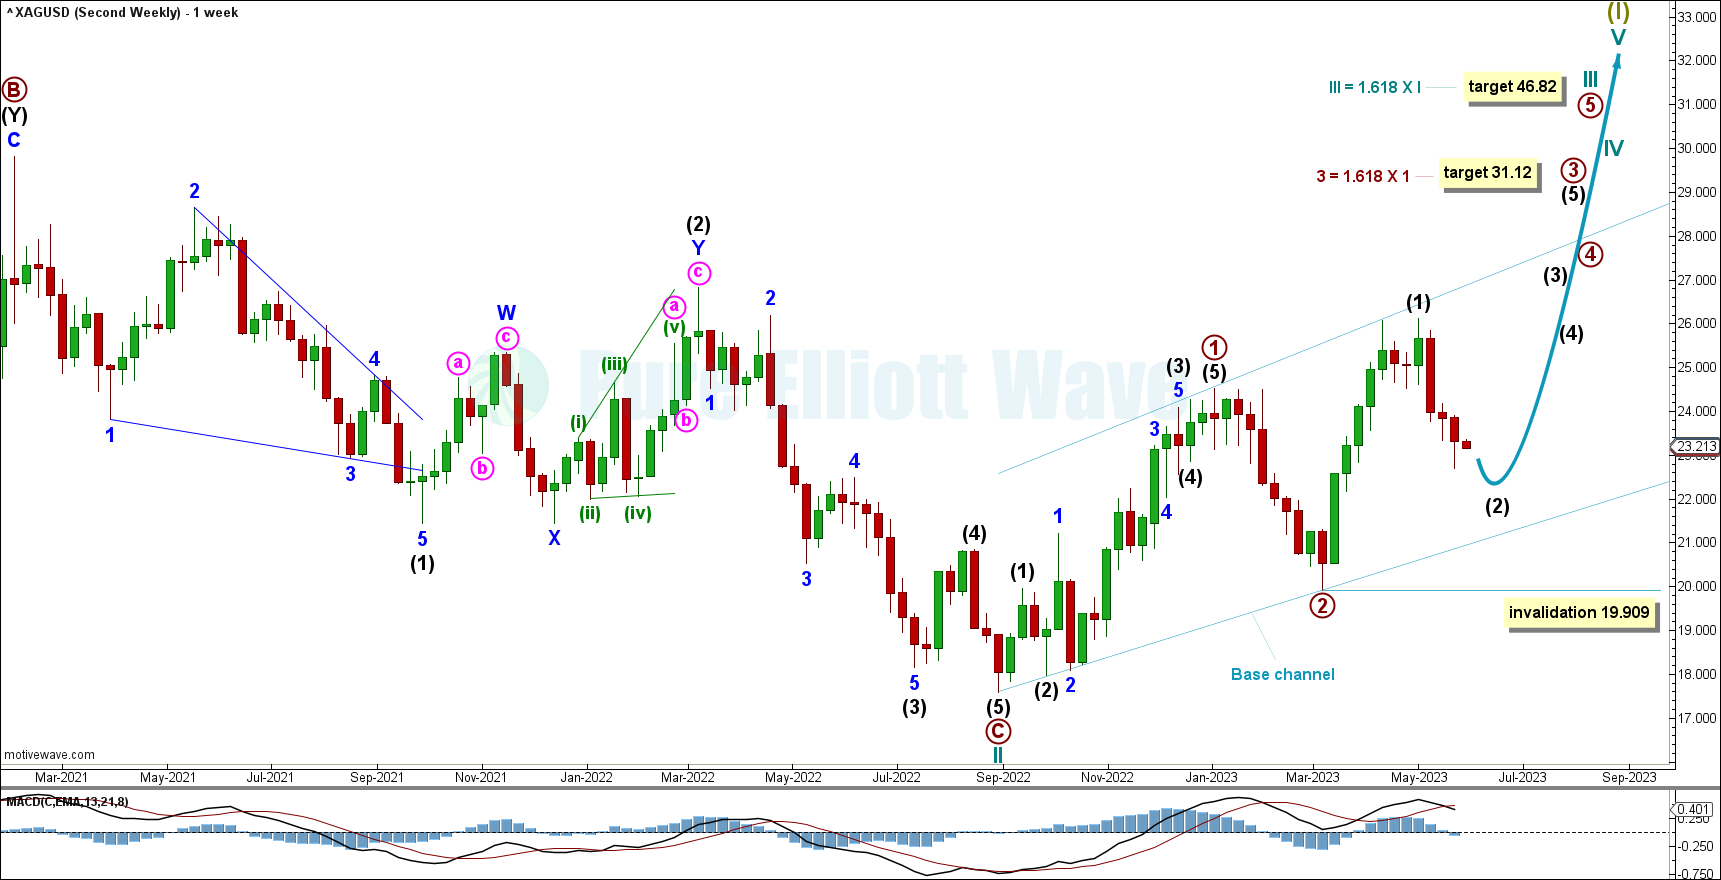
Within the new trend of Super Cycle wave (I), cycle waves I and II may be complete. Cycle wave II subdivides as a regular flat with an abnormally long primary wave C.
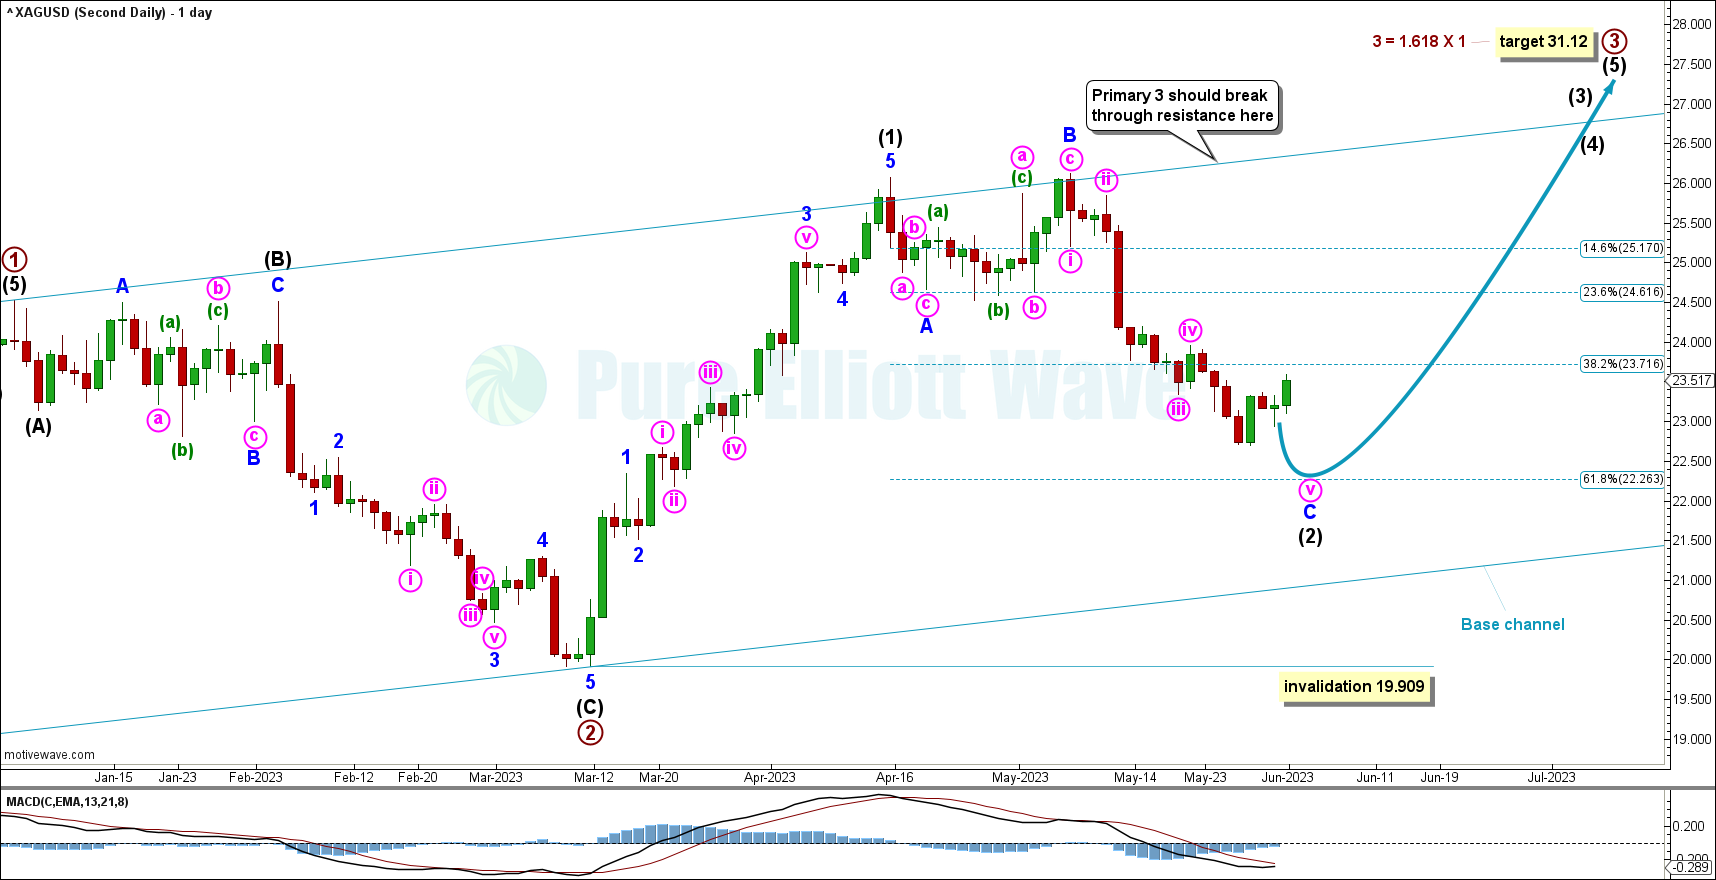
Cycle wave III may have begun. Cycle wave III may only subdivide as an impulse. Within the impulse, primary waves 1 and 2 may be complete. At 31.12 primary wave 3 would reach 1.618 the length of primary wave 1. Within primary wave 3, a second wave correction may not move below 19.909.
Draw a base channel about primary waves 1 and 2. Draw the first trend line from the start of primary wave 1 to the end of primary wave 2, then place a parallel copy on the end of primary wave 1. The lower edge of the base channel may show where deep corrections may find support. Primary wave 3 should have the power to break through resistance at the upper edge of the channel.
At 46.82 cycle wave III would reach 1.618 the length of cycle wave I. This target may be met in some years.
Within primary wave 3, intermediate wave (2) may move lower, potentially finding support at the bottom of the base channel.
DAILY CHART
Click chart to enlarge.
Within primary wave 3, intermediate wave (1) may be complete, with intermediate wave (2) unfolding as an expanded flat. Within that flat, minor wave C may move lower to complete a five wave impulse, which may be in its fifth minute wave.
TECHNICAL ANALYSIS
WEEKLY CHART
Click chart to enlarge.
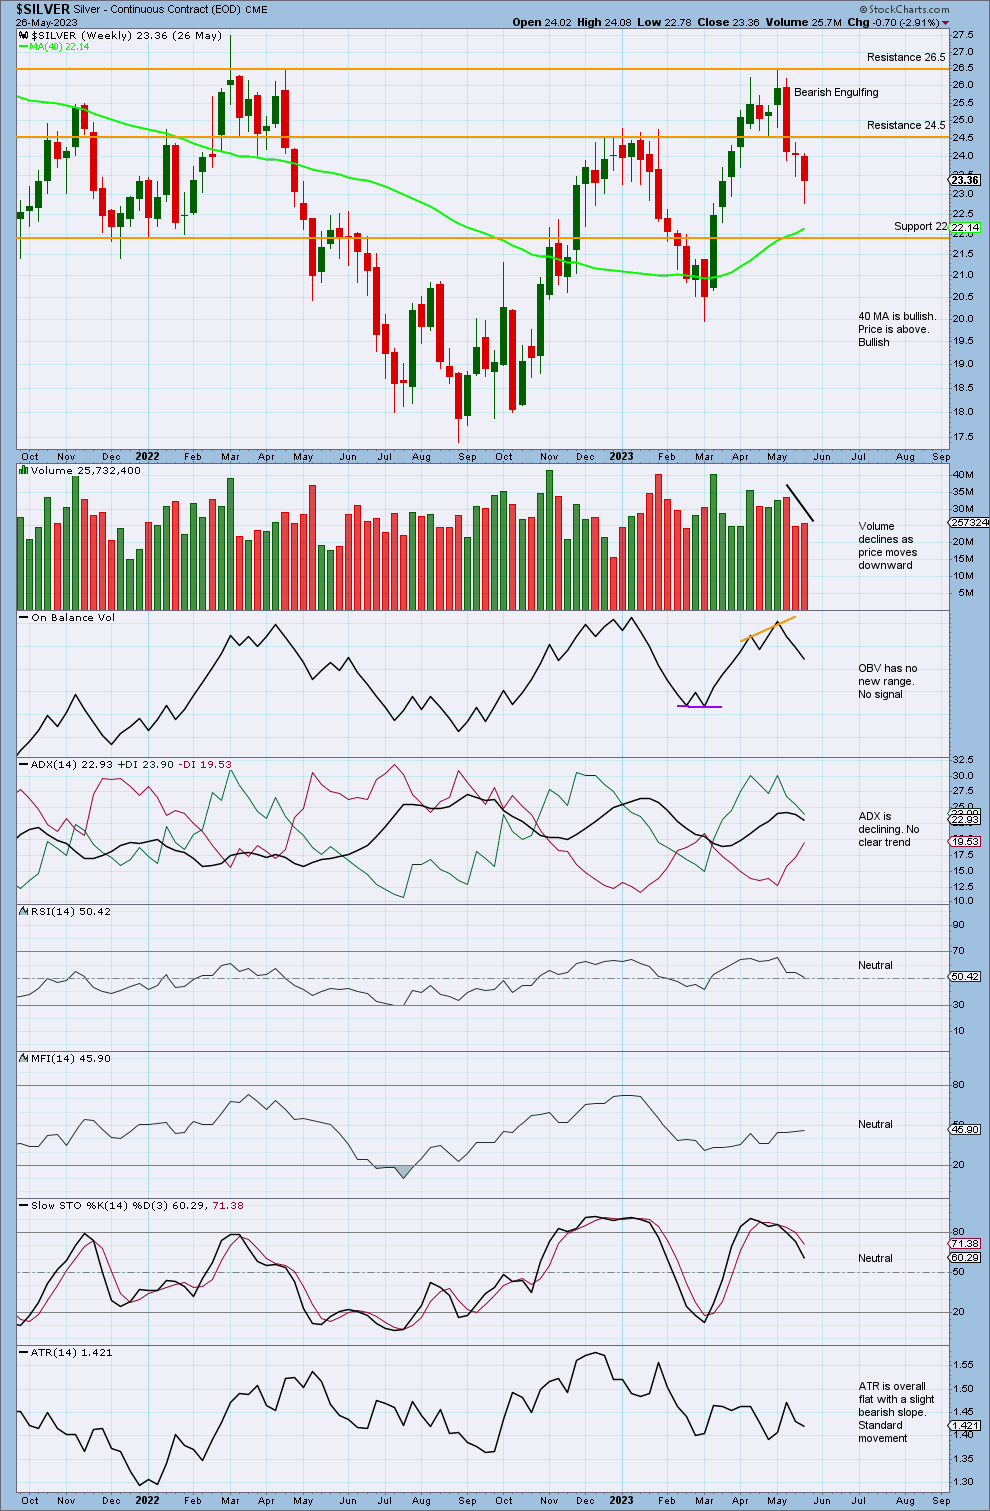
There is no clear trend currently, with price falling of its own weight.
Declining volume up to the last high is a concern for a bullish case and supports the first Elliott wave count. A strong Bearish Engulfing candlestick pattern supports the bearish Elliott wave count.
DAILY CHART
Click chart to enlarge.
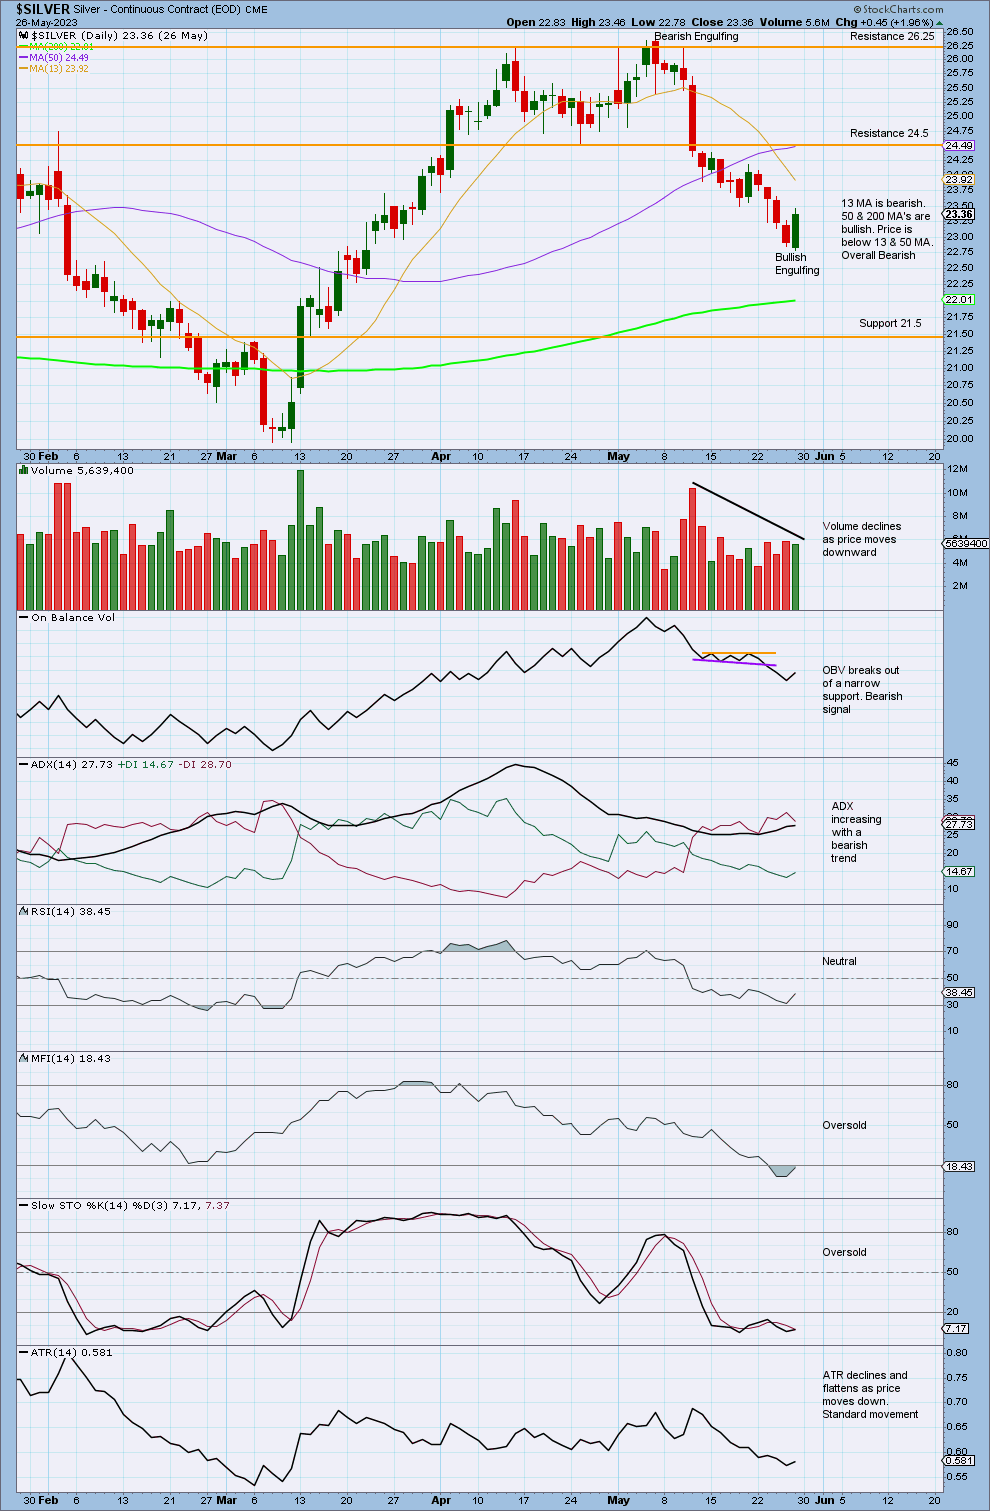
There is a bearish trend that is not yet extreme. It also has declining volume as price falls. MFI is oversold and RSI is entering oversold, indicating price may find a low soon, with ADX continuing to increase before reaching extreme. In these circumstances a Bullish Engulfing pattern completes but it lacks support from volume.
Both volume and range declined as price moved higher to the last high in early May. This supports the first Elliott wave count and not the second. For the second Elliott wave count, a third wave up should not come with weak volume and declining range.
Published @ 03:18 p.m. ET.
—
Careful risk management protects your trading account(s).
Follow my two Golden Rules:
1. Invest only funds you can afford to lose.
2. Have an exit strategy for both directions; when to take profit and when to exit a losing investment.
—
New updates to this analysis are in bold.
—
 Save as PDF