July 28, 2023: MSTR (MicroStrategy Inc.) Technical Analysis – Charts
When I looked at this stock a year ago, I expected a low may be in place but wanted a new high above 265 for confidence.
Summary: An upwards breakout above 265 adds confidence that a low may be in place. A bullish trend is underway; it is not extreme.
TECHNICAL ANALYSIS
MONTHLY CHART
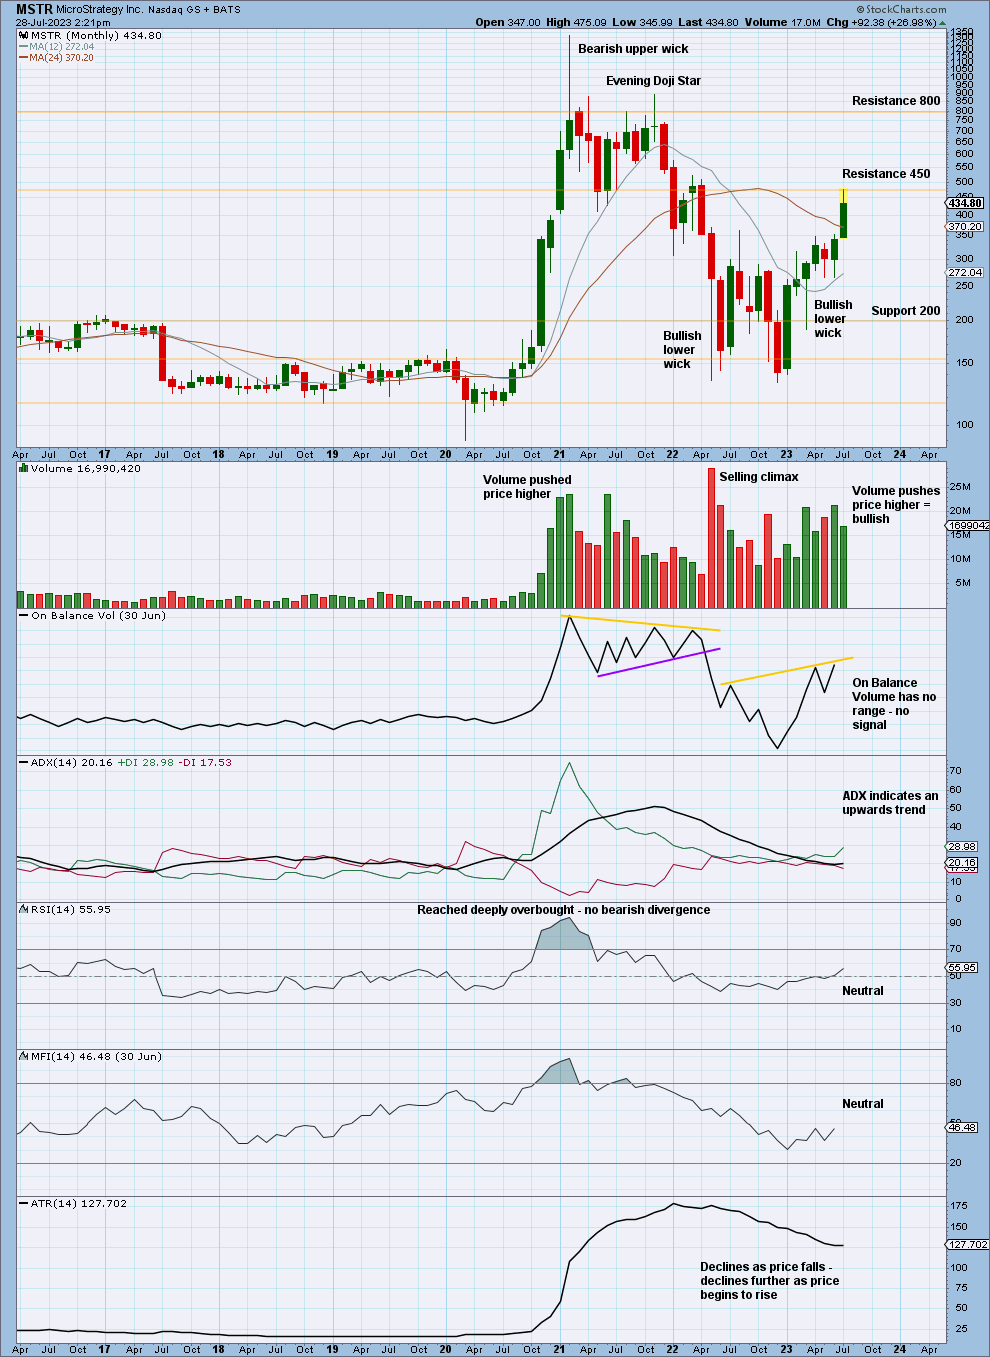
Click chart to enlarge. Chart courtesy of StockCharts.com.
There is an upwards trend that has a long way to go before it reaches extreme. There is room to go before RSI reaches overbought. Volume supports the bullish trend.
WEEKLY CHART
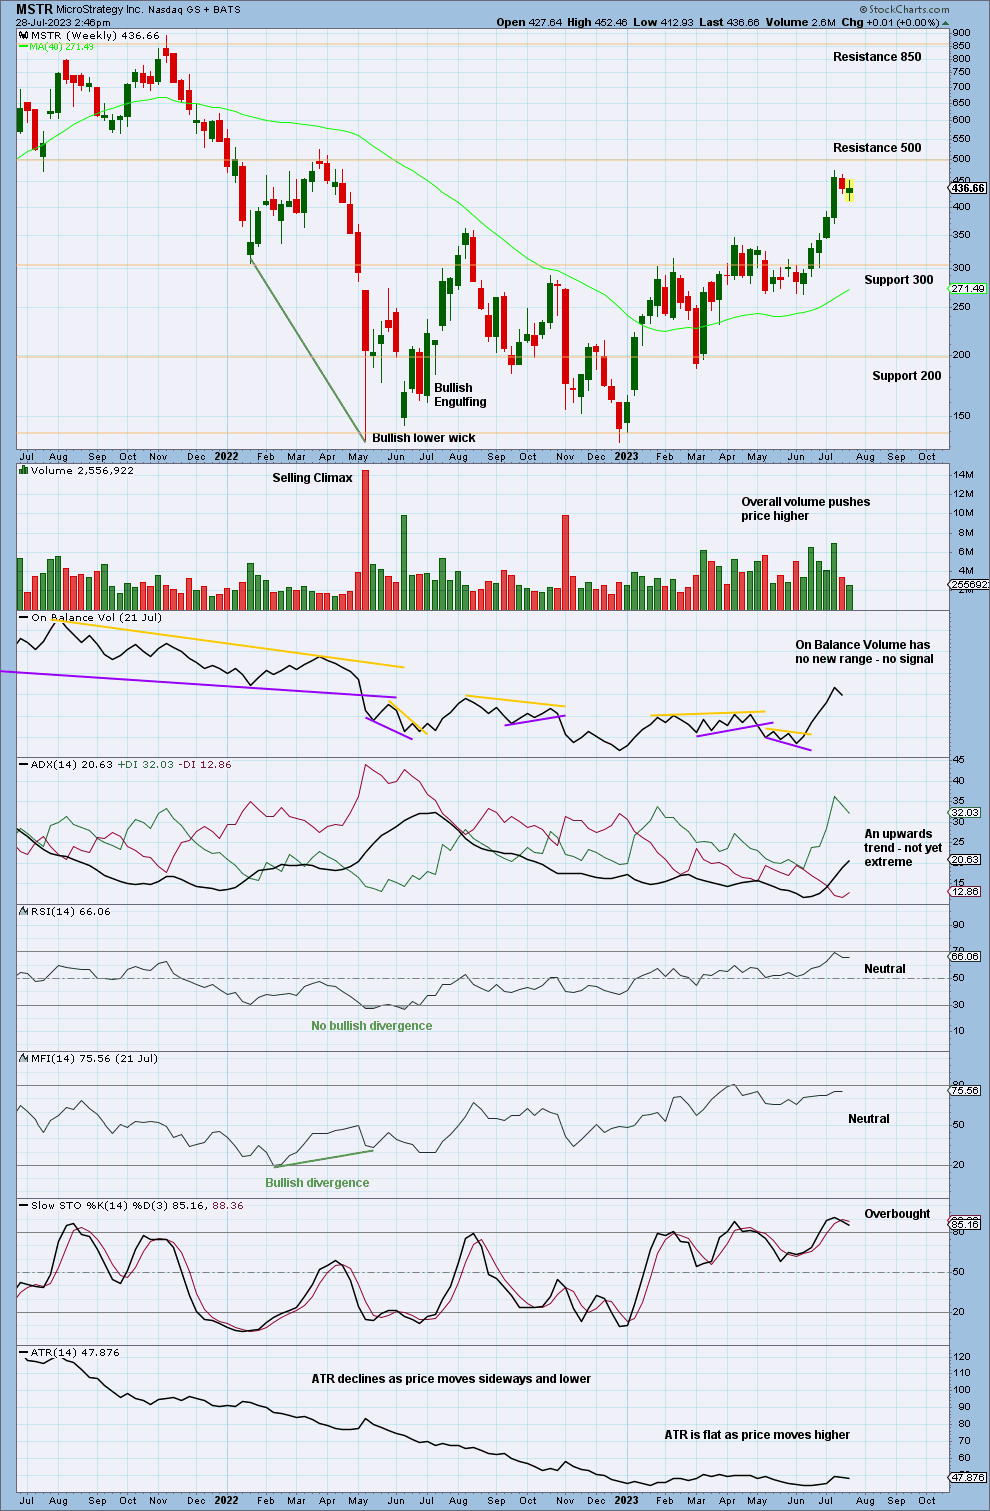
Click chart to enlarge. Chart courtesy of StockCharts.com.
The upwards trend is not extreme and RSI is not overbought. If resistance about 500 is overcome, then look for next resistance about 850.
Published @ 03:06 p.m. ET.
—
Careful risk management protects your investment account(s).
Follow my two Golden Rules:
1. Invest only funds you are prepared to lose entirely.
2. Always have an exit strategy for both directions; when or where to take profit on a winning investment, and when or where to close a losing investment.
—
New updates to this analysis are in bold.
—
 Save as PDF