August 8, 2023: NASDAQ Elliott Wave and Technical Analysis – Video and Charts
Price has continued to increase as expected by the Elliott wave count.
Summary: Price is expected to increase within primary wave 1, currently within minor wave 1 of intermediate wave (3).
Note that the S&P 500 and NASDAQ do not always find highs and lows together. The last all-time high for the S&P 500 was on January 4, 2022, whereas the last all-time high for NASDAQ was November 22, 2021.
Last updated monthly charts are here.
MAIN ELLIOTT WAVE COUNT
WEEKLY CHART
Click chart to enlarge.
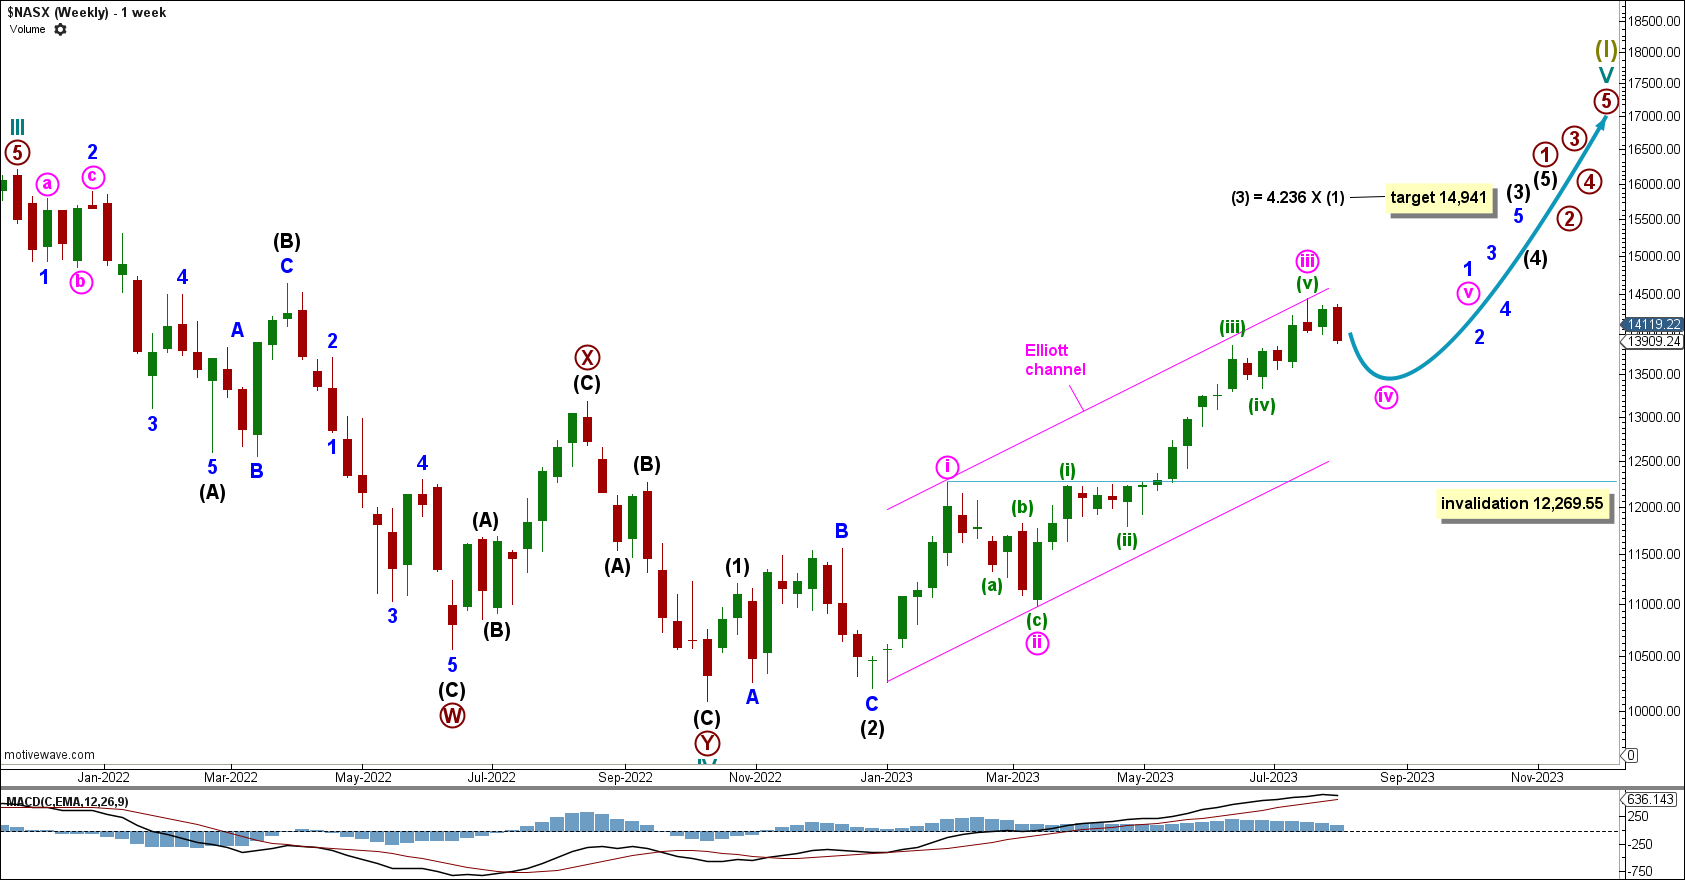
Within primary wave 1 of cycle wave V: Intermediate waves (1) and (2) may be complete and intermediate wave (3) has begun.
Within intermediate wave (3): Minute wave iii may be complete and minute wave iv is now expected to move down for a corrective movement, which may find support at the lower edge of the Elliott channel.
Minute wave iv cannot move below the end of minute wave i at 12,269.55.
Minute wave iii has reached near the 1.618 Fibonacci ratio of minute wave i, where the target was calculated at 14,319. Minute wave iii ended at 14,446.
It is possible that minute wave iii continues higher. If price does continue higher, then we will use a target calculated to where minute wave iii will reach 2.618 times the length of minute wave i.
Intermediate wave (3) has a target calculated at 4.236 times the length of intermediate wave (1) at 14,941.
DAILY CHART
Click chart to enlarge.
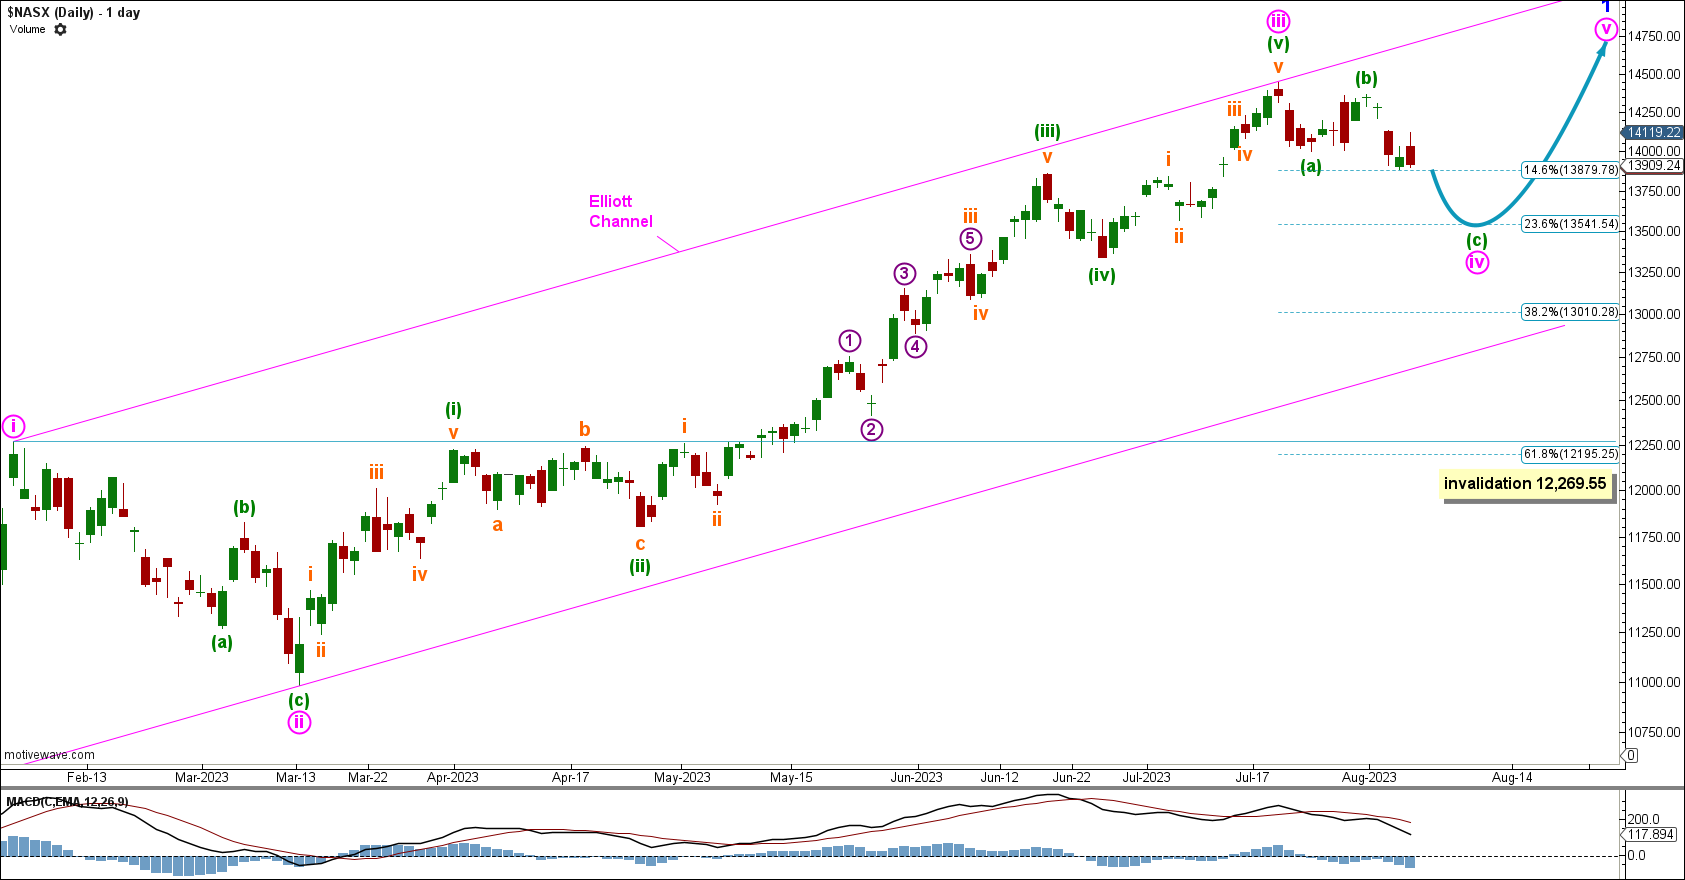
Within intermediate wave (3), minor wave 1 looks likely to be an incomplete impulse.
Within minor wave 1, we now expect a corrective movement for minute wave iv. The target is at 13,541.54, a 23.6% retracement of minute wave iii.
An Elliott channel is drawn from the end of minute wave i to the end of minute wave iii, with a parallel copy placed on the end of minute wave ii. Minute wave iv may find support at the lower edge of the channel if it moves beyond the target.
Currently, minute wave iv is labelled as an incomplete zigzag.
However, the structure may have to be relabelled as the wave unfolds. Using the guideline of alternation, minute wave iv may subdivide as a double zigzag or a combination. Or it may also be unfolding as an incomplete flat.
ALTERNATE ELLIOTT WAVE COUNT
ALTERNATE WEEKLY CHART
Click chart to enlarge.
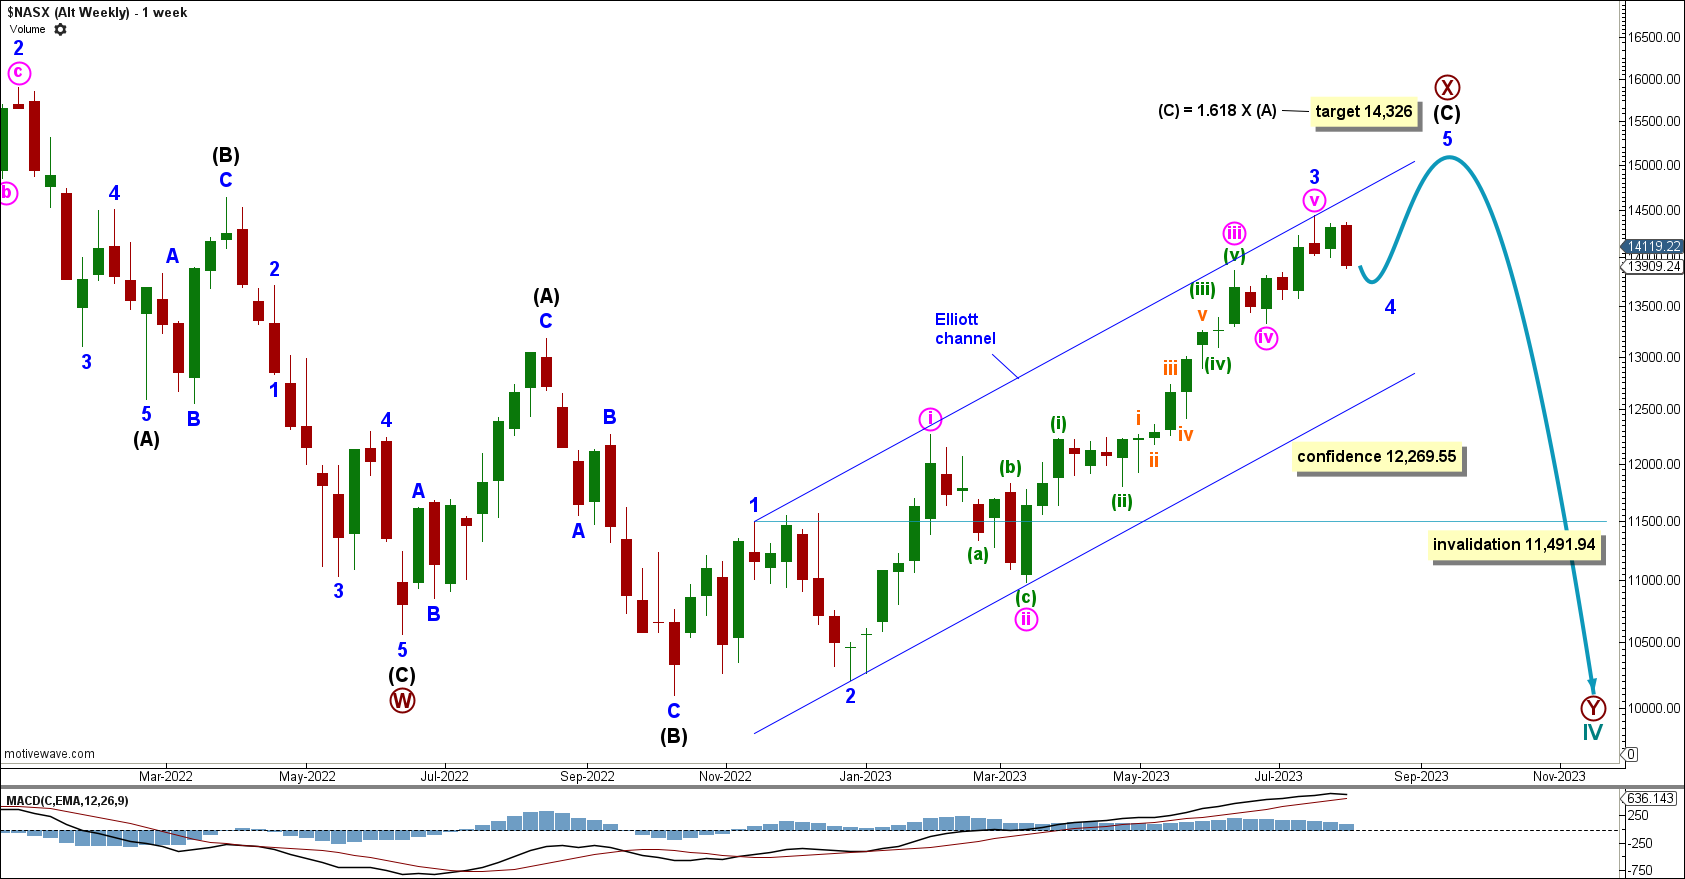
This alternate sees cycle wave IV incomplete and expects the current bullish movement to be a rally within a larger bearish trend. For the long term, price is expected to continue down for the end of primary wave Y and cycle wave IV.
Within intermediate wave (C), a corrective movement for minor wave 4 is expected to move price lower, with minor wave 4 potentially finding support at the lower edge of the Elliott channel.
The channel is drawn using Elliott’s first technique. Draw a line from the end of minor wave 1 to the end of minor wave 3, with a parallel copy placed on the end of minor wave 2.
Minor wave 4 cannot move into minor wave 1 price territory below 11,491.94.
Intermediate wave (C) has a target calculated to reach 1.618 times the length of intermediate wave (A) at 14,326.
ALTERNATE DAILY CHART
Click chart to enlarge.
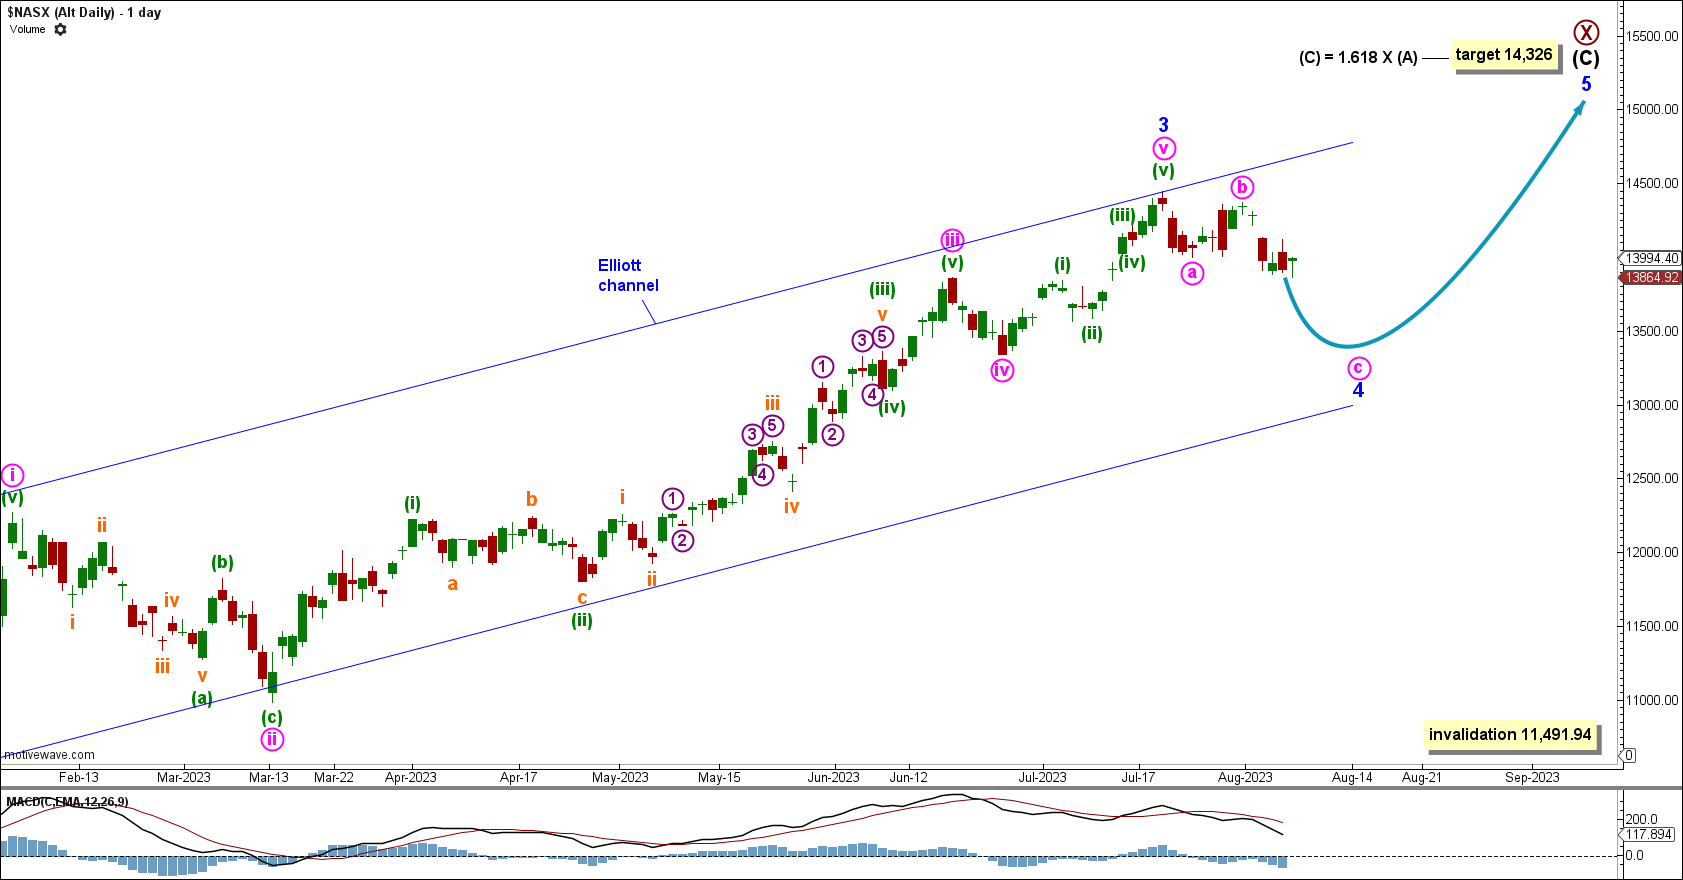
Minor wave 3 may be complete at the last high, slightly surpassing the initial target where it would reach 1.618 times the length of minor wave 1 at 14,319.
If price continues higher, then we will use a target where minor wave 3 is calculated to reach 2.618 times the length of minor wave 1.
A corrective movement is now expected for minor wave 4. It may find support near the lower edge of the Elliott channel.
TECHNICAL ANALYSIS
WEEKLY CHART
Click chart to enlarge.
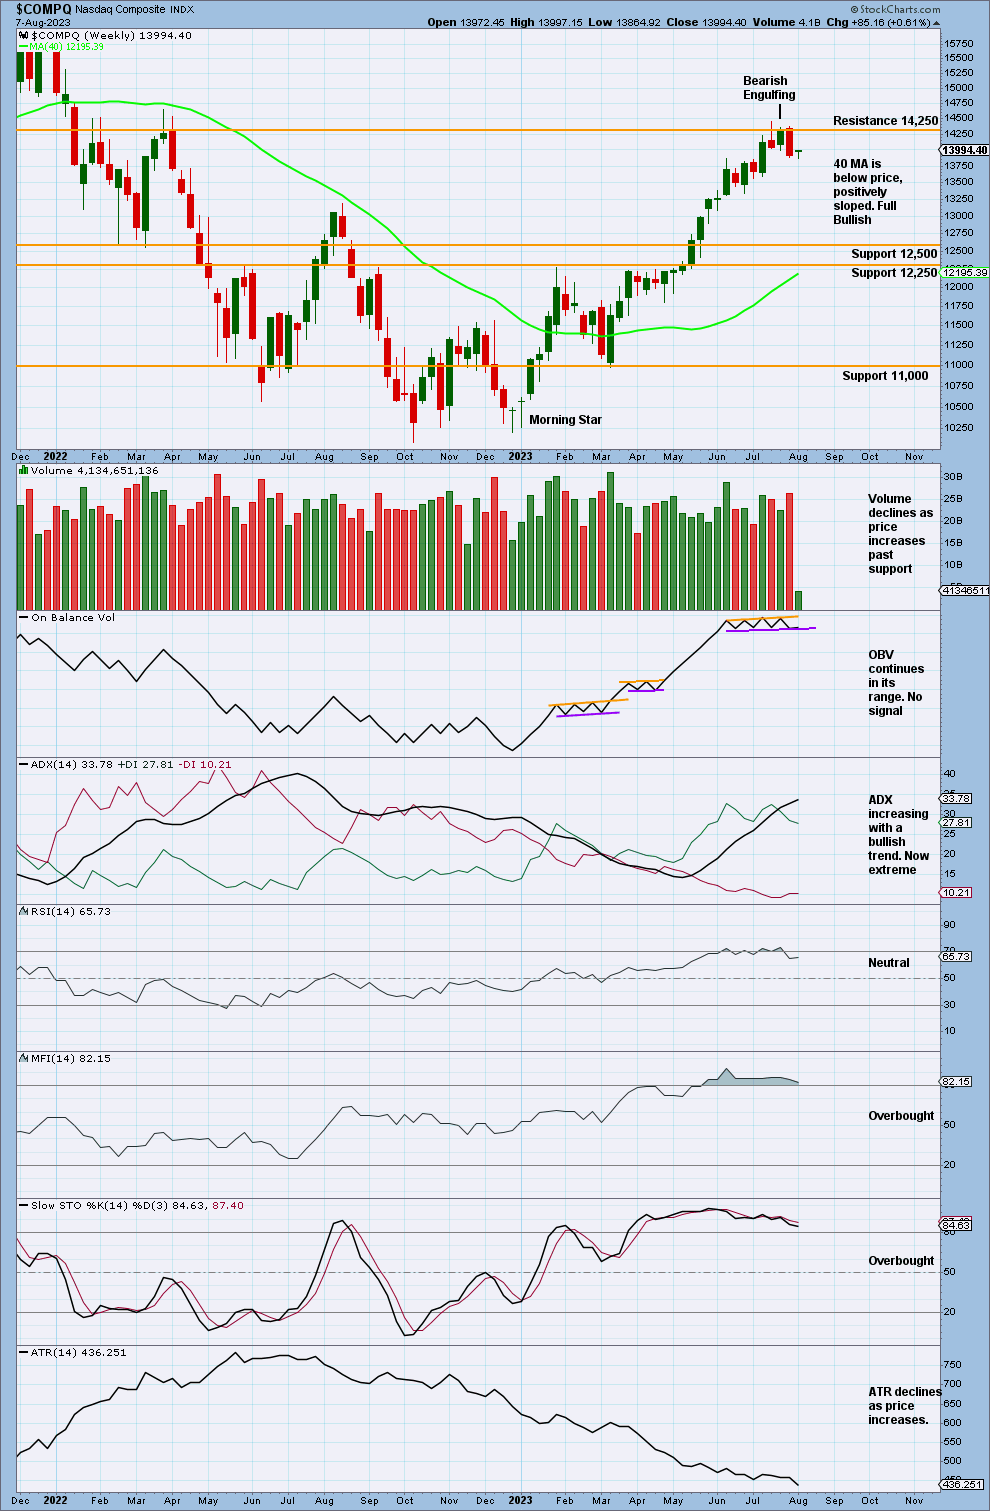
The previous week ended with a Bearish Engulfing pattern and increased volume.
ADX now indicates an extreme trend because the ADX line is above both DX lines. However, the ADX line is not above 40, giving the upwards trend only a short way to go before it may end.
MFI is overbought.
Currently, there is no bearish divergence with RSI.
Price found resistance at 14,250 and is now moving away. Price is expected to unfold in a corrective movement to relieve extreme conditions before the upwards trend may continue. This is fairly bearish and supports both Elliott wave counts.
DAILY CHART
Click chart to enlarge
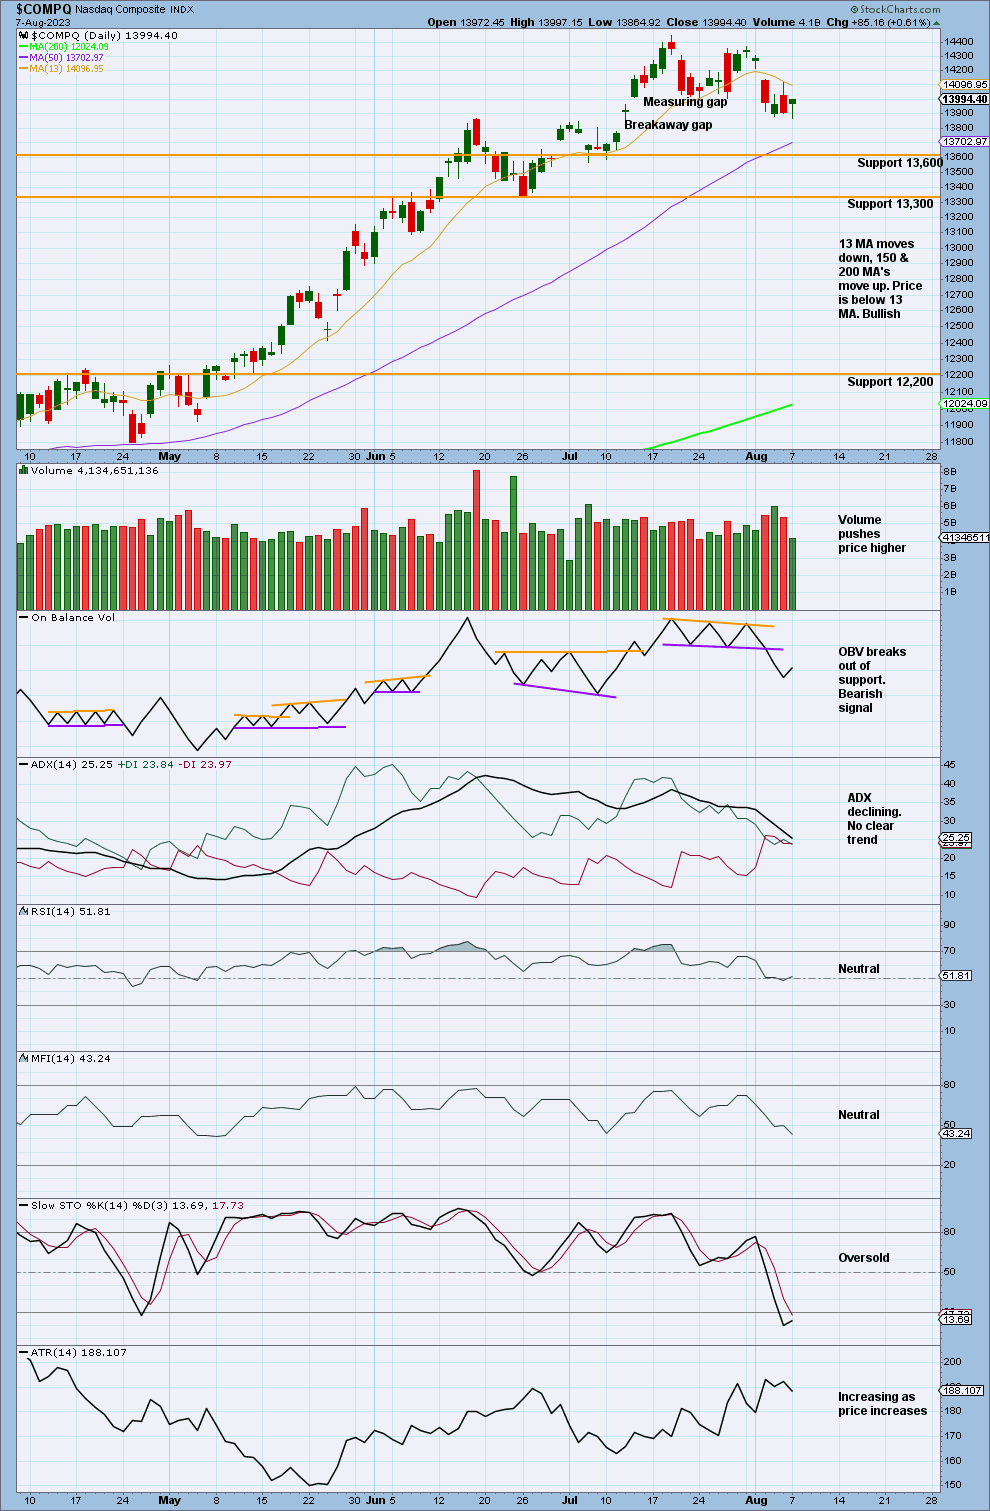
ADX is declining and does not indicate a clear trend. Because of this we use a model of Stochastics and support & resistance. As Stochastics has just entered oversold, a downwards swing may continue where price may find support at 13,600.
Overall, this supports the Elliott wave count.
NAAD WEEKLY CHART
Click chart to enlarge
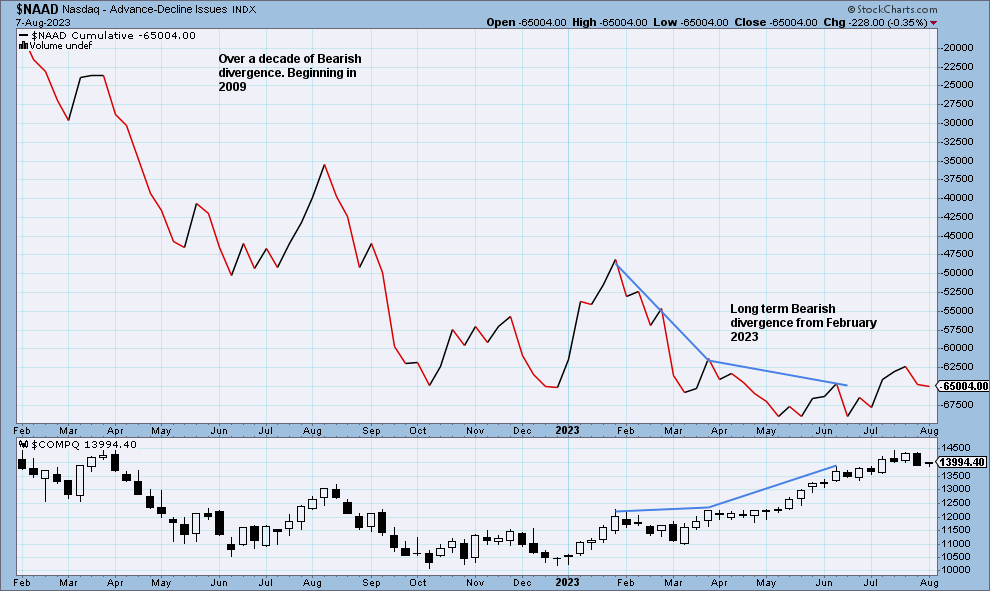
Nasdaq price is making higher lows, but the Nasdaq AD line has made lower lows. This divergence is bearish, and it shows that the rise in price does not have support from rising market breadth.
This divergence is now long term, going back to February 2023. There is also continued bearish divergence dating back over a decade to 2009.
Published @ 07:46 p.m. ET.
—
Careful risk management protects your trading account(s).
Follow my two Golden Rules:
1. Always trade with stops.
2. Risk only 1-5% of equity on any one trade.
—
New updates to this analysis are in bold.
—
 Save as PDF