August 15, 2023: NASDAQ Elliott Wave and Technical Analysis – Video and Charts
Price has moved down as both Elliott wave counts expected.
Summary: A mid-term target is 14,921. For the short term, a pullback may find support about 13,123.
Note that the S&P 500 and NASDAQ do not always find highs and lows together. The last all-time high for the S&P 500 was on January 4, 2022, whereas the last all-time high for NASDAQ was November 22, 2021.
Last updated monthly charts are here.
MAIN ELLIOTT WAVE COUNT
WEEKLY CHART
Click chart to enlarge.
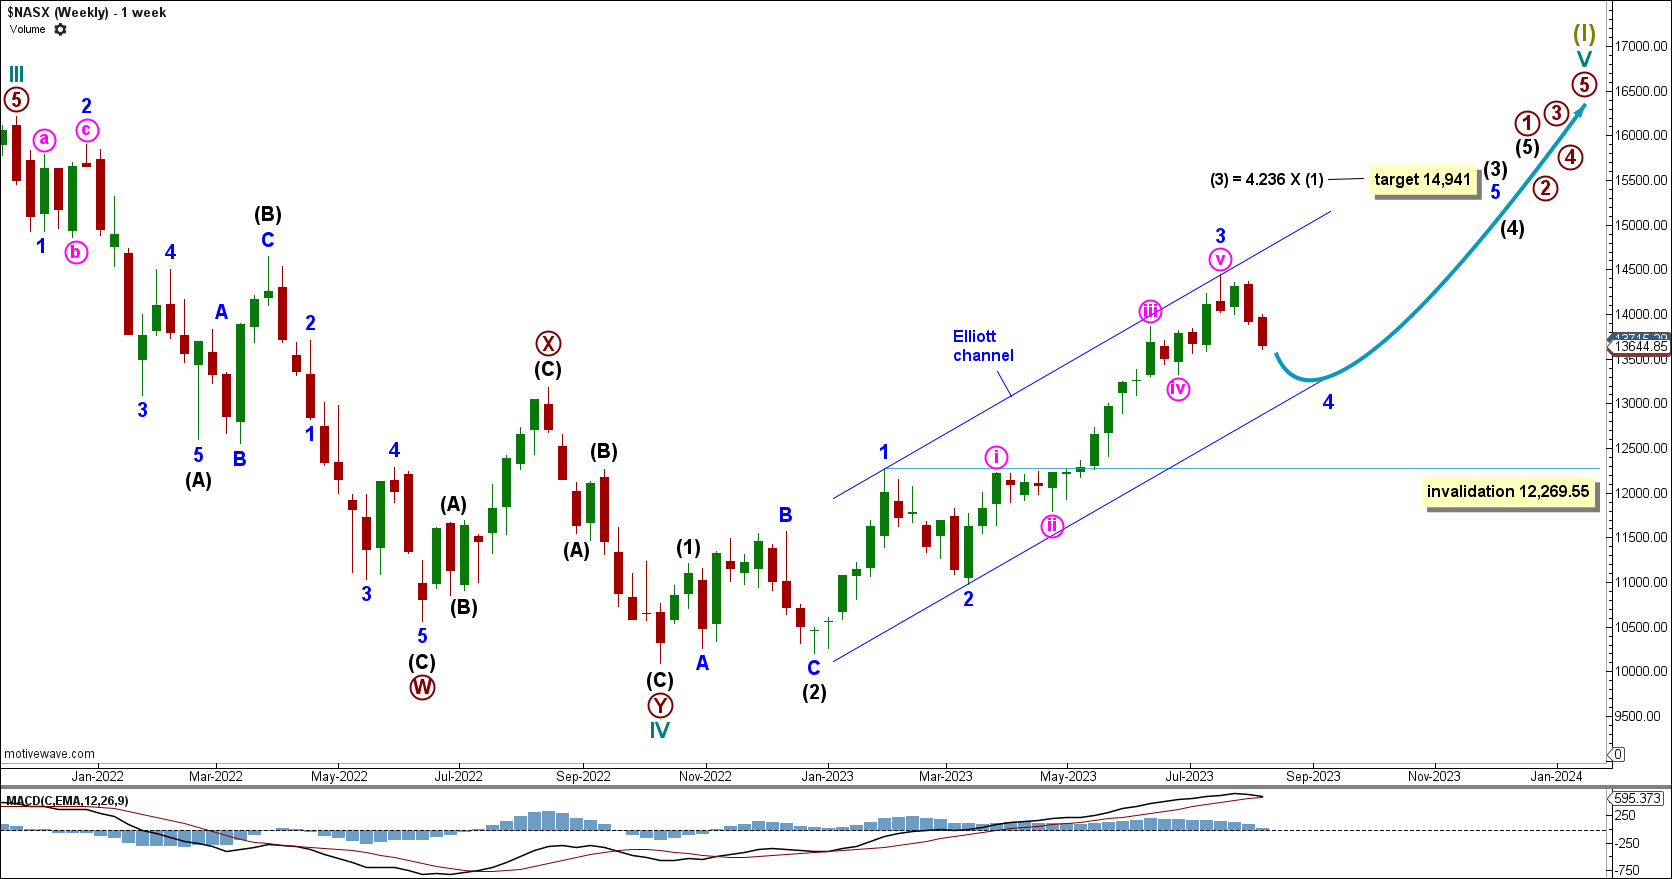
Price has moved down for minor wave 4.
An Elliott channel is drawn using Elliott’s first technique. Draw a line from the end of minor wave 1 to the end of minor wave 3, with a parallel copy placed on the end of minor wave 2.
Minor wave 4 may find support at the lower edge of the channel.
Minor wave 4 cannot move below the end of minor wave 1 at 12,269.55.
Intermediate wave (3) has a target calculated at 4.236 times the length of intermediate wave (1) at 14,941.
DAILY CHART
Click chart to enlarge.
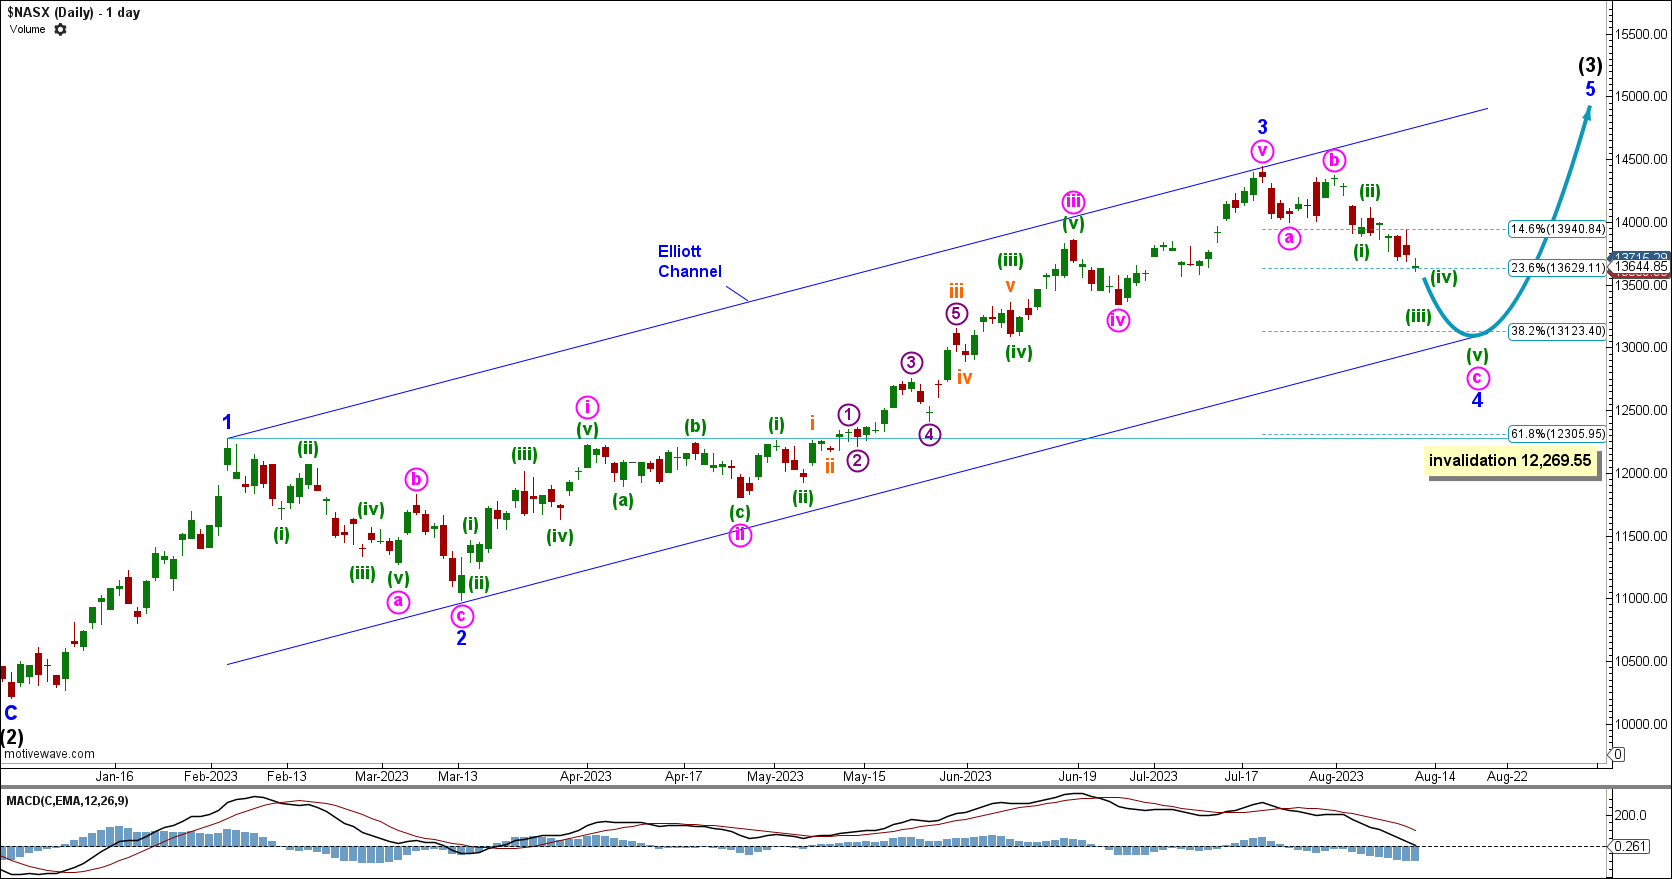
Price continues lower for minor wave 4. It currently subdivides as an incomplete zigzag, but it may have to be relabelled as the structure unfolds. Using the guideline of alternation, minor wave 4 could subdivide as a double zigzag or combination or flat.
Minor wave 4 may end within the range of minute wave iv within minor wave 3. This range is between 13,864.05 at the high and 13,334.42 at the low.
An alternate target is at 13,123.40, the 0.382 Fibonacci ratio of minor wave 3.
ALTERNATE ELLIOTT WAVE COUNT
ALTERNATE WEEKLY CHART
Click chart to enlarge.
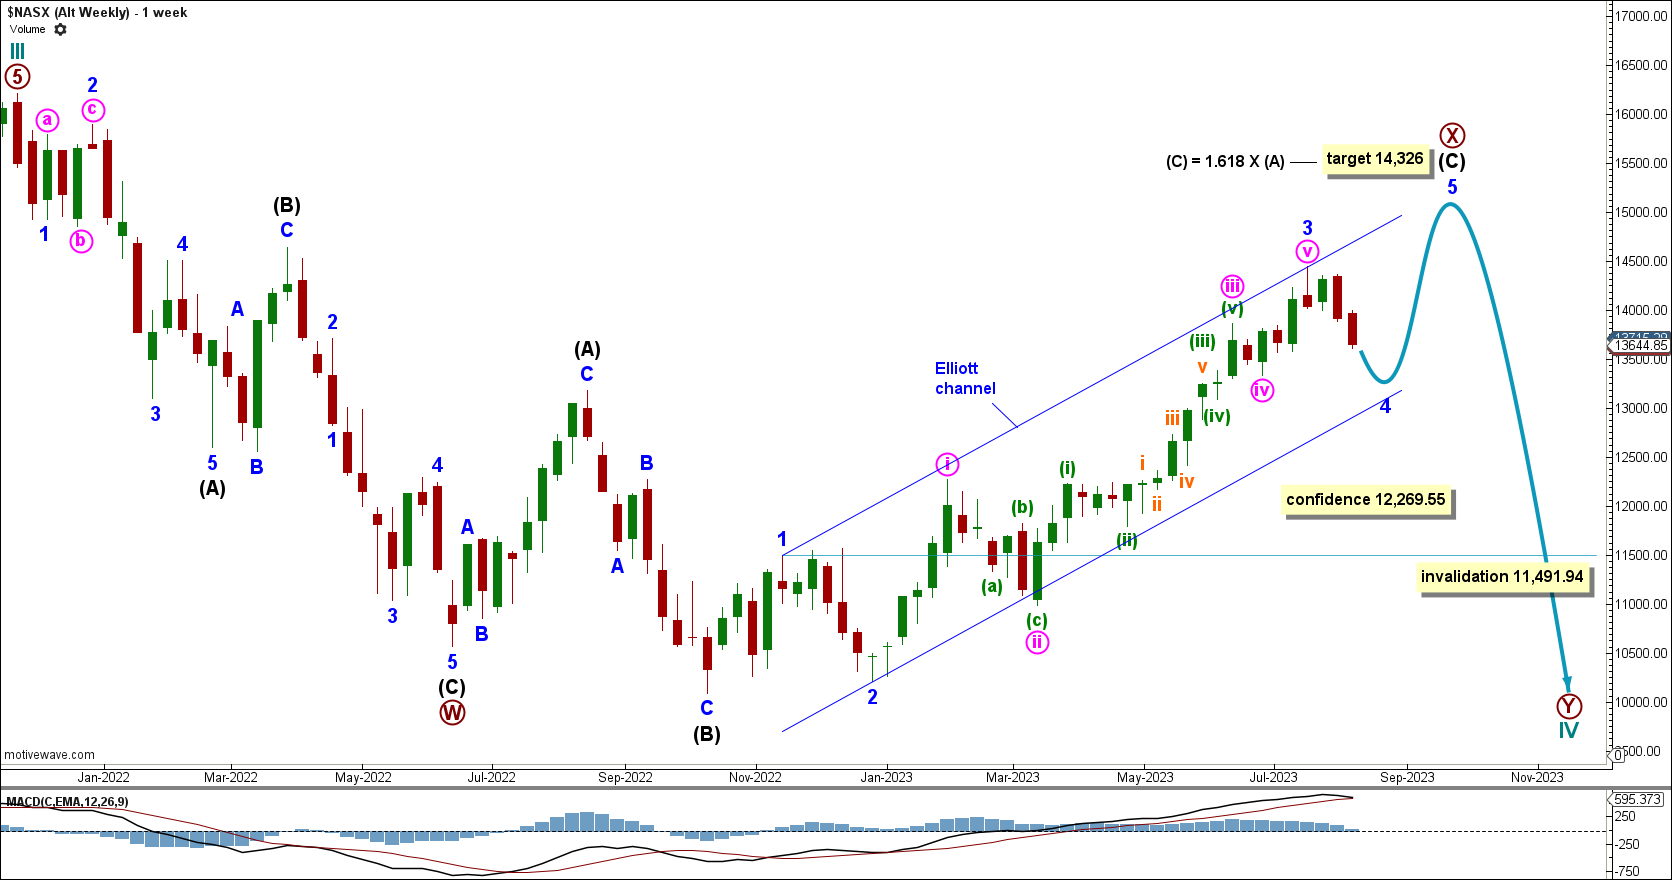
This alternate sees cycle wave IV incomplete and expects the current bullish movement to be a rally within a larger bearish trend. For the long term, price is expected to continue down for the end of primary wave Y and cycle wave IV.
Within intermediate wave (C), minor wave 4 is expected to continue. It may find support at the lower edge of the Elliott channel.
The channel is drawn using Elliott’s first technique. Draw a line from the end of minor wave 1 to the end of minor wave 3, with a parallel copy placed on the end of minor wave 2.
Minor wave 4 cannot move into minor wave 1 price territory below 11,491.94.
Intermediate wave (C) has a target calculated to reach 1.618 times the length of intermediate wave (A) at 14,326.
A low below 12,269.55 will add confidence to this wave count because it is the invalidation of the main wave count.
ALTERNATE DAILY CHART
Click chart to enlarge.
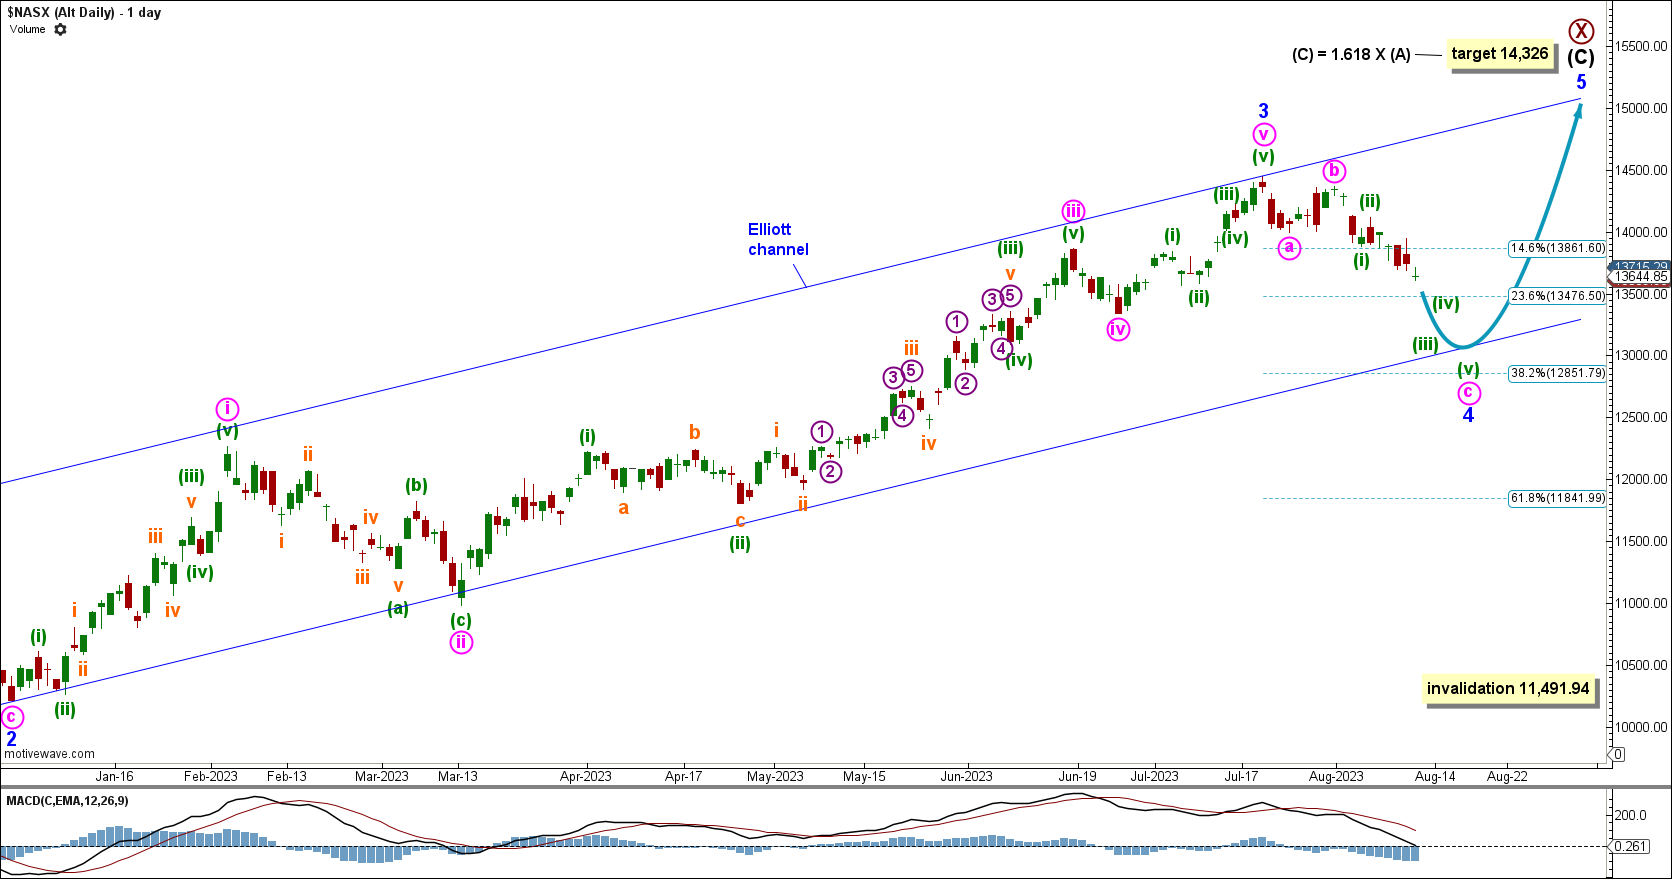
Minor wave 4 is expected to continue lower for minuette wave (iii) within minute wave c. It may find support at the lower edge of the Elliott channel, though if it continues lower the channel will have to be redrawn.
Minor wave 4 may also retrace 38.2% of minor wave 3, reaching the 0.382 Fibonacci ratio at 12,851.79.
TECHNICAL ANALYSIS
WEEKLY CHART
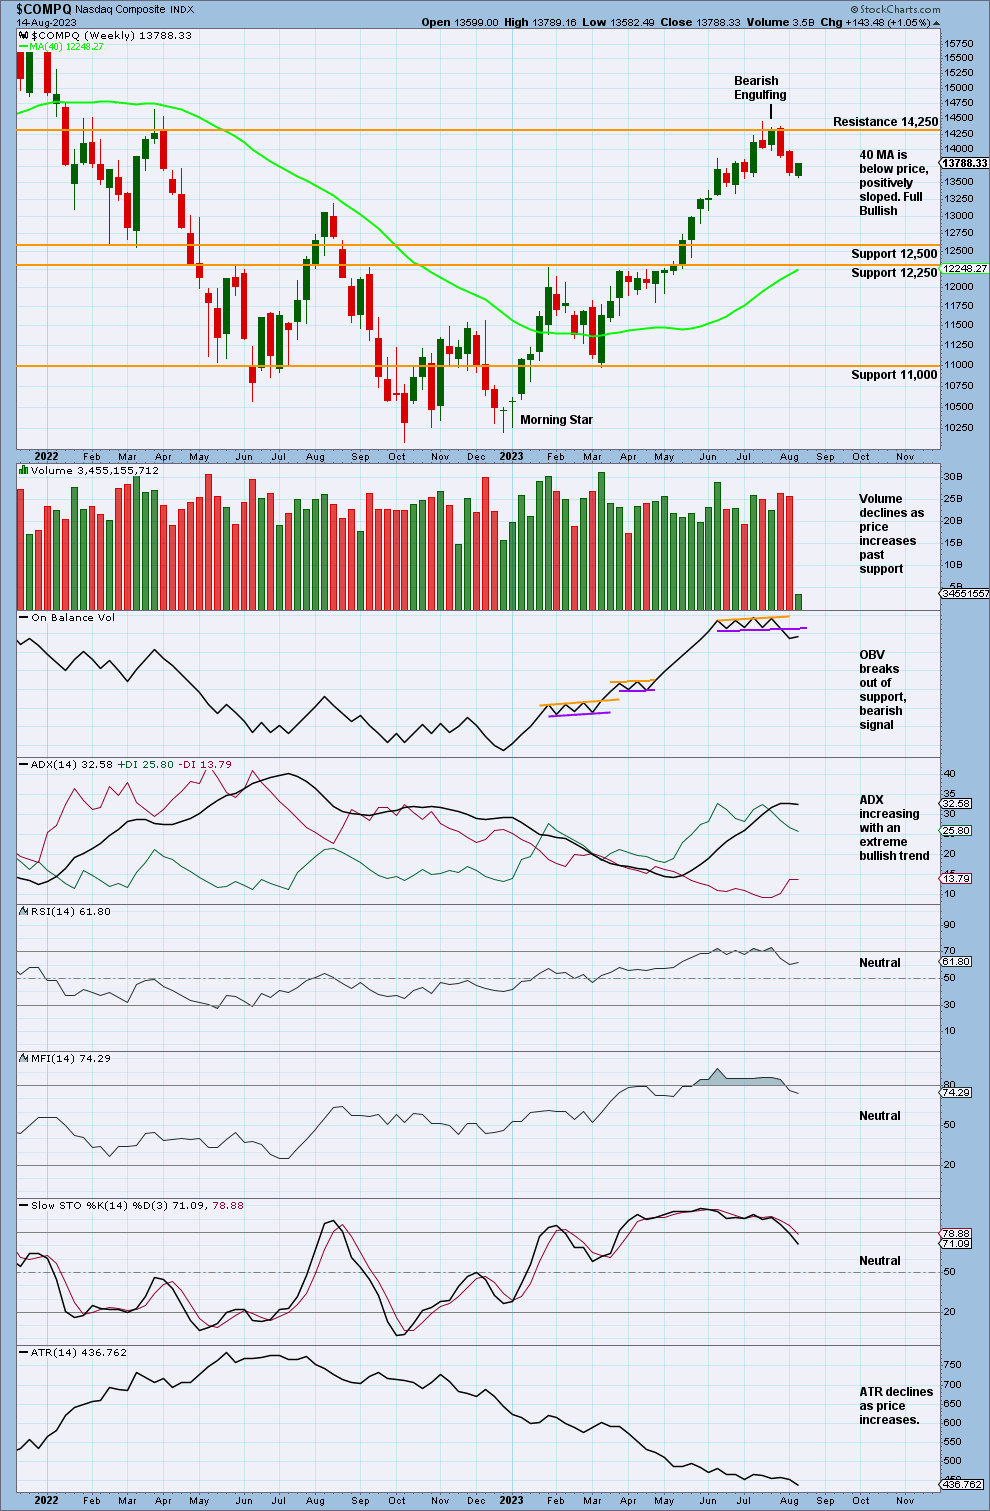
Click chart to enlarge.
Price continues to move away from resistance at 14,250.
ADX is now declining, so it indicates no clear trend. The model of Stochastics and support and resistance expects a downwards swing to continue.
MFI has returned from overbought as price moves away from resistance. A correction may continue.
Currently, there is no bearish divergence with either MFI or RSI.
On Balance Volume has broken out of support, giving a bearish signal. This supports the idea that price may find a correction before continuing upwards. This supports the Elliott wave analysis.
DAILY CHART
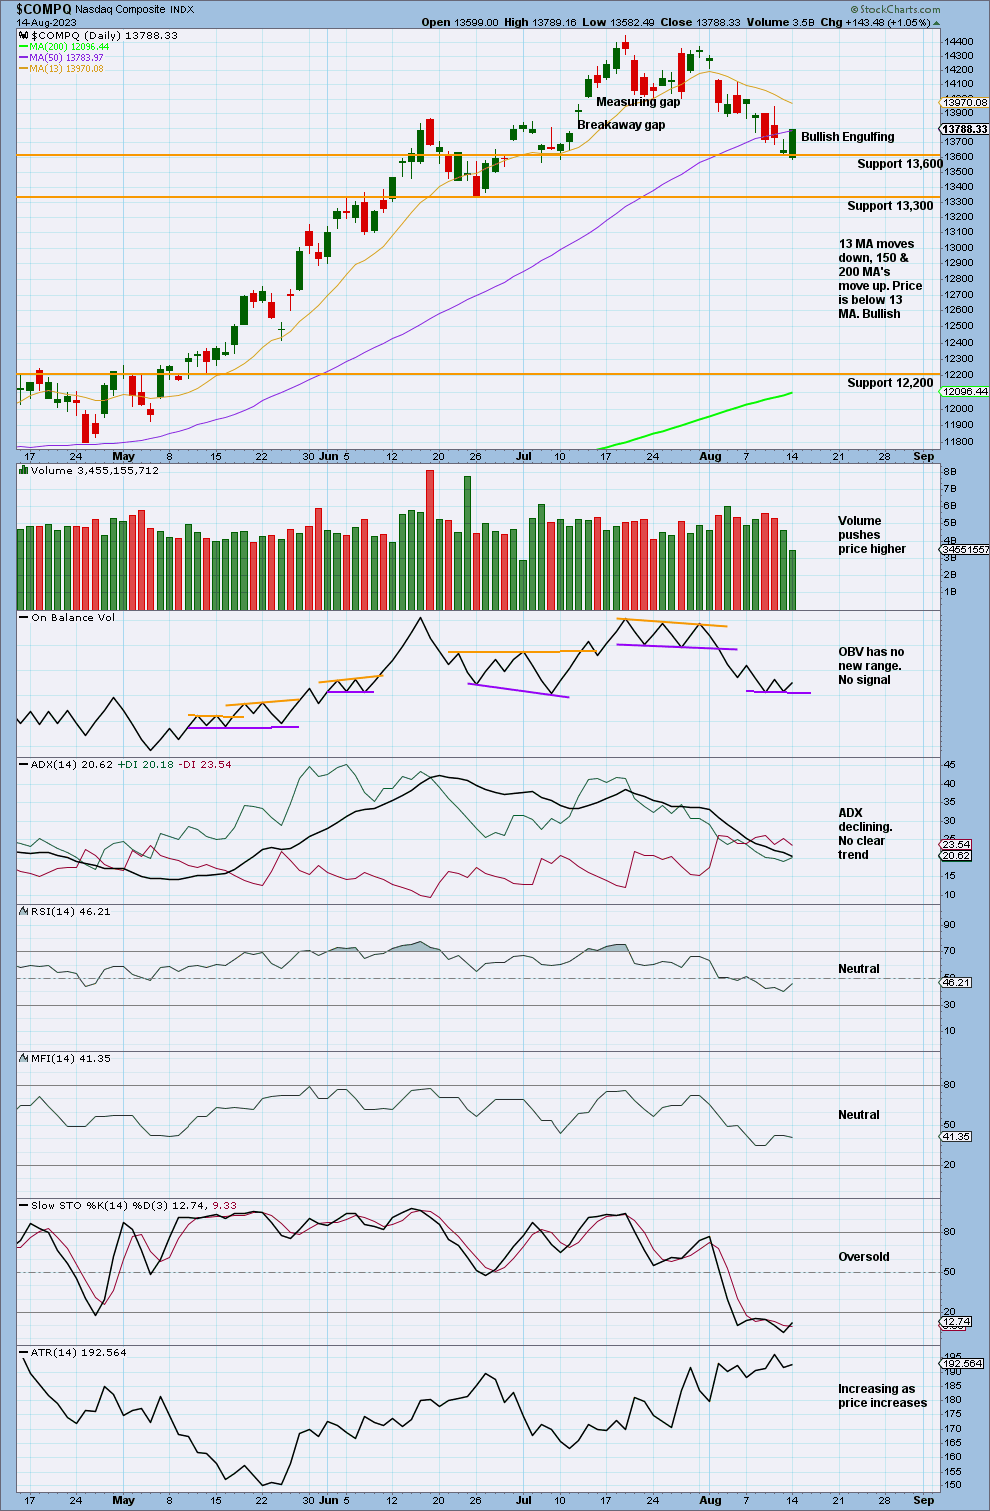
Click chart to enlarge
Price has moved down, finding support at 13,600 with a Bullish Engulfing pattern. However, the Bullish Engulfing pattern has very weak volume; it may indicate only a small bounce within the larger pullback and not necessarily an end to the pullback here.
ADX is declining and does not indicate any clear trend. Because of this we use a model of Stochastics and support and resistance. As Stochastics is oversold, and price finds support at 13,600 with a Bullish Engulfing pattern, an upwards swing may occur soon.
RSI has reached overbought twice but does not exhibit divergence.
NAAD WEEKLY CHART
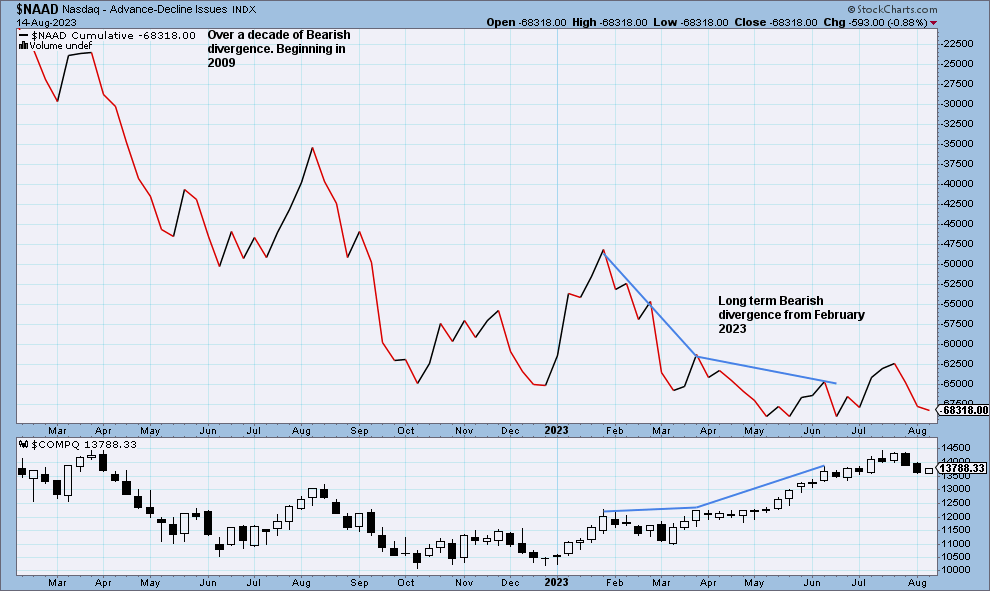
Click chart to enlarge
Nasdaq price is making higher highs, but the Nasdaq AD line has made lower highs. This divergence is bearish, and it shows that the rise in price does not have support from rising market breadth.
This divergence is now long term, going back to February 2023. There is also continued bearish divergence dating back over a decade to 2009.
Published @ 07:52 p.m. ET.
—
Careful risk management protects your trading account(s).
Follow my two Golden Rules:
1. Always trade with stops.
2. Risk only 1-5% of equity on any one trade.
—
New updates to this analysis are in bold.
—
 Save as PDF