August 21, 2023: NASDAQ Elliott Wave and Technical Analysis – Video and Charts
Price continues down towards support at the drawn trend channel as both Elliott wave counts expected.
Summary: A pullback may be complete, the upwards trend may resume. A mid-term target is 14,941.
Note that the S&P 500 and NASDAQ do not always find highs and lows together. The last all-time high for the S&P 500 was on January 4, 2022, whereas the last all-time high for NASDAQ was November 22, 2021.
Last updated monthly charts are here.
MAIN ELLIOTT WAVE COUNT
WEEKLY CHART
Click chart to enlarge.
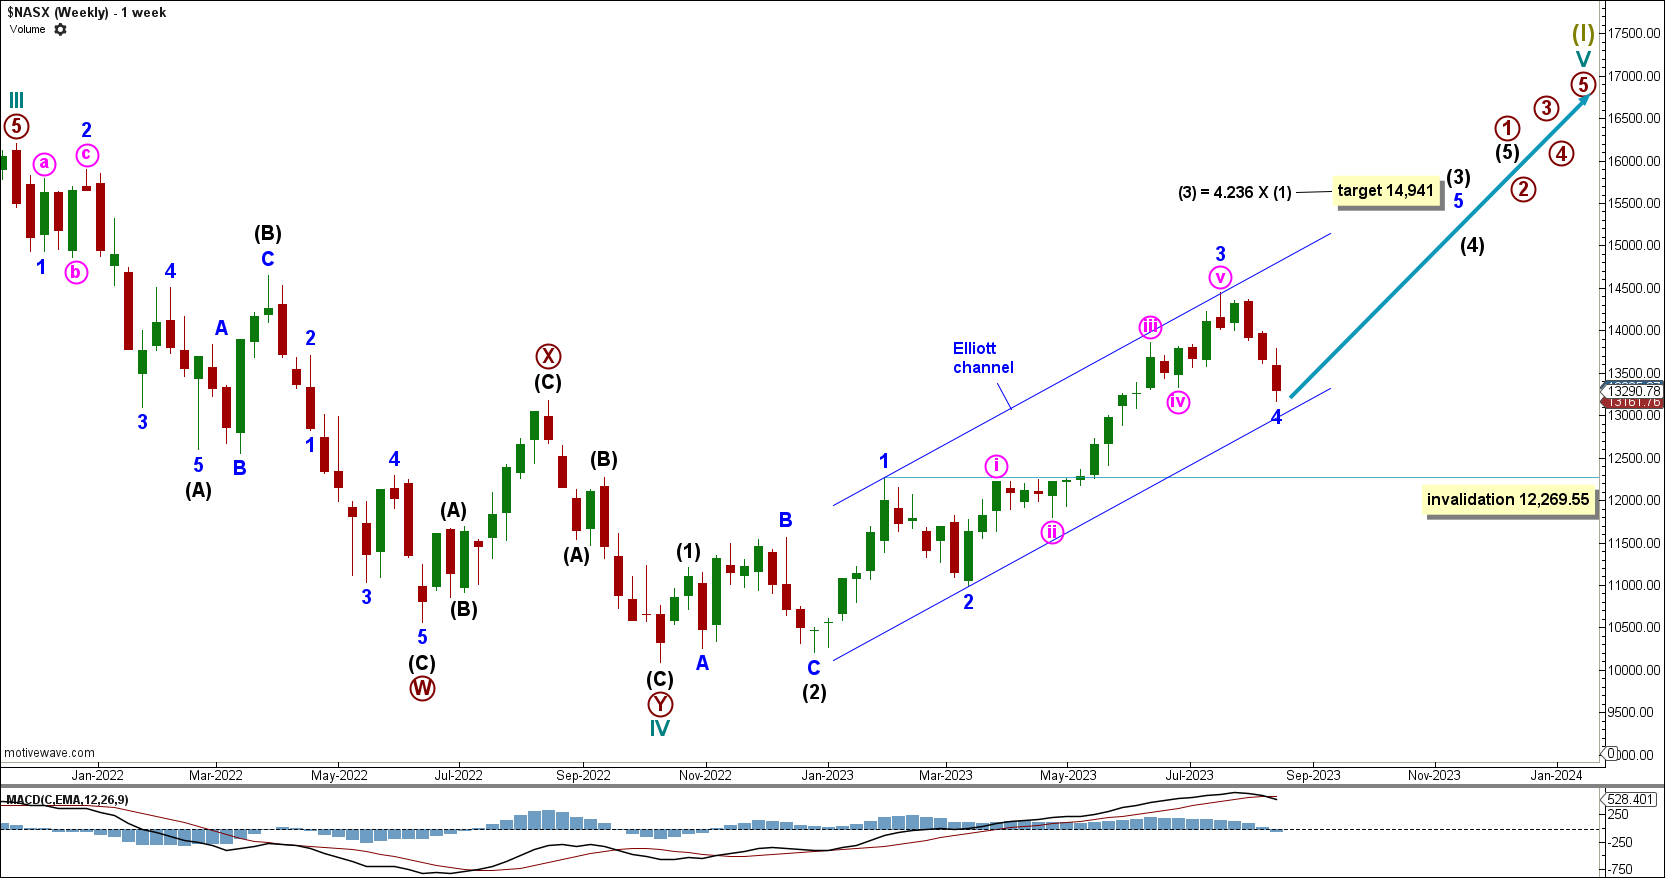
Price has continued down for minor wave 4.
An Elliott channel is drawn using Elliott’s first technique. Draw a line from the end of minor wave 1 to the end of minor wave 3, with a parallel copy placed on the end of minor wave 2.
Minor wave 4 may be complete at the current low, or it may continue lower, finding strong support at the lower edge of the Elliott channel. If minor wave 4 does move lower and breaks through support, then it cannot move below the end of minor wave 1 at 12,269.55.
Intermediate wave (3) has a target calculated at 14,941, which is 4.236 times the length of intermediate wave (1).
DAILY CHART
Click chart to enlarge.
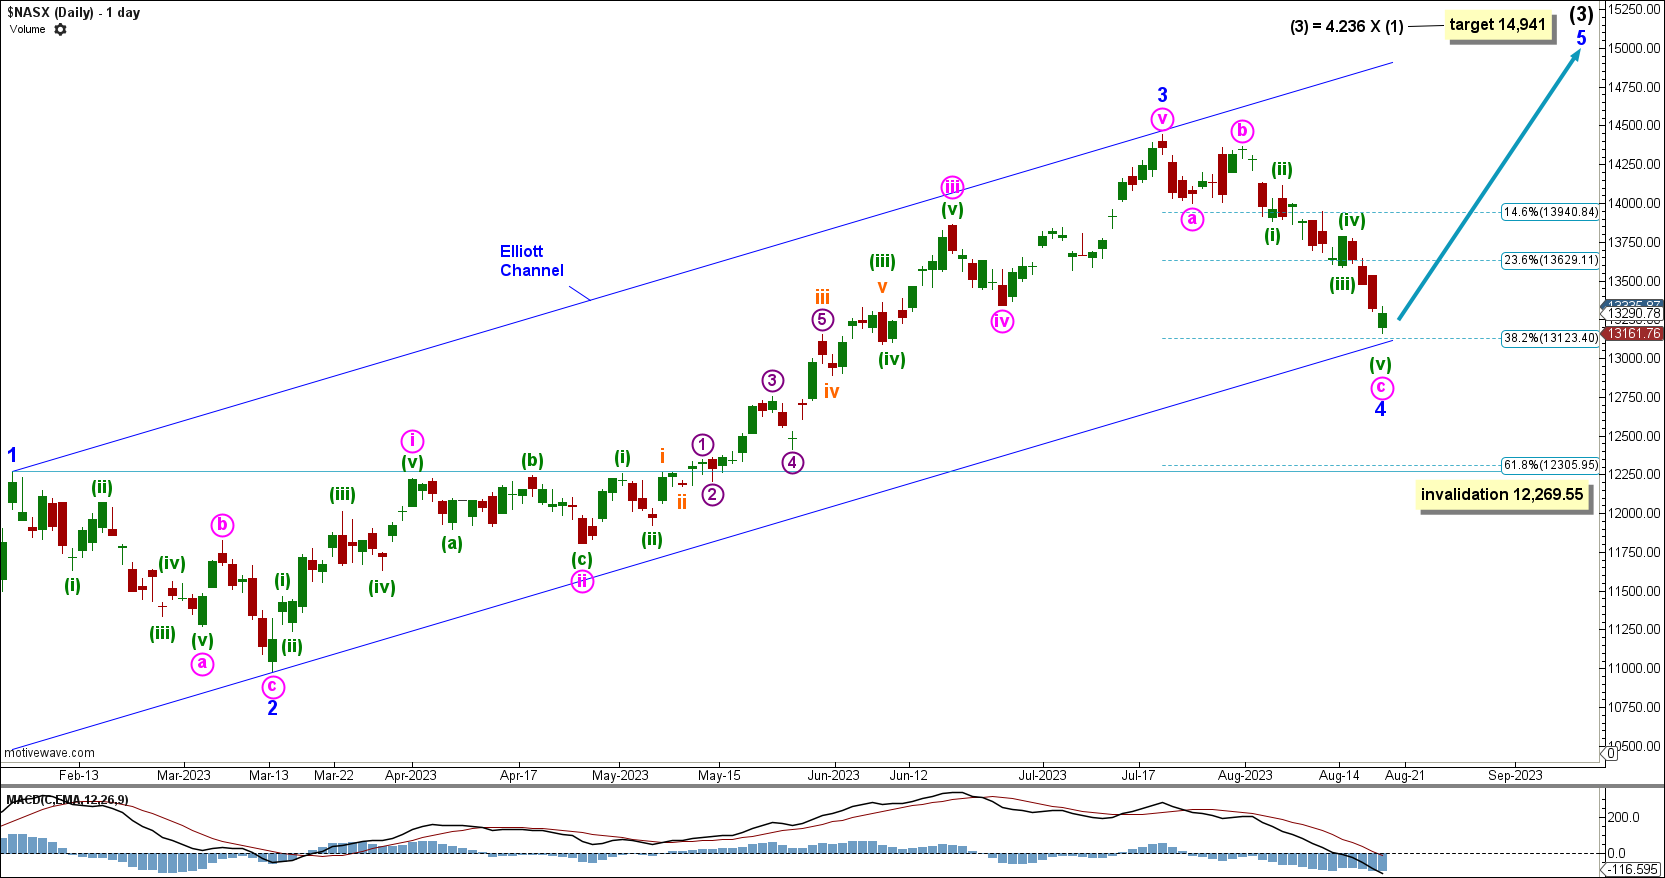
Price continues lower for minor wave 4, which subdivides as a complete zigzag.
While both minor waves 2 and 4 are zigzags, there is some alternation between them. Minor wave 2 has an extended minute wave a and a short minute wave c, whereas minor wave 4 has a short minute wave a and an extended minute wave c.
Minor wave 4 may have ended about support at the lower edge of the Elliott channel, but the structure may have to be relabelled if it continues lower.
ALTERNATE ELLIOTT WAVE COUNT
ALTERNATE WEEKLY CHART
Click chart to enlarge.
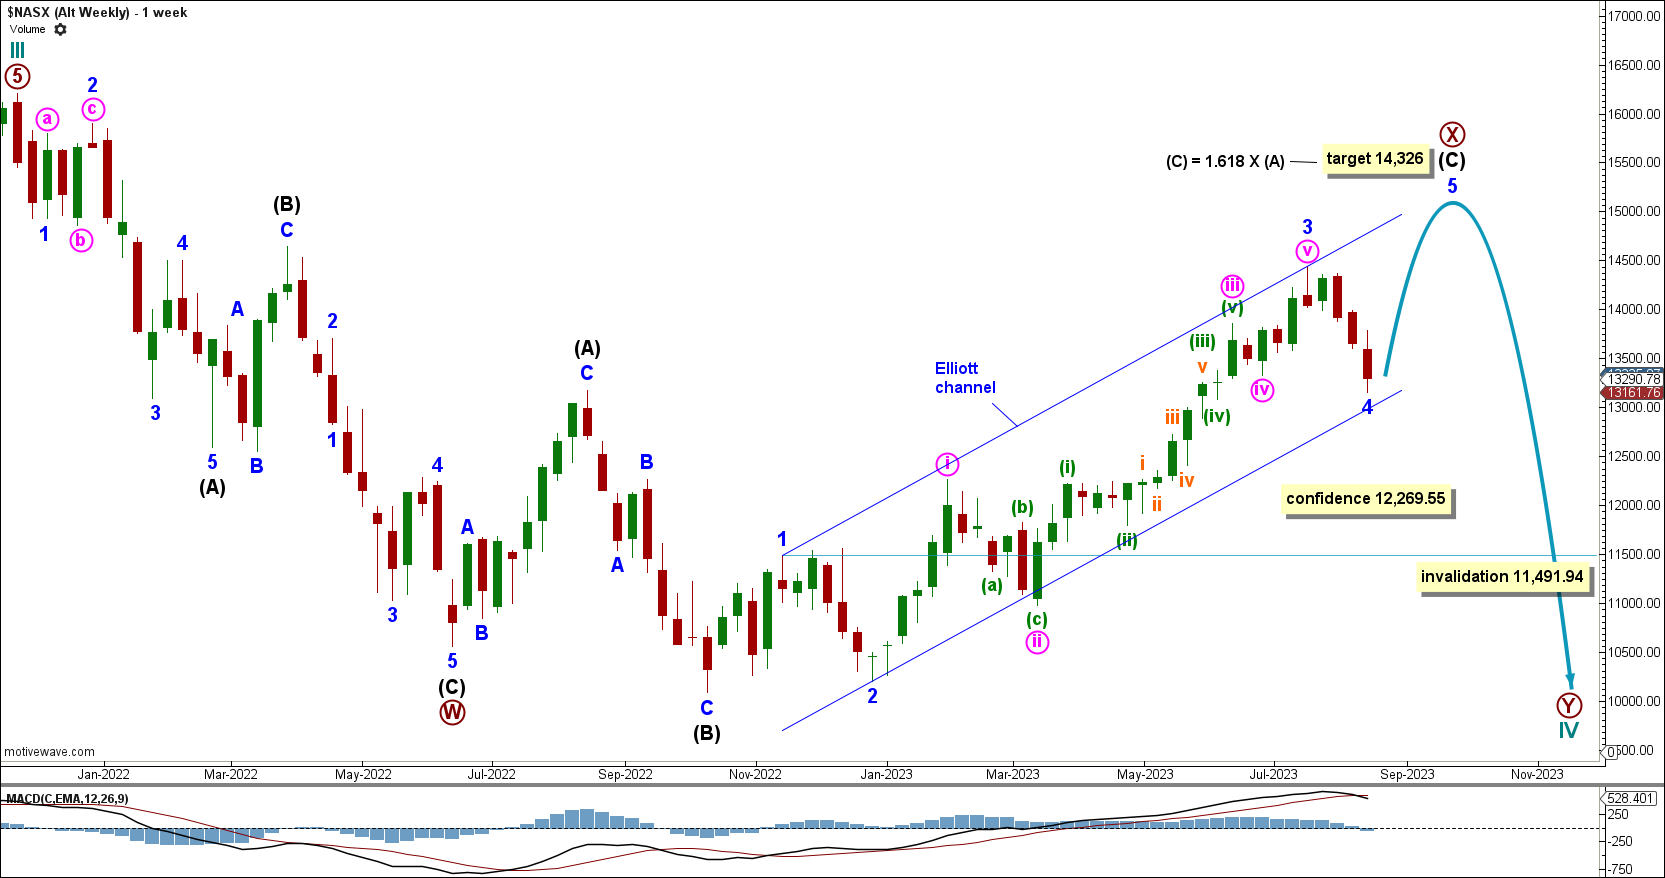
This alternate sees cycle wave IV incomplete and expects the current bullish movement to be a rally within a larger bearish trend. For the long term, price is expected to continue down for the end of primary wave Y and cycle wave IV.
Within intermediate wave (C), minor wave 4 may be complete at the current low, or it may still continue lower, finding strong support at the lower edge of the Elliott channel. If minor wave 4 does move lower and breaks through support, then it cannot move below the end of minor wave 1 at 11,491.94.
The channel is drawn using Elliott’s first technique. Draw a line from the end of minor wave 1 to the end of minor wave 3, with a parallel copy placed on the end of minor wave 2.
Intermediate wave (C) has a target calculated to reach 1.618 times the length of intermediate wave (A) at 14,326.
A low below 12,269.55 will add confidence to this wave count because it is the invalidation of the main wave count.
ALTERNATE DAILY CHART
Click chart to enlarge.
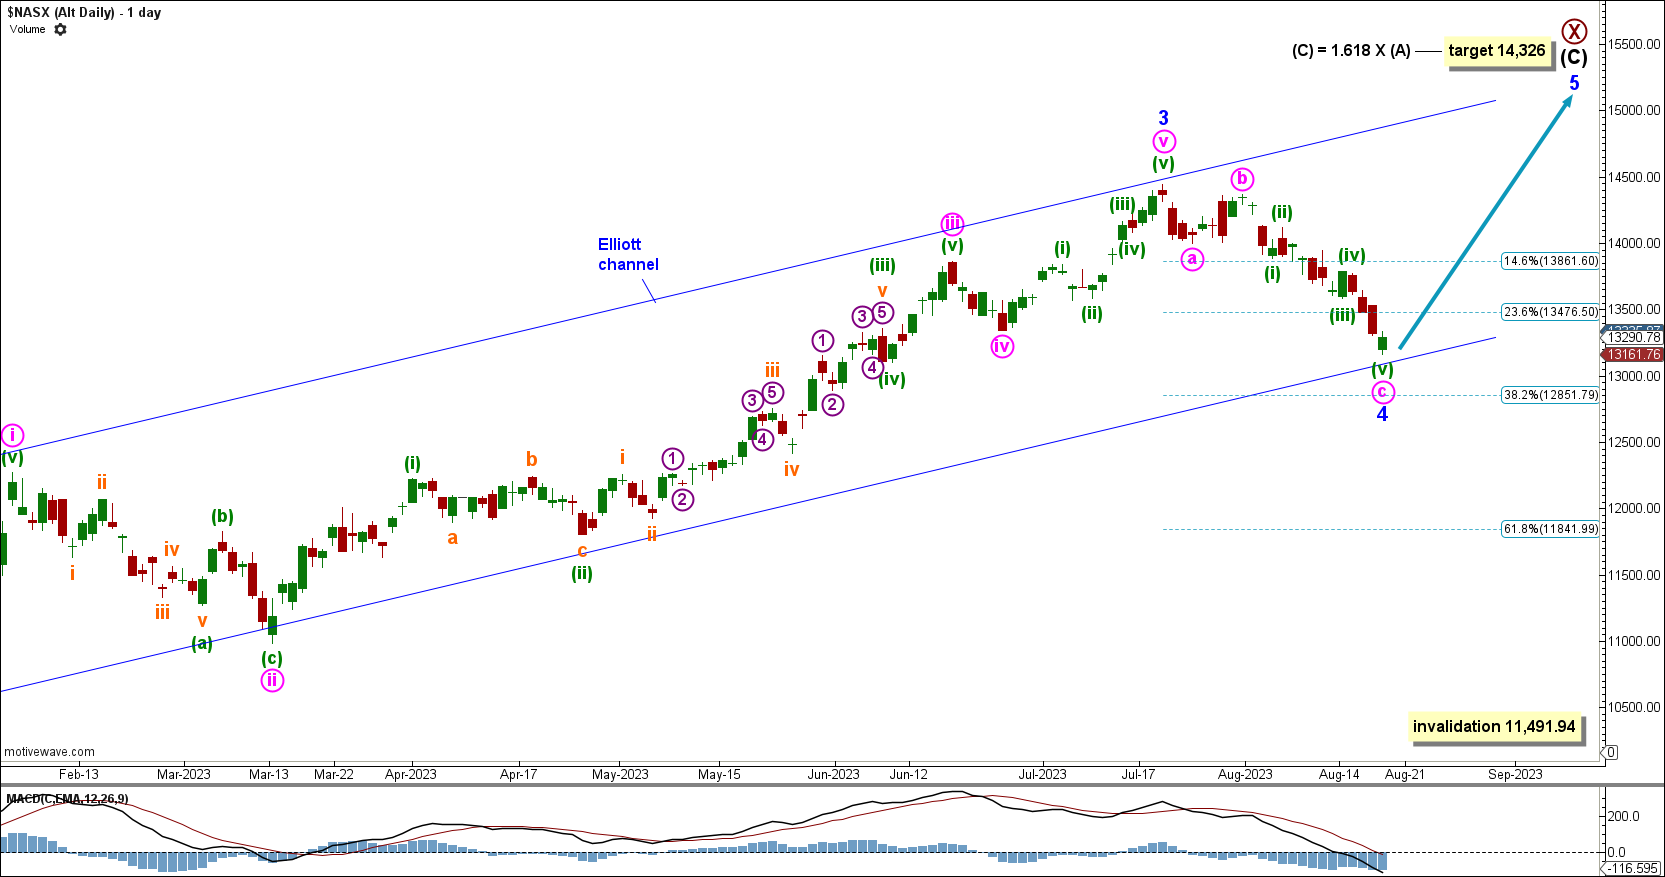
Minor wave 4 is expected to be complete, falling just short of support at the 0.382 Fibonacci ratio of minor wave 3.
If minor wave 4 does move lower, then we will expect support to continue to hold at the lower edge of the Elliott channel.
TECHNICAL ANALYSIS
WEEKLY CHART
Click chart to enlarge.
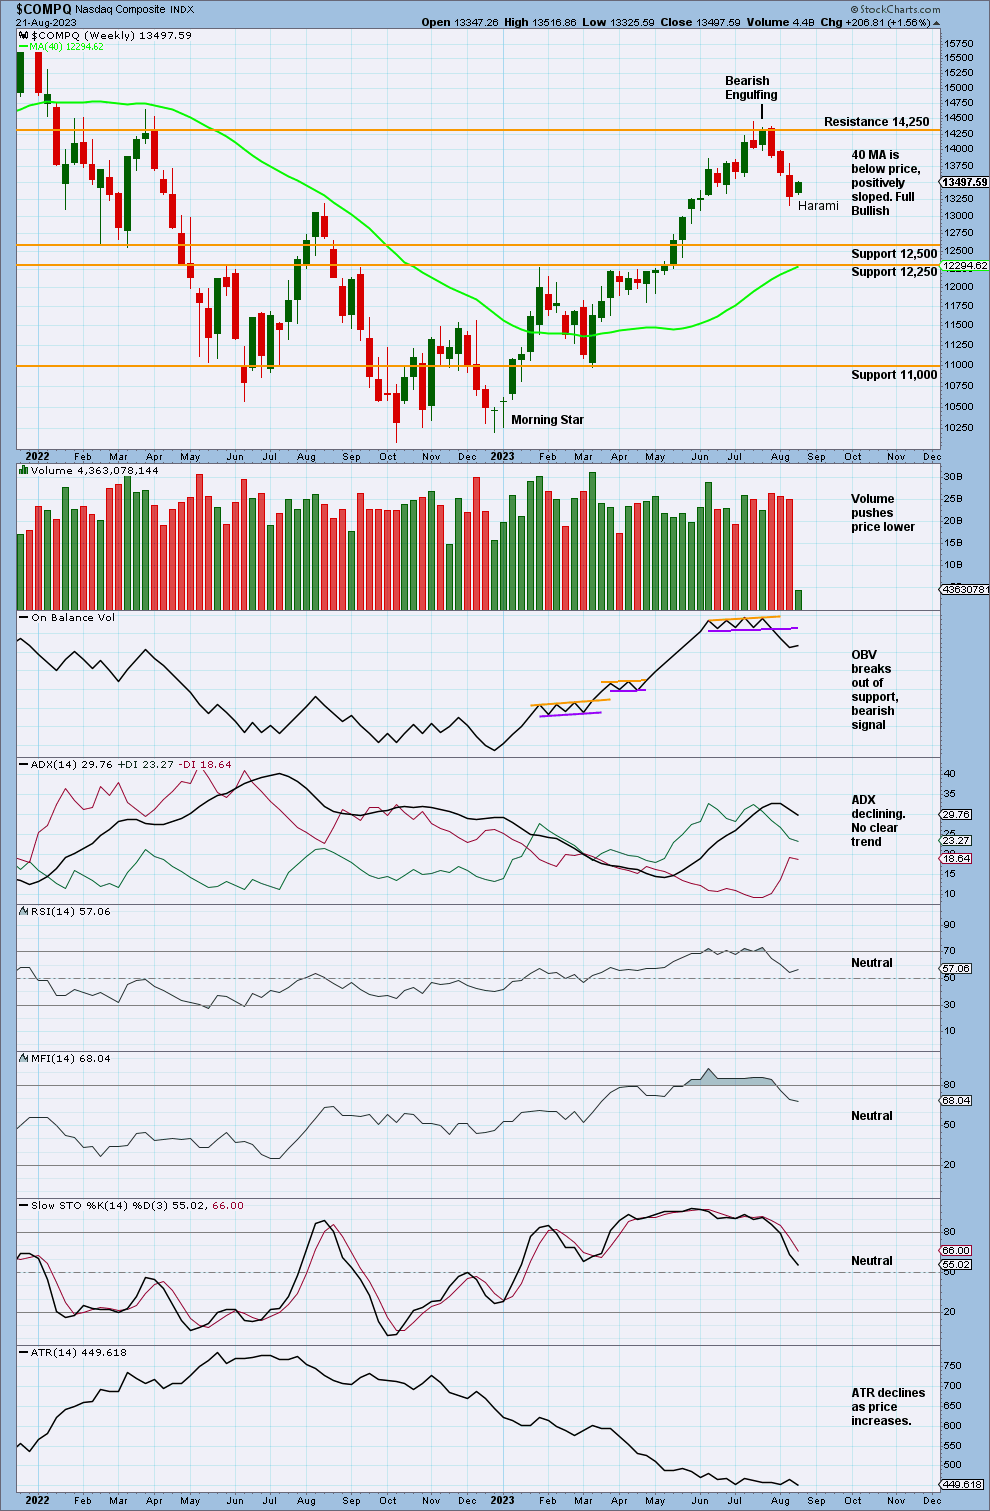
Price ends the week with a Harami pattern, a bullish reversal pattern. The Harami pattern supports the Elliott wave analysis.
DAILY CHART
Click chart to enlarge
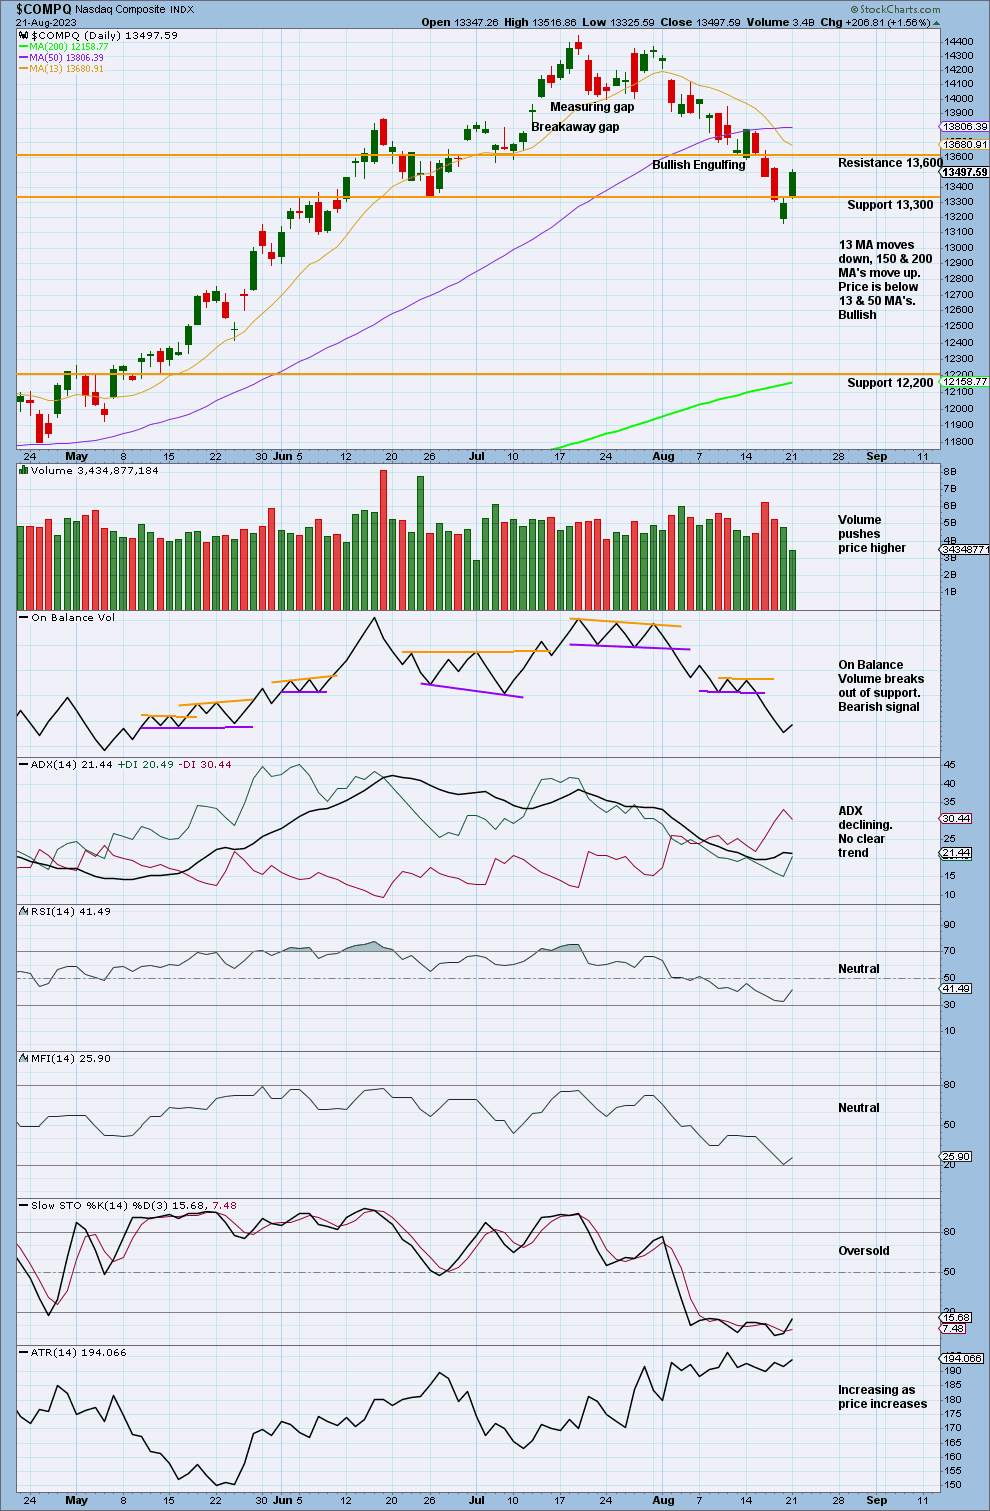
Price has bounced with declining volume around support at 13,300. As the bullish candlesticks have less volume, this indicates weakness and may lead to a shorter or more shallow upwards swing.
ADX is declining and does not indicate any clear trend. Because of this we use a model of Stochastics and support and resistance. As Stochastics is oversold, and price finds support at 13,300, an upwards swing may occur soon.
RSI has reached overbought twice but does not exhibit divergence.
NAAD WEEKLY CHART
Click chart to enlarge
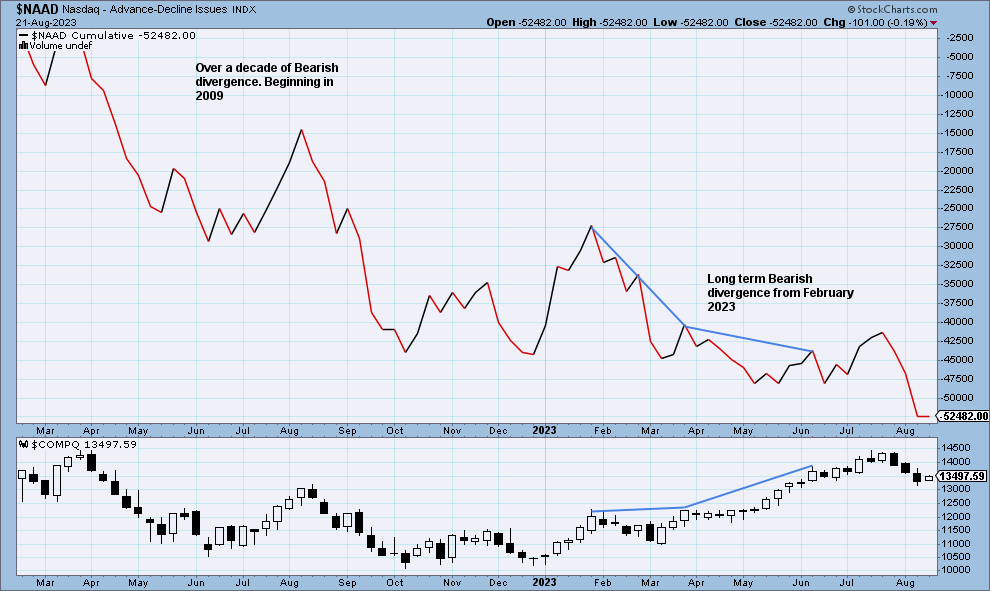
Nasdaq price is making higher highs, but the Nasdaq AD line has made lower highs. This divergence is bearish, and it shows that the rise in price does not have support from rising market breadth.
This divergence is now long term, going back to February 2023. There is also continued bearish divergence dating back over a decade to 2009.
Published @ 10:27 p.m. ET.
—
Careful risk management protects your trading account(s).
Follow my two Golden Rules:
1. Always trade with stops.
2. Risk only 1-5% of equity on any one trade.
—
New updates to this analysis are in bold.
—
 Save as PDF