August 29, 2023: NASDAQ Elliott Wave and Technical Analysis – Video and Charts
Summary: Recent upwards movement adds confidence to the expectation the bullish trend will resume. A mid-term target is 14,941.
Note that the S&P 500 and NASDAQ do not always find highs and lows together. The last all-time high for the S&P 500 was on January 4, 2022, whereas the last all-time high for NASDAQ was November 22, 2021.
Last updated monthly charts are here.
MAIN ELLIOTT WAVE COUNT
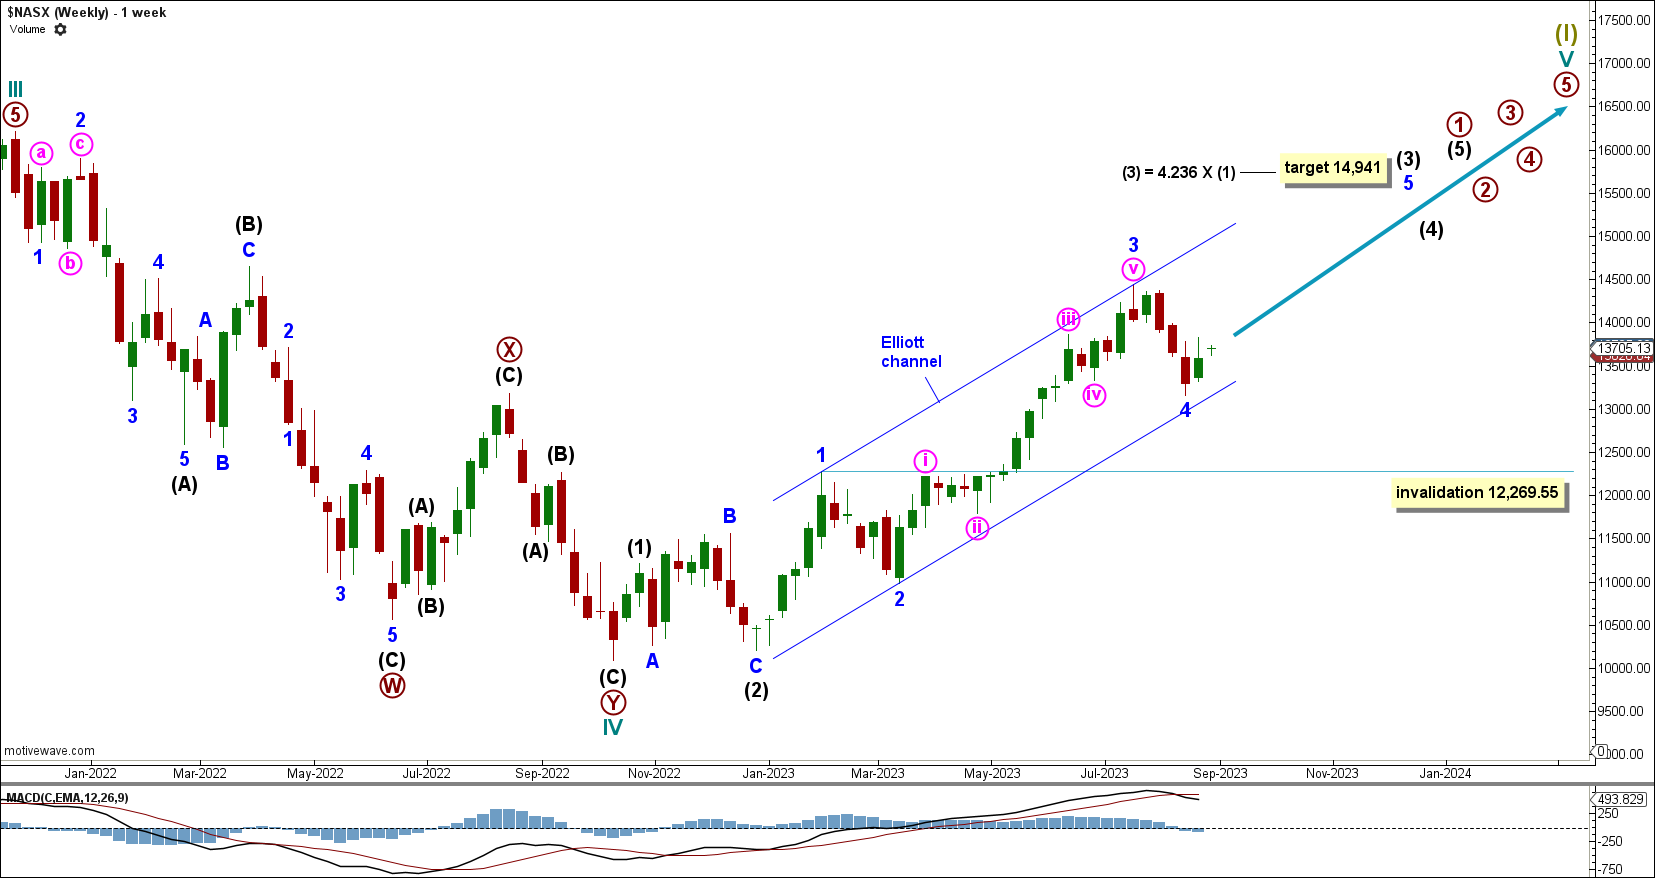
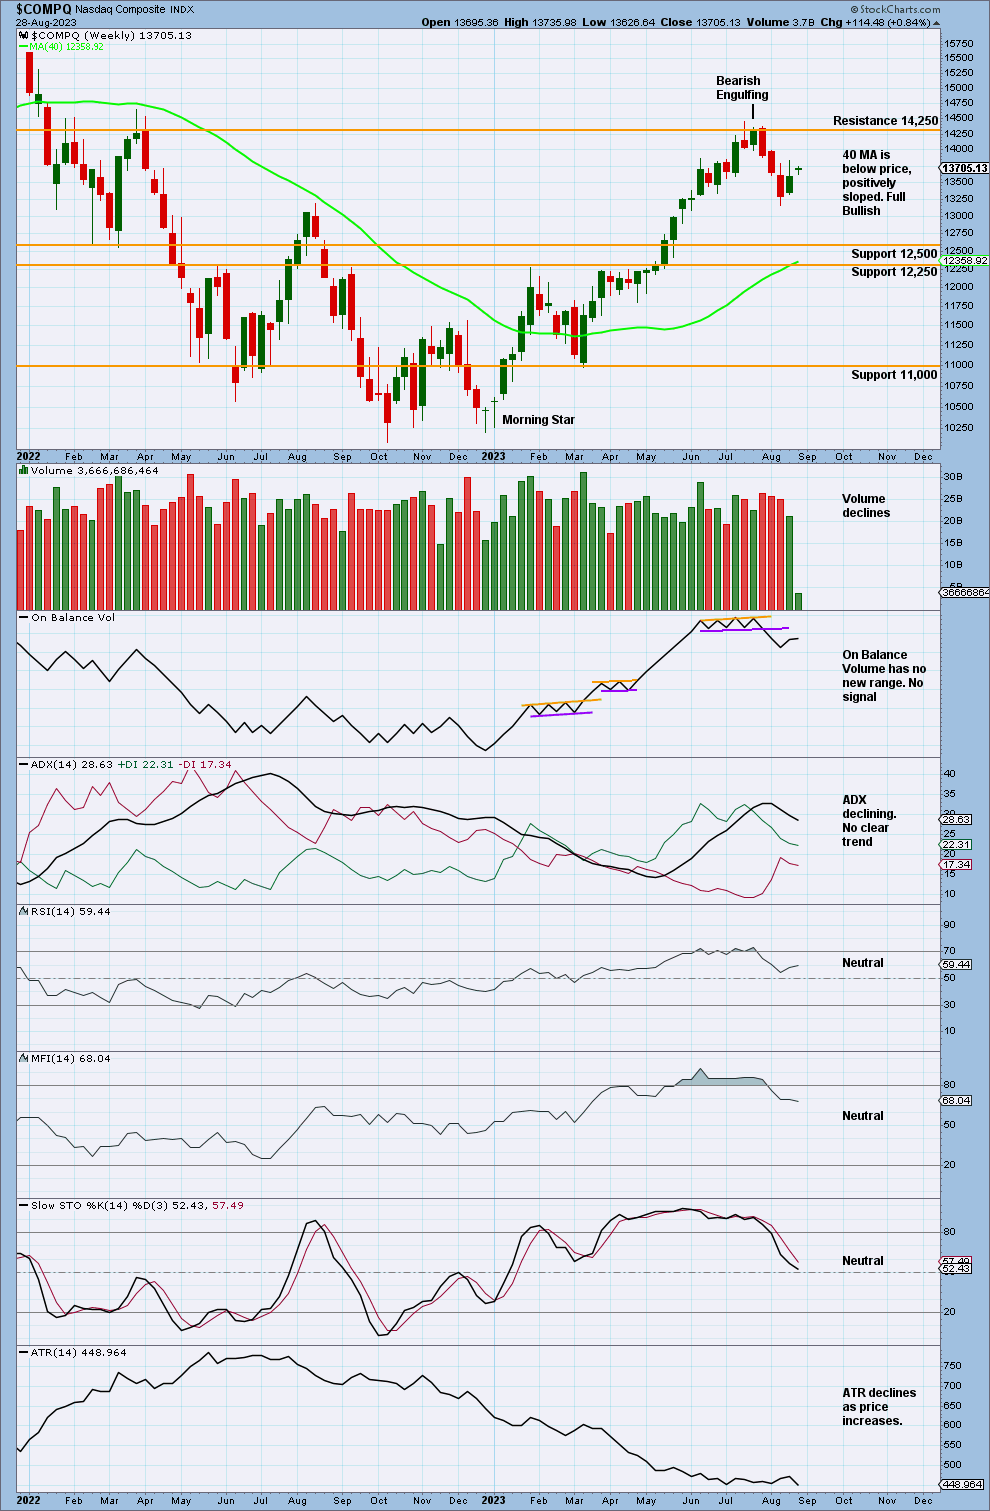
WEEKLY CHART
Click chart to enlarge.
Because the daily Elliott wave count has minor wave 4 labelled as a complete zigzag and also the recent increases in price, the low for minor wave 4 is expected to be sustained. However, if minor wave 4 does move lower and breaks through support, then it cannot move below the end of minor wave 1 at 12,269.55.
An Elliott channel is drawn using Elliott’s first technique. Draw a line from the end of minor wave 1 to the end of minor wave 3, with a parallel copy placed on the end of minor wave 2.
Intermediate wave (3) has a target calculated at 14,941, which is 4.236 times the length of intermediate wave (1).
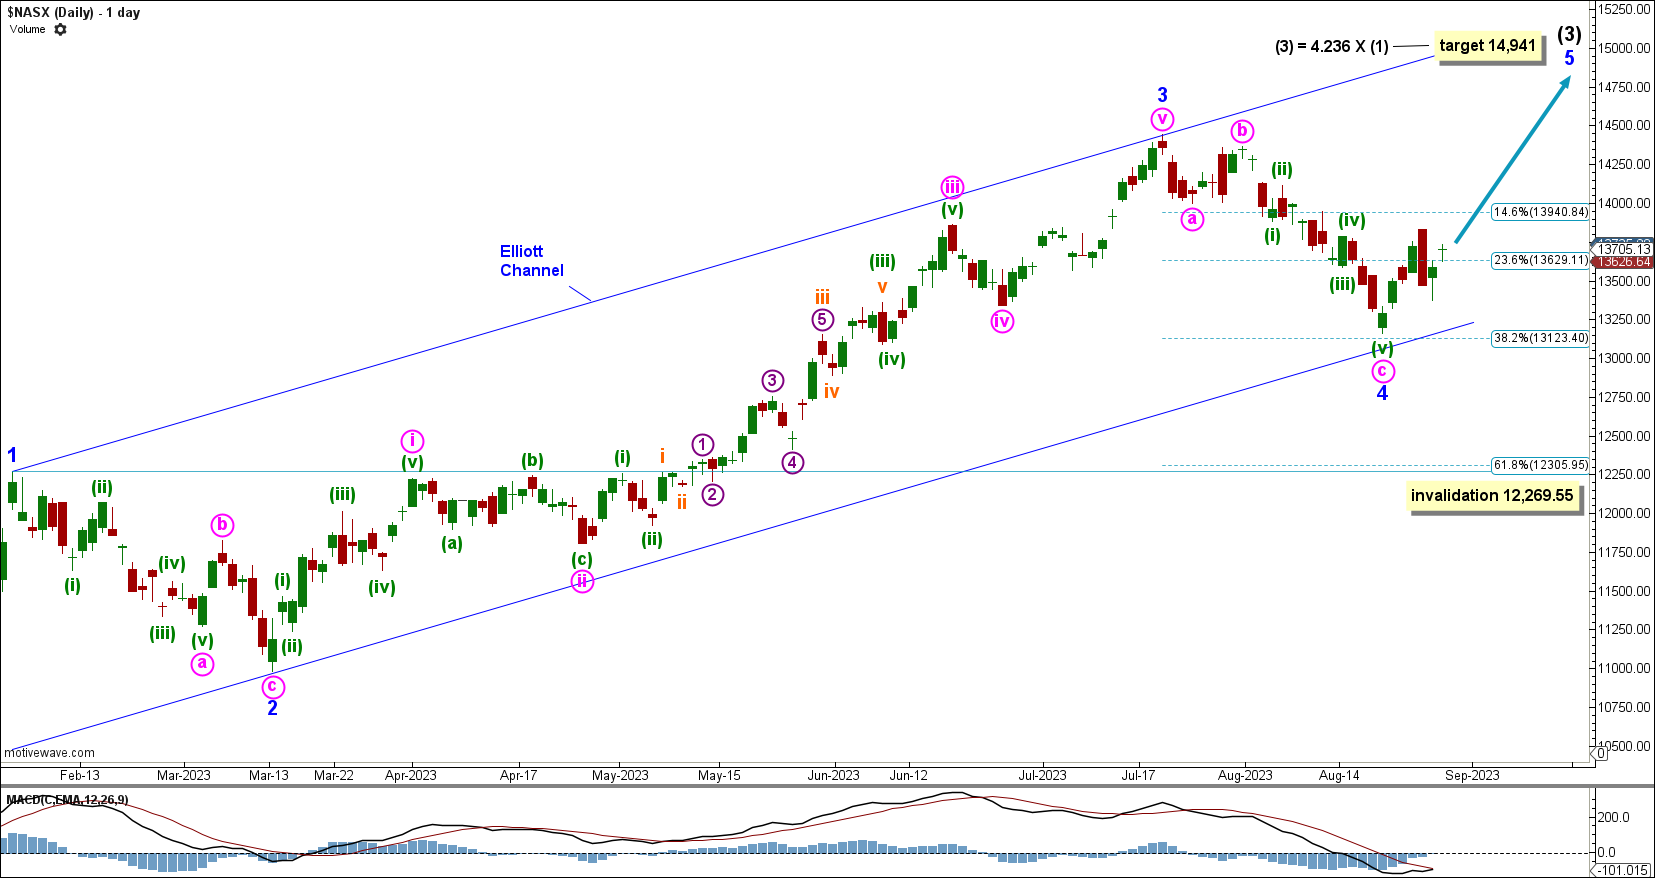
DAILY CHART
Click chart to enlarge.
Minor wave 4 found support near the lower edge of the Elliott channel and subdivides well as a complete zigzag with an extended minute wave c.
While both minor waves 2 and 4 are zigzags, there is some alternation between them. Minor wave 2 has an extended minute wave a and a short minute wave c, whereas minor wave 4 has a short minute wave a and an extended minute wave c.
Minor wave 5 is expected to move beyond the end of minor wave 3 in order to avoid a truncation.
ALTERNATE ELLIOTT WAVE COUNT
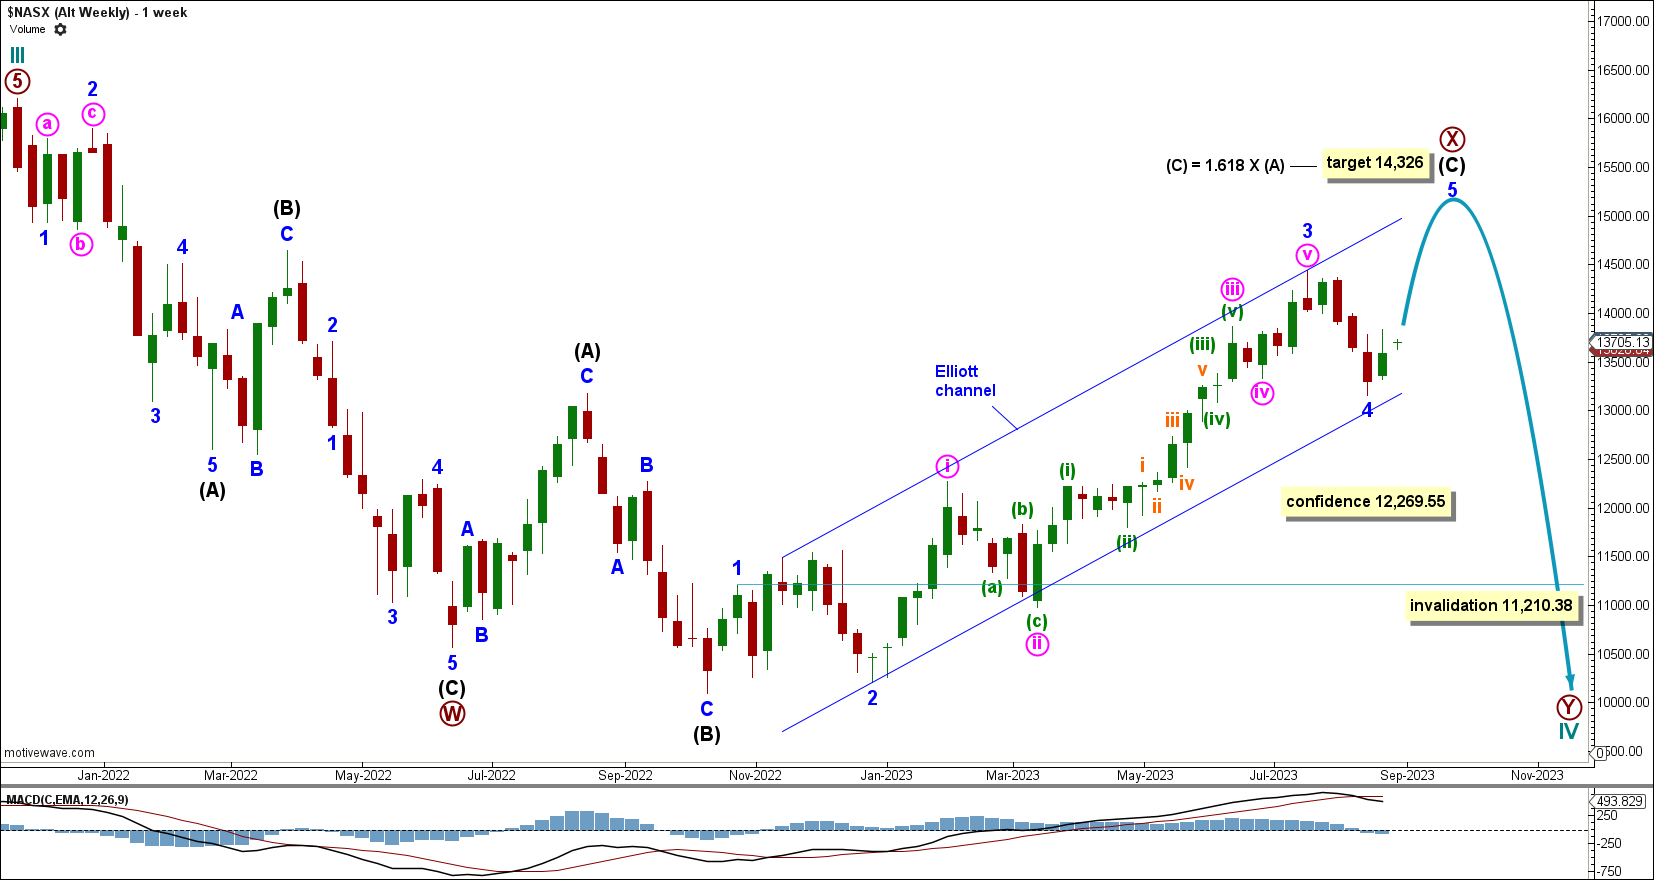
ALTERNATE WEEKLY CHART
Click chart to enlarge.
This alternate sees cycle wave IV incomplete and expects the current bullish movement to be a rally within a larger bearish trend. For the long term, price is expected to continue down for the end of primary wave Y and cycle wave IV.
Within intermediate wave (C), minor wave 4 may be complete at the current low, or it may continue lower, finding strong support right at the lower edge of the Elliott channel. If minor wave 4 does move lower and breaks through support, then it cannot move into minor wave 1 price territory below 11,210.38.
The channel is drawn using Elliott’s first technique. Draw a line from the end of minor wave 1 to the end of minor wave 3, with a parallel copy placed on the end of minor wave 2.
Intermediate wave (C) has a target calculated to reach 1.618 times the length of intermediate wave (A) at 14,326.
A low below 12,269.55 will add confidence to this wave count because it is the invalidation of the main wave count.
ALTERNATE DAILY CHART
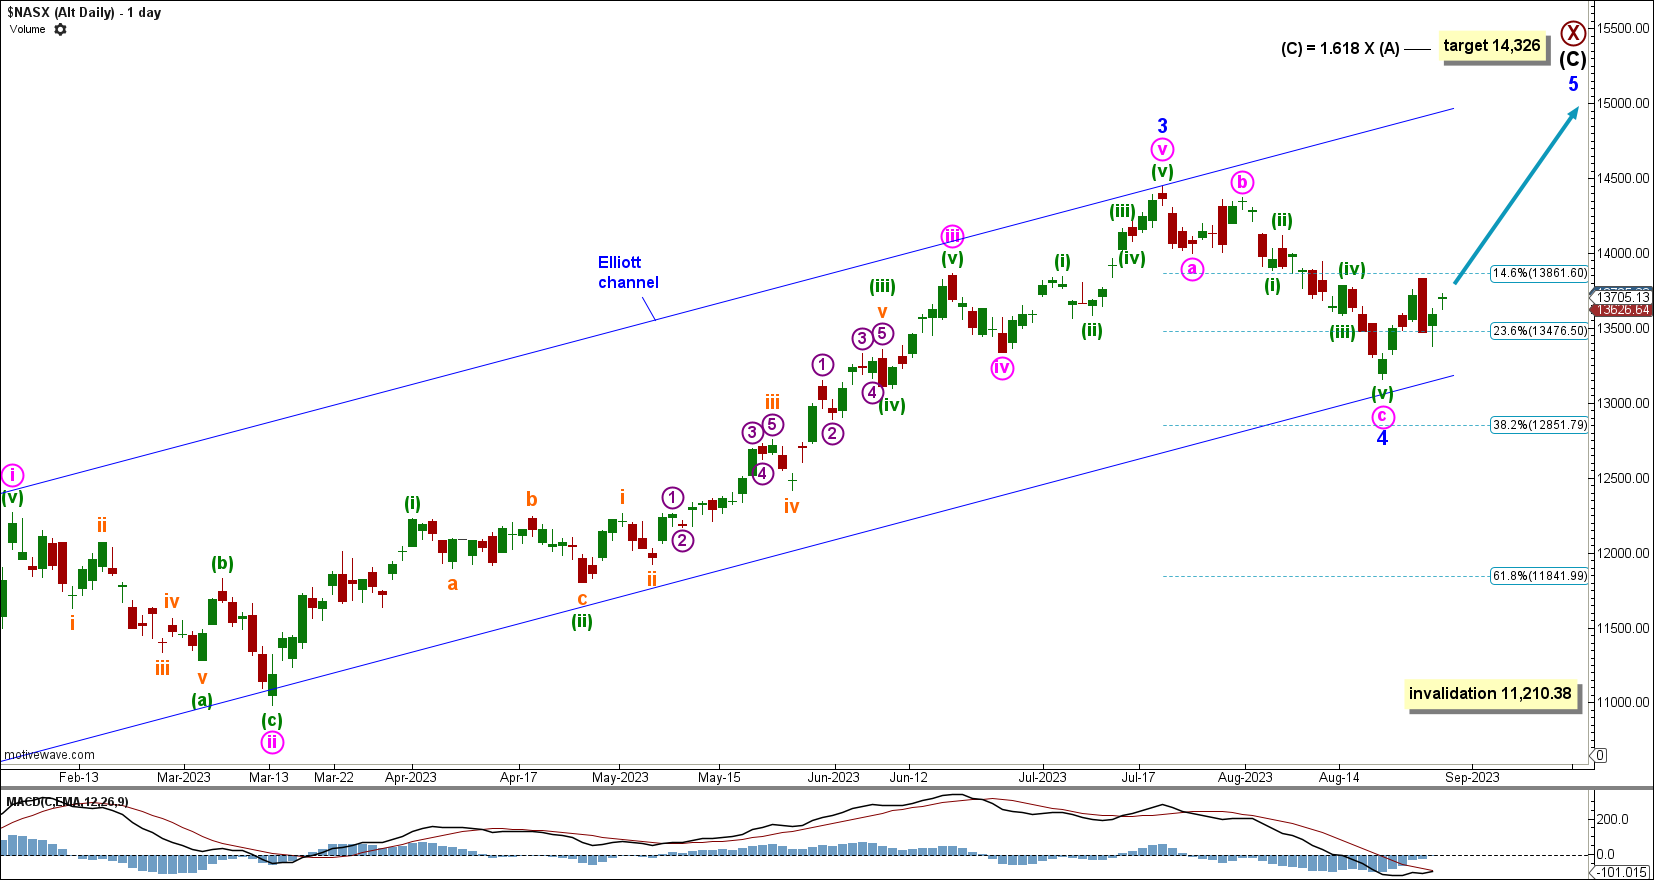
Click chart to enlarge.
Minor wave 4 is expected to be complete, finding support near the lower edge of the Elliott channel. If minor wave 4 does move lower, then we will expect support to continue to hold at the lower edge of the Elliott channel.
Minor wave 5 is expected to move beyond the end of minor wave 3 in order to avoid a truncation.
TECHNICAL ANALYSIS
WEEKLY CHART
Click chart to enlarge.
Price increases with declining volume, signifying weakness. However, volume has declined over a long period, while price still rises. In current market conditions a decline in volume with rising price does not mean the rise in price may not be sustained.
DAILY CHART
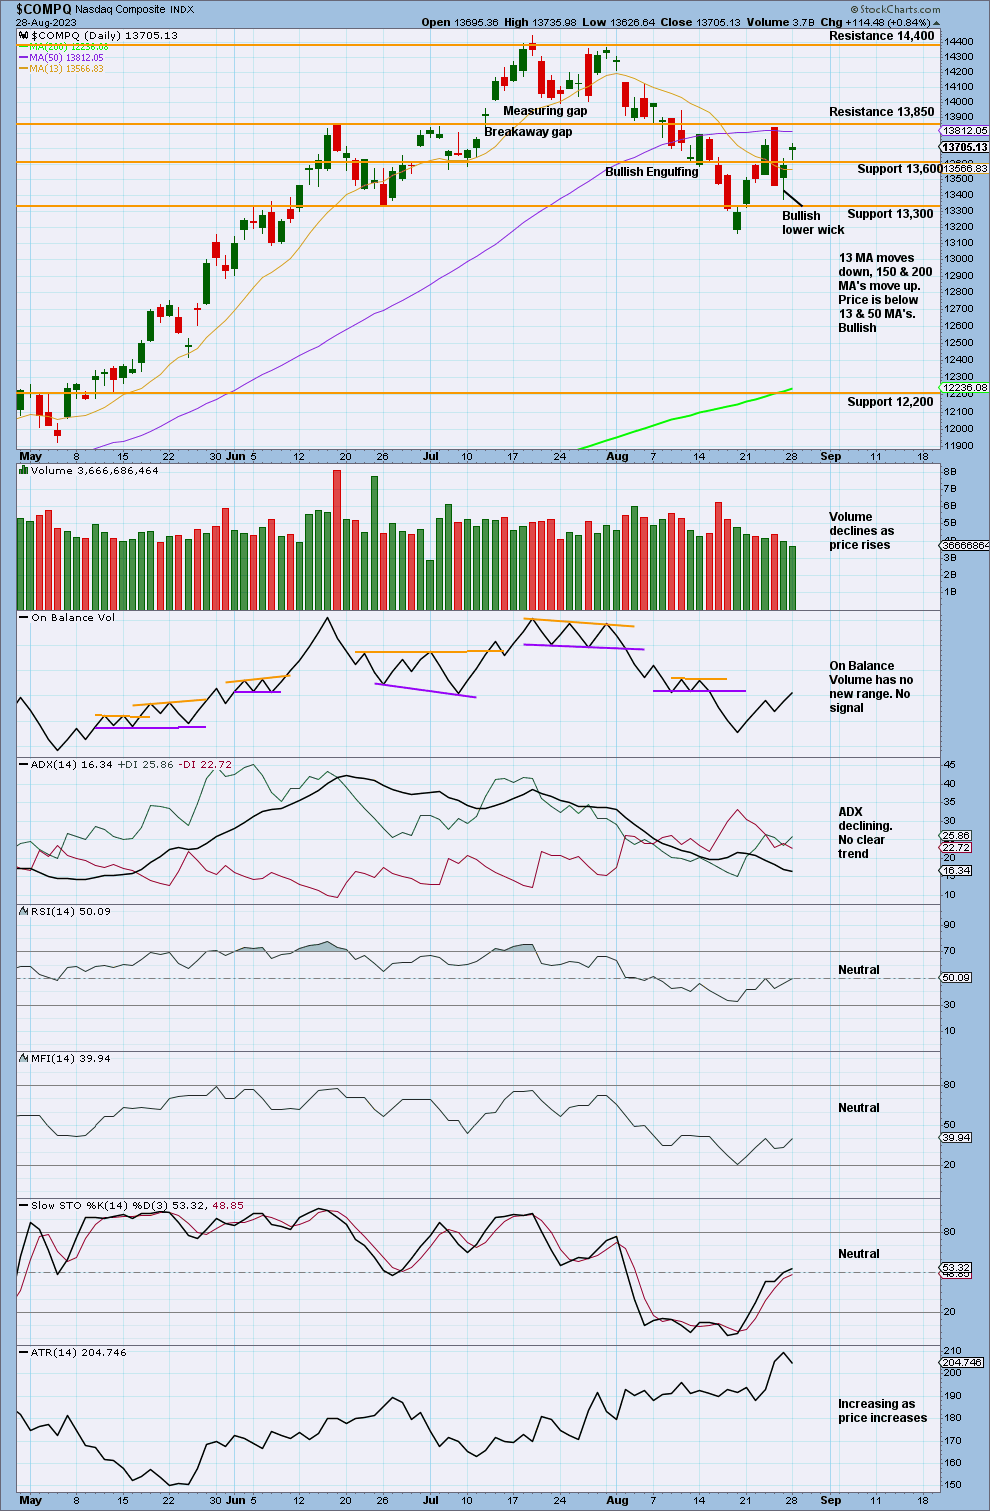
Click chart to enlarge
Price moves above support at 13,600 with declining volume.
Both DX lines in ADX whipsaw, which is standard movement during a consolidation.
An upwards swing may occur, towards resistance at 14,400.
A V bottom may have formed, a common look at lows for this market.
NAAD WEEKLY CHART
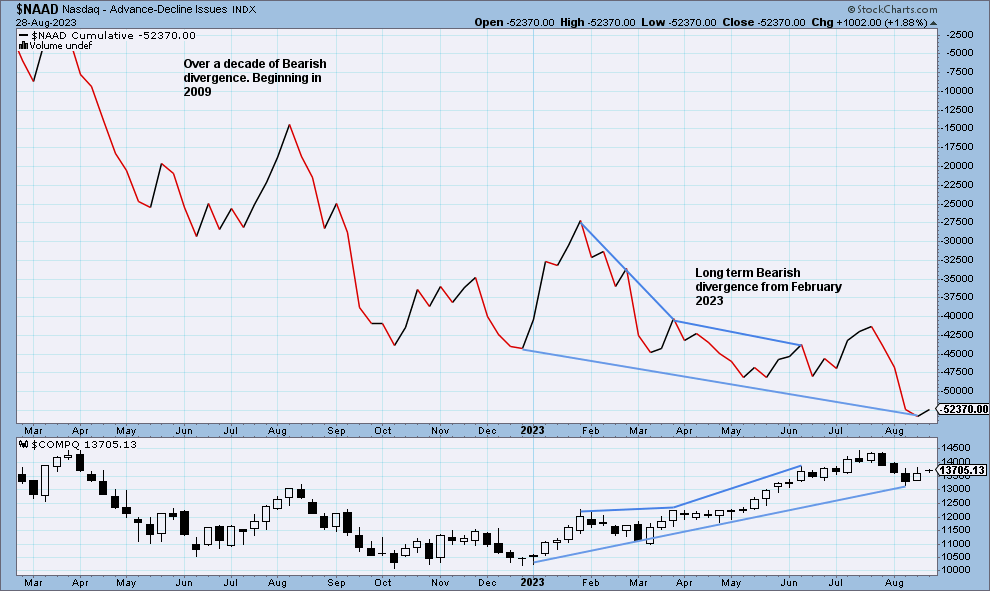
Click chart to enlarge
Nasdaq price is making higher highs, but the Nasdaq AD line has made lower highs. This divergence is bearish, and it shows that the rise in price does not have support from rising market breadth.
Nasdaq AD line is making new lows while price makes higher lows. This bearish divergence continues back to 2009.
Published @ 12:07 p.m. ET.
—
Careful risk management protects your trading account(s).
Follow my two Golden Rules:
1. Always trade with stops.
2. Risk only 1-5% of equity on any one trade.
—
New updates to this analysis are in bold.
—
 Save as PDF