August 31, 2023: Natural Gas Elliott Wave and Technical Analysis – Video and Charts
Summary: Price continues to increase as the Elliott wave count expects.
Monthly charts are updated here
ELLIOTT WAVE COUNT
WEEKLY
Click chart to enlarge.
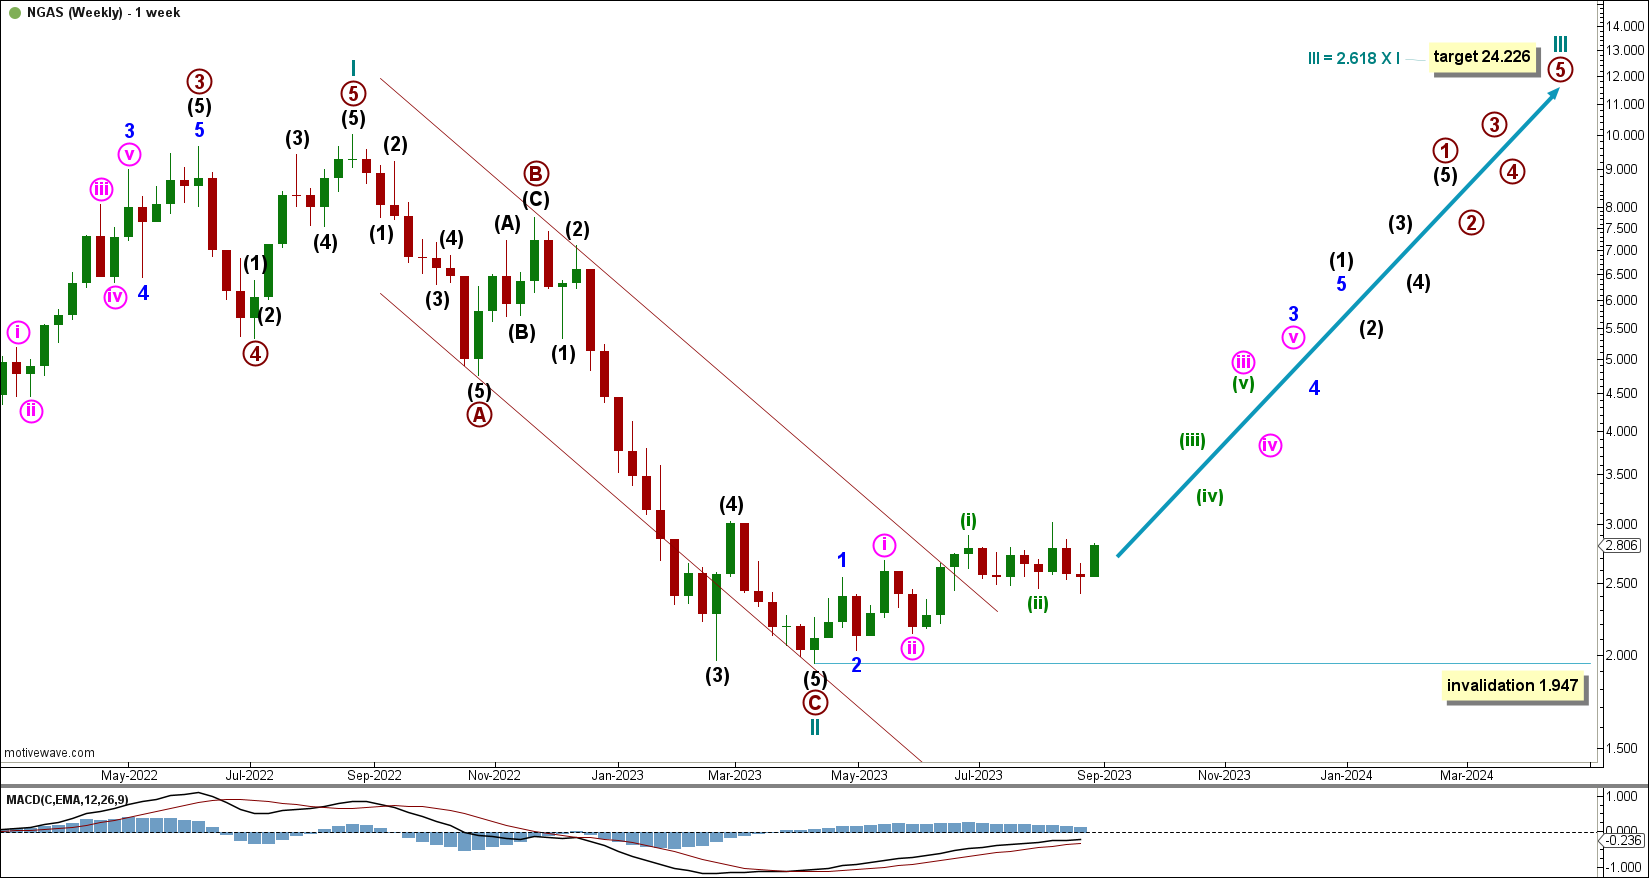
Price has broken out of the Elliott channel drawn around cycle wave II, and has since moved higher. This sees the last low for cycle wave II likely to be sustained.
A second wave corrective movement within cycle wave III cannot move below 1.947.
Cycle wave III may be moving up with increasing momentum and overlapping first and second waves at minuette, minute, and minor degrees.
Cycle wave III has a target calculated to reach 2.618 times the length of cycle wave I at 24.226.
DAILY
Click chart to enlarge.
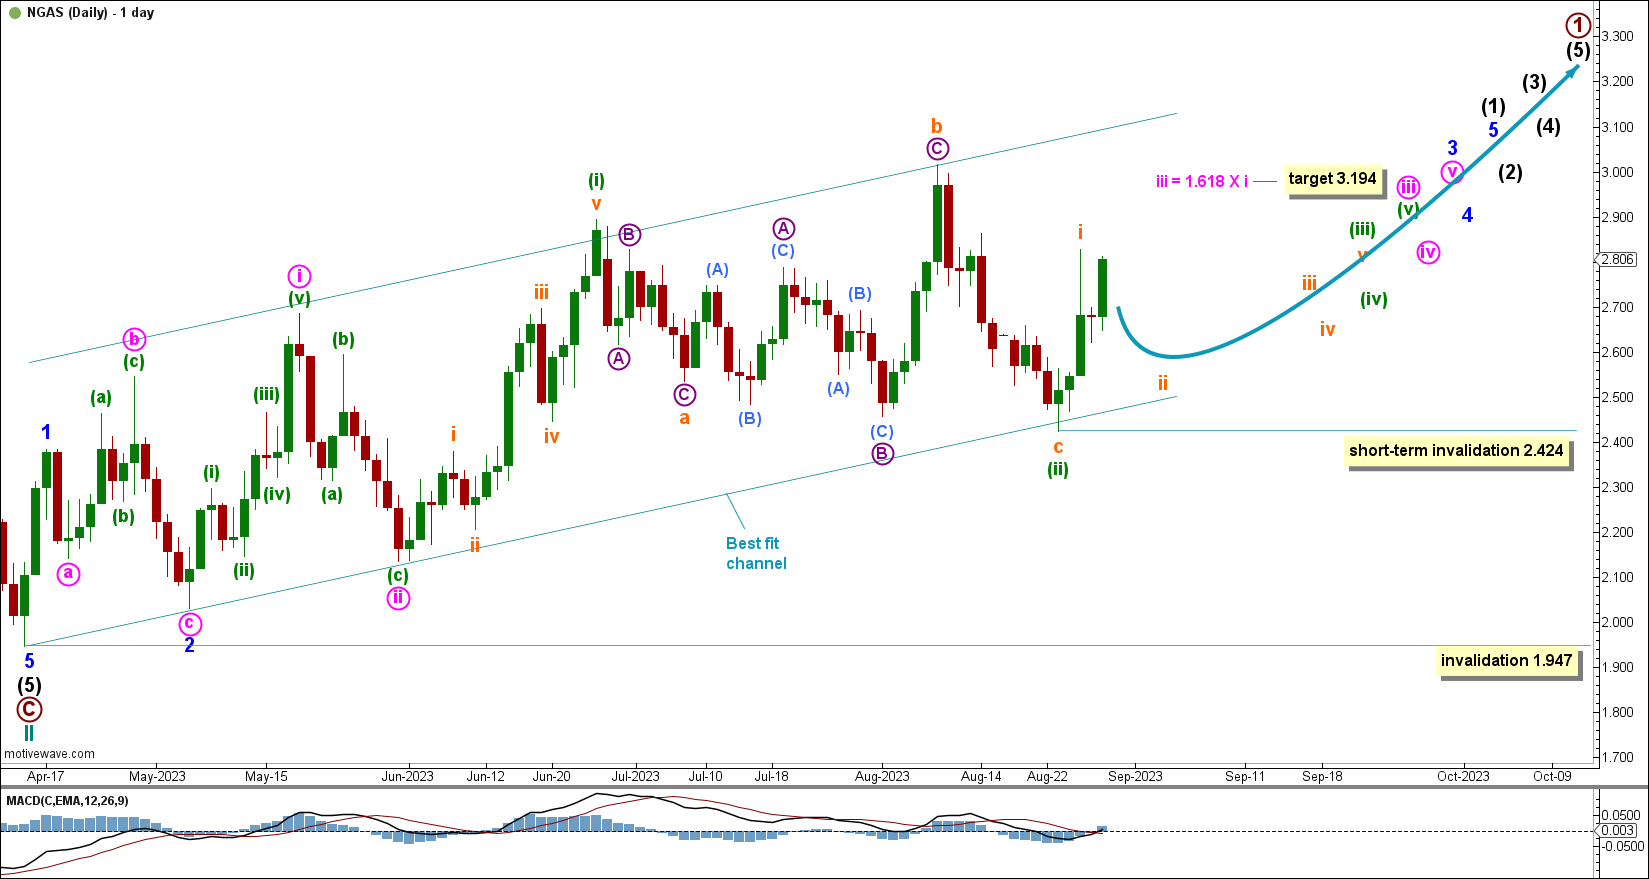
Within primary wave 1, intermediate wave (1) is incomplete.
Within intermediate wave (1): Minor waves 1 and 2 may be complete and, within minor wave 3, minute waves i and ii may be complete. This wave count now expects overlapping third waves to push price higher with increased momentum.
Within minute wave iii of minor wave 3, minuette waves (i) and (ii) may be complete.
Within minuette wave (iii), subminuette wave ii is expected to pull price lower.
Subminuette wave ii may find support at the lower edge of the best fit channel.
A second wave corrective movement within minuette wave (iii) cannot move below 2.424.
When intermediate wave (2) arrives, it may not move beyond the start of intermediate wave (1) at 1.947.
At 3.194 minute wave iii would reach 1.618 the length of minute wave i.
DAILY ALTERNATE
Click chart to enlarge.
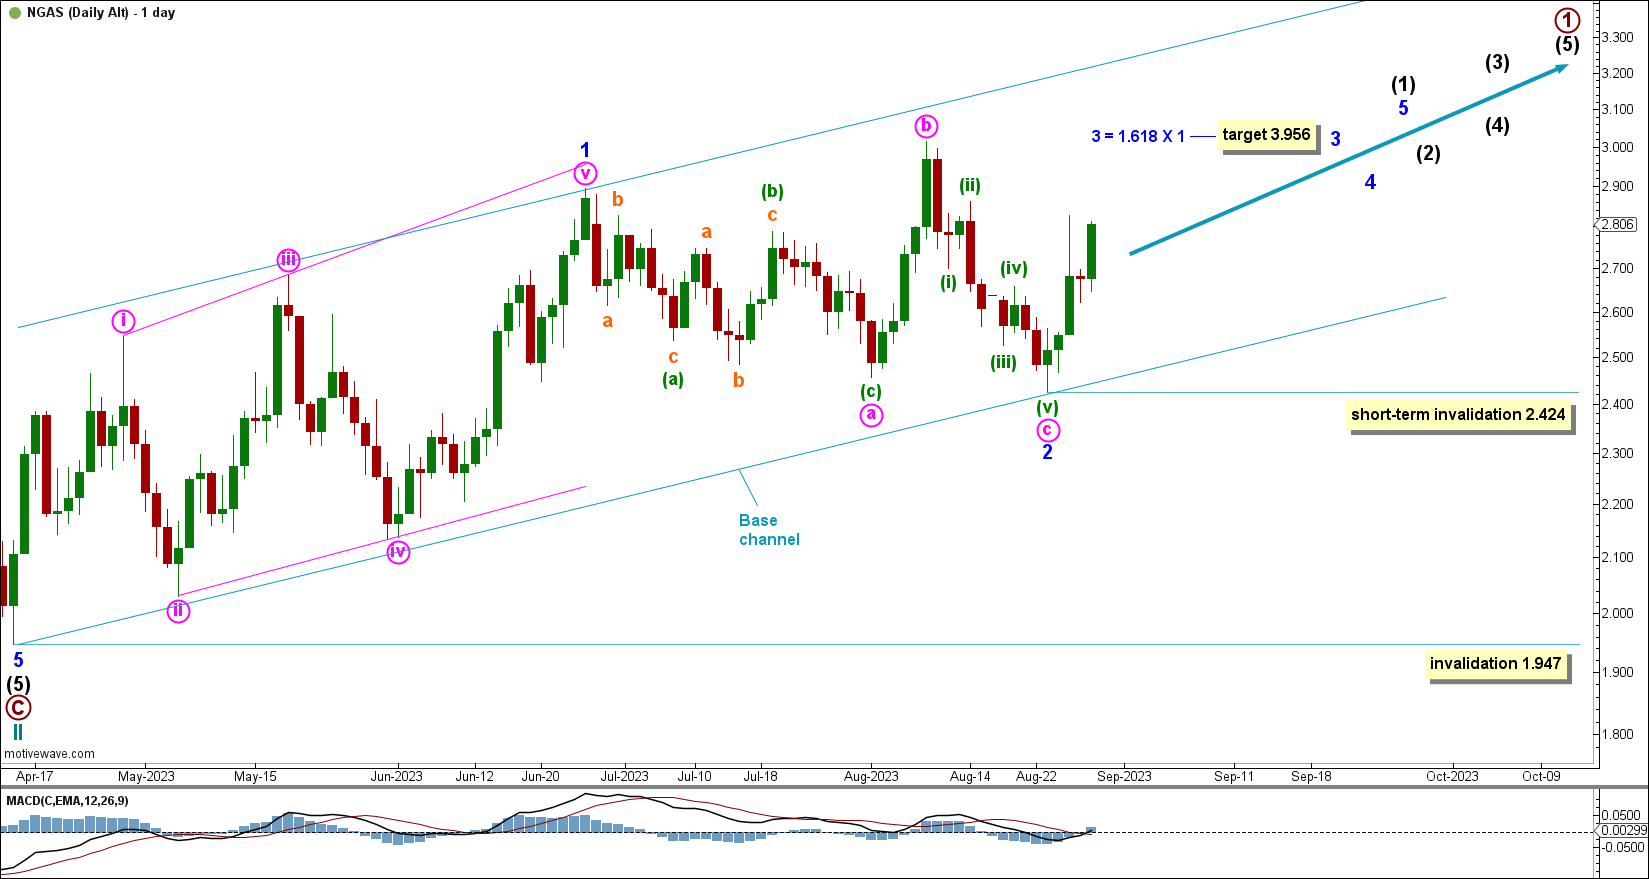
This alternate sees minor wave 2 over at the low on August 23rd.
Minor wave 1 may be over at the high on June 26th. Minor wave 1 subdivides as a leading expanding diagonal.
A base channel is drawn around minor degree waves 1 and 2. Draw a line from the beginning of minor wave 1 to the end of minor wave 2, then place a parallel copy on the end of minor wave 1. Minor wave 3 is expected to break out of this channel.
When a breakout occurs, there will be confirmation in minor wave 3 being underway.
Within minor wave 3, a second wave corrective movement cannot move below 2.424.
Minor wave 3 has a target calculated at 3.956, the 1.618 Fibonacci ratio for minor wave 1.
TECHNICAL ANALYSIS
WEEKLY
Click chart to enlarge.
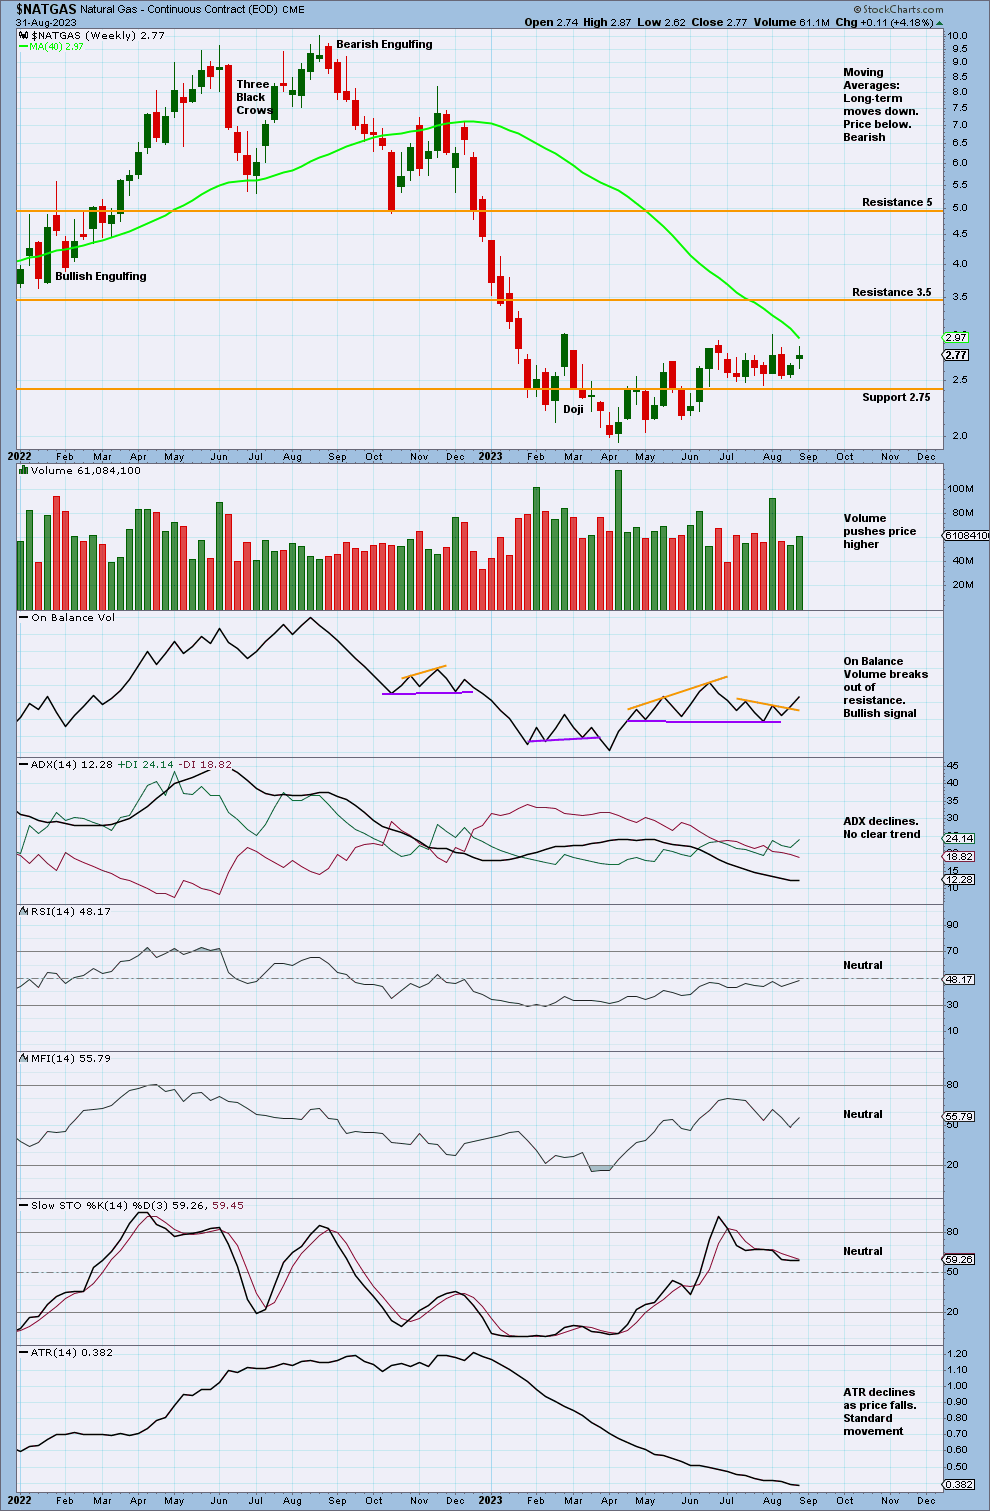
Price moves up away from support at 2.75.
The volume profile is bullish, with stronger volume on green candlesticks.
On Balance Volume has broken out of resistance, giving a bullish signal. This, coupled with the volume profile, supports the Elliott wave count.
DAILY
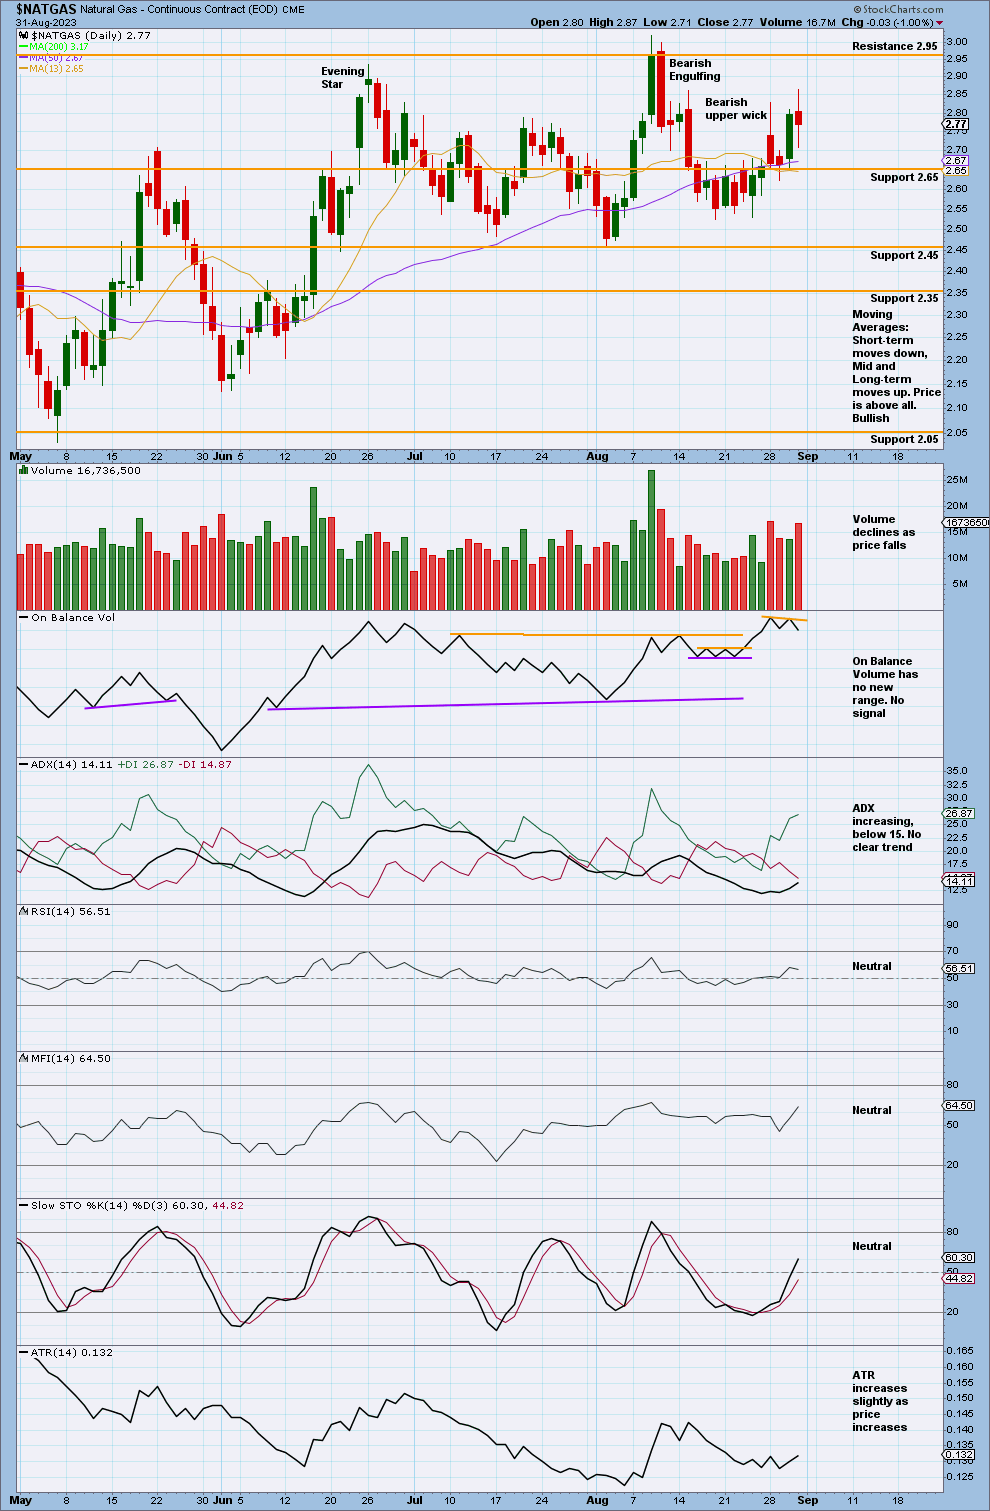
Click chart to enlarge.
Price increases away from support at 2.65.
Volume is overall declining, with a push on some red candlesticks.
ADX is increasing though below 15, so there is no clear trend. We use the model of Stochastics and support and resistance. This model expects an upwards swing towards resistance at 2.95.
Published @ 07:22 p.m. ET.
—
Careful risk management protects your investments.
Follow my two Golden Rules:
1. Invest only funds you can afford to lose.
2. Have an exit plan for both directions – where or when to take profit, and when to exit a losing investment.
 Save as PDF