October 5, 2023: SILVER Elliott Wave and Technical Analysis – Video and Charts
Summary: Price declines with increasing range and momentum, as the main Elliott wave count expects.
Monthly charts are updated here.
BEARISH ELLIOTT WAVE COUNT
WEEKLY CHART
Click chart to enlarge.
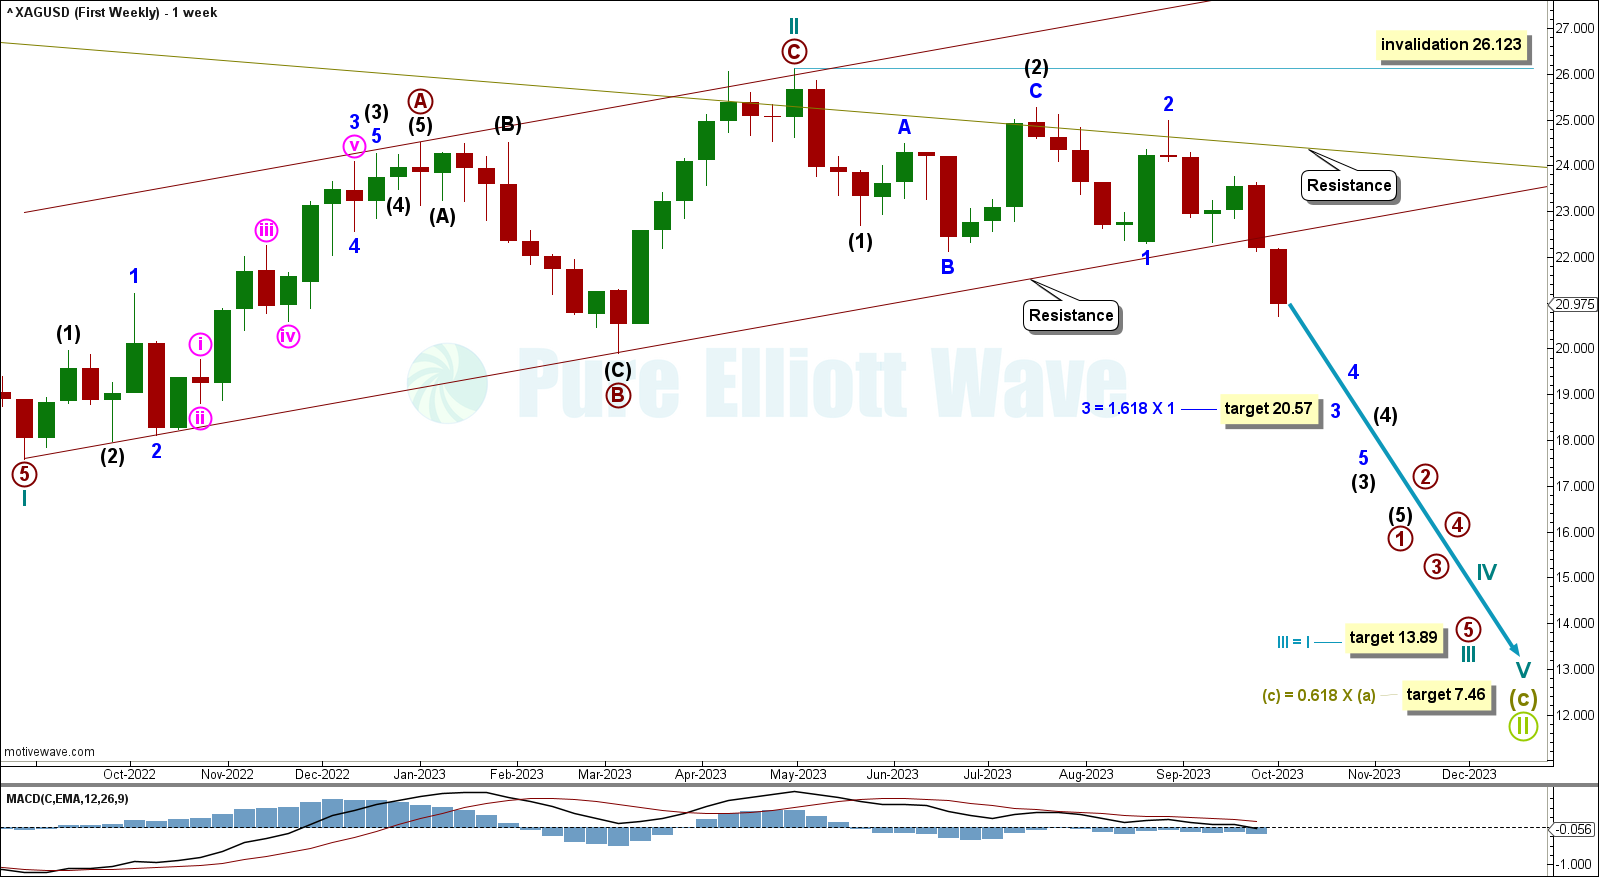
There are two possible structures that Supercycle wave (c) may subdivide as, an impulse (more likely) or an ending diagonal (less likely). An impulse requires cycle wave I to subdivide as a five wave motive structure. Cycle wave I fits well as an impulse, which indicates Supercycle wave (c) would most likely be subdividing as an impulse.
Within the impulse, cycle waves I and II may be complete, with price now moving down for cycle wave III.
Cycle wave III is expected to be in its third intermediate wave of its first primary wave. Intermediate waves (1) and (2) may be complete. It is possible that intermediate wave (2) continues higher, though it cannot move above the start of intermediate wave (1) at 26.123.
Price has broken out of the Elliott channel drawn around primary movements within cycle wave II. This adds confidence to this wave count, expecting cycle wave III to pull price lower.
Price may now find resistance at the upper edge of the Elliott channel drawn around cycle wave II.
Price is now expected to move lower for third waves at minor, intermediate, and cycle degrees. Overlapping third waves at these degrees should be unmistakable and should come with increasing range and momentum.
Minor wave 3 has a target calculated to reach 20.57, the 1.618 Fibonacci ratio of minor wave 1.
Cycle wave III has a target calculated at 13.89, which is equality in length with cycle wave I.
Supercycle wave (c) has a target calculated at 7.46, the 0.618 Fibonacci ratio of Supercycle wave (a).
DAILY CHART
Click chart to enlarge.
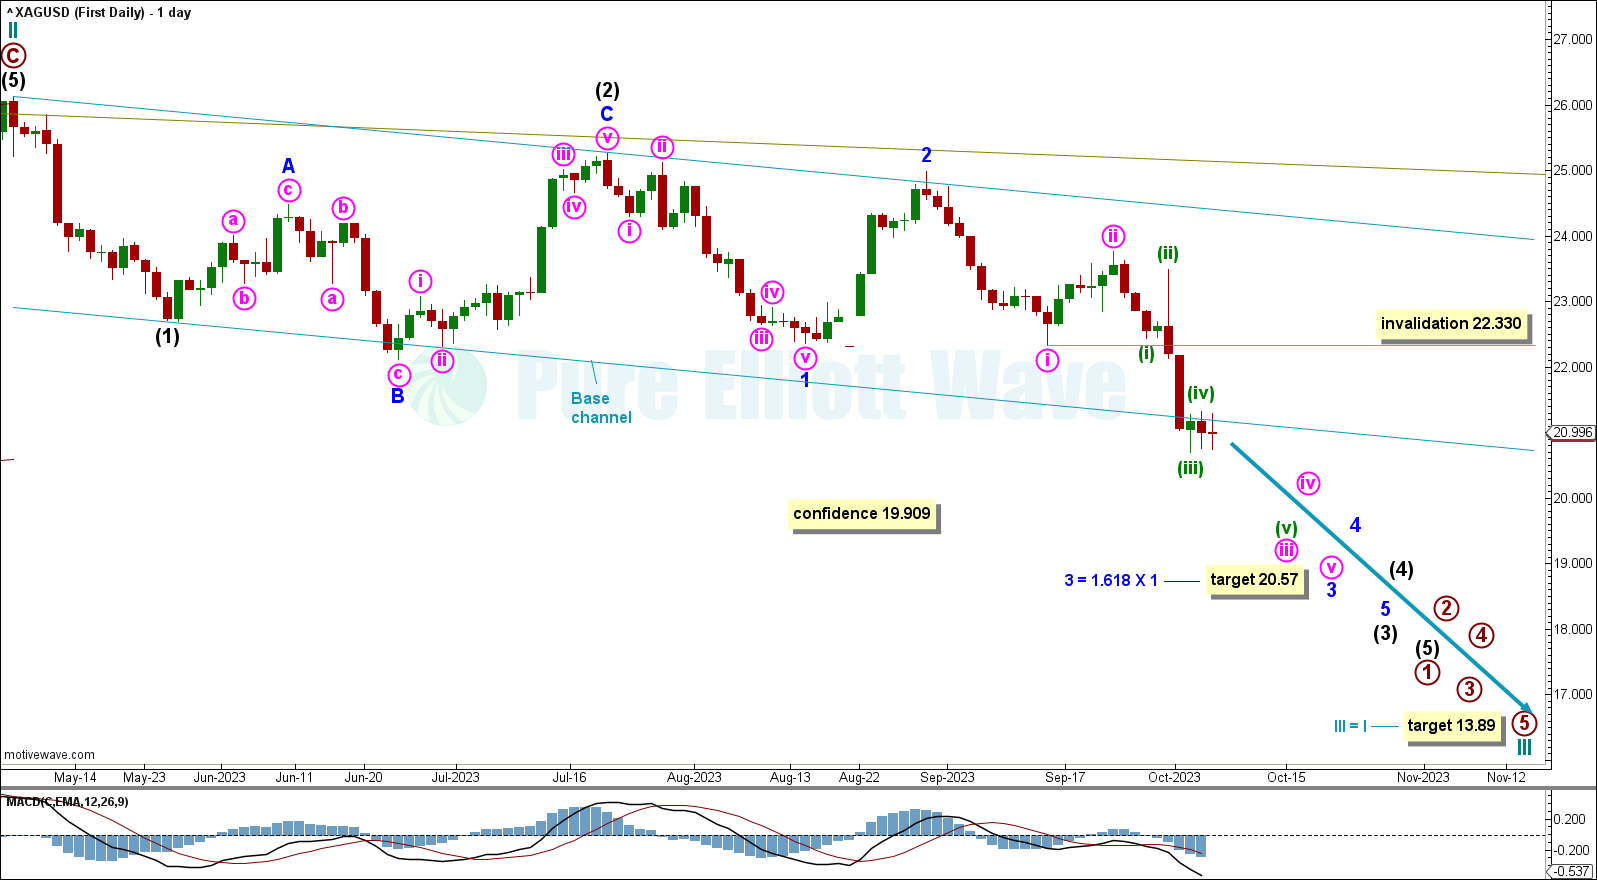
Cycle wave III has to unfold as an impulse.
Within primary wave 1: Intermediate waves (1) and (2) may be complete and intermediate wave (3) must move lower and can only subdivide as an impulse.
Within intermediate wave (3): Minor waves 1 and 2 may be complete.
Minor wave 3 is expected to pull price lower, with minute wave iii just passing through its middle stages.
Minute wave iii has a target calculated to reach 21.11, where it would reach equality in length with minute wave i.
This wave count expects overlapping third waves at minute, minor, and intermediate degrees, which should unfold with increased downwards momentum. At these degrees, the third waves should be unmistakable.
When it arrives, a bounce or consolidation for minute wave iv may not move into minute wave i price territory above 22.330.
If price moves below the last low of primary wave B within cycle wave II at 19.909, then there will be added confidence to this wave count as at that point the alternate wave count below would be invalidated.
A base channel is drawn about intermediate waves (1) and (2). The first trend line is drawn from the start of intermediate wave (1) to the end of intermediate wave (2), then a parallel copy is placed on the end of intermediate wave (1). Minor wave 2 has found resistance perfectly at the upper edge of this base channel. Intermediate wave (3) has broken below this channel and may now find resistance at its lower edge.
BULLISH ELLIOTT WAVE COUNT.
WEEKLY CHART
Click chart to enlarge.
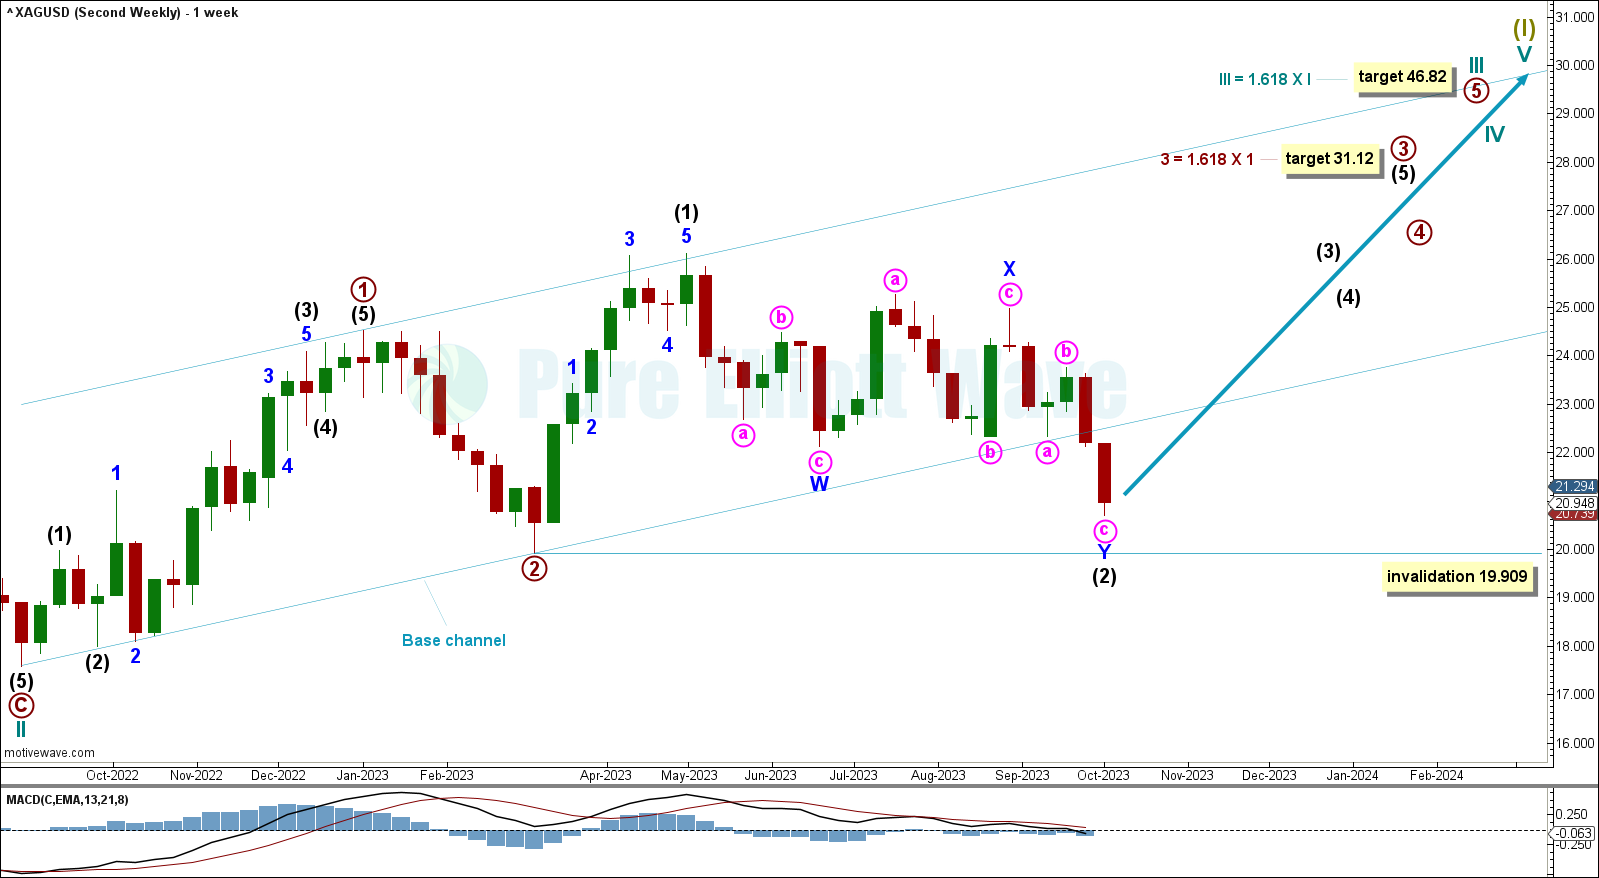
Within the trend of Supercycle wave (I), cycle wave III may have begun. Cycle wave III may only subdivide as an impulse. Within the impulse, primary waves 1 and 2 may be complete. Within primary wave 3, a second wave correction may not move below 19.909.
Intermediate wave (2) is labeled complete at the October 1st low, subdividing as a complete double zigzag. This structure may continue lower before the wave count is invalidated, and may need to be relabeled if it does move lower.
Overlapping third waves are now expected at intermediate, primary, and cycle degrees. Third waves at these degrees should be obvious and come with increasing range and momentum. This reduces the confidence in this wave count.
Draw a base channel about primary waves 1 and 2. Draw the first trend line from the start of primary wave 1 to the end of primary wave 2, then place a parallel copy on the end of primary wave 1. The lower edge of the base channel may show where deep corrections may find support. The current third wave movements should break out of this base channel in the direction of the trend. As this channel has been breached by downwards movement, the probability of this wave count is further reduced.
Primary wave 3 is expected to move price higher with a target calculated at 31.12, the 1.618 Fibonacci ratio of primary wave 1.
At 46.82 cycle wave III would reach 1.618 the length of cycle wave I. This target may be met in some years.
DAILY CHART
Click chart to enlarge.
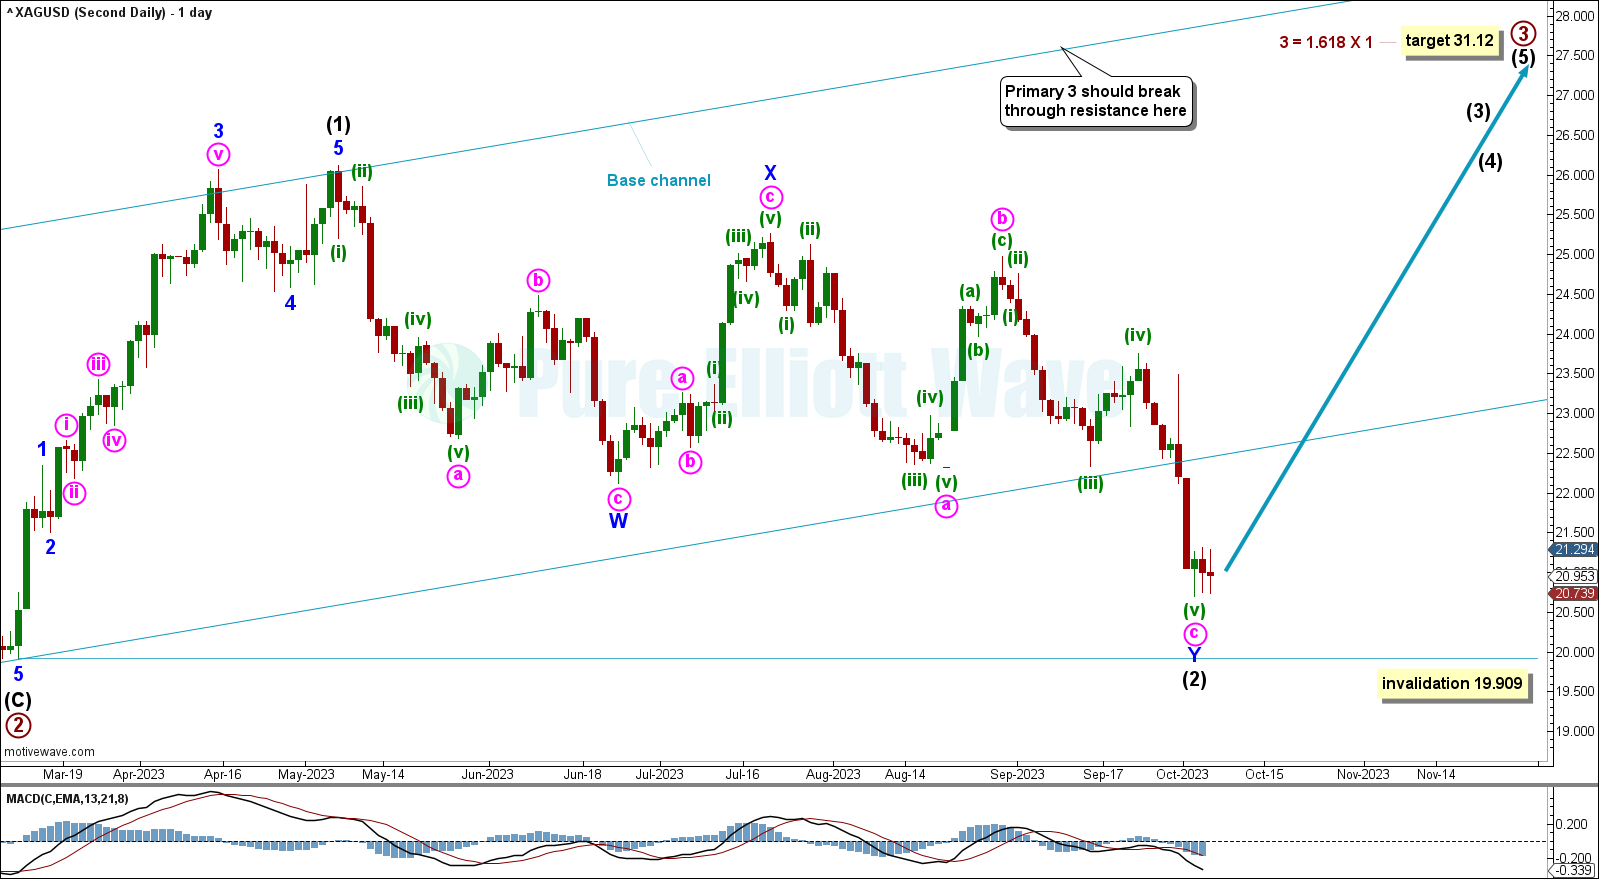
Intermediate wave (2) subdivides as a complete double zigzag. The structure may continue slightly lower and may need to be relabeled if it does continue.
As price has broken out of the base channel drawn around cycle wave III, and has continued lower since, this further reduces confidence in this wave count.
TECHNICAL ANALYSIS
WEEKLY CHART
Click chart to enlarge.
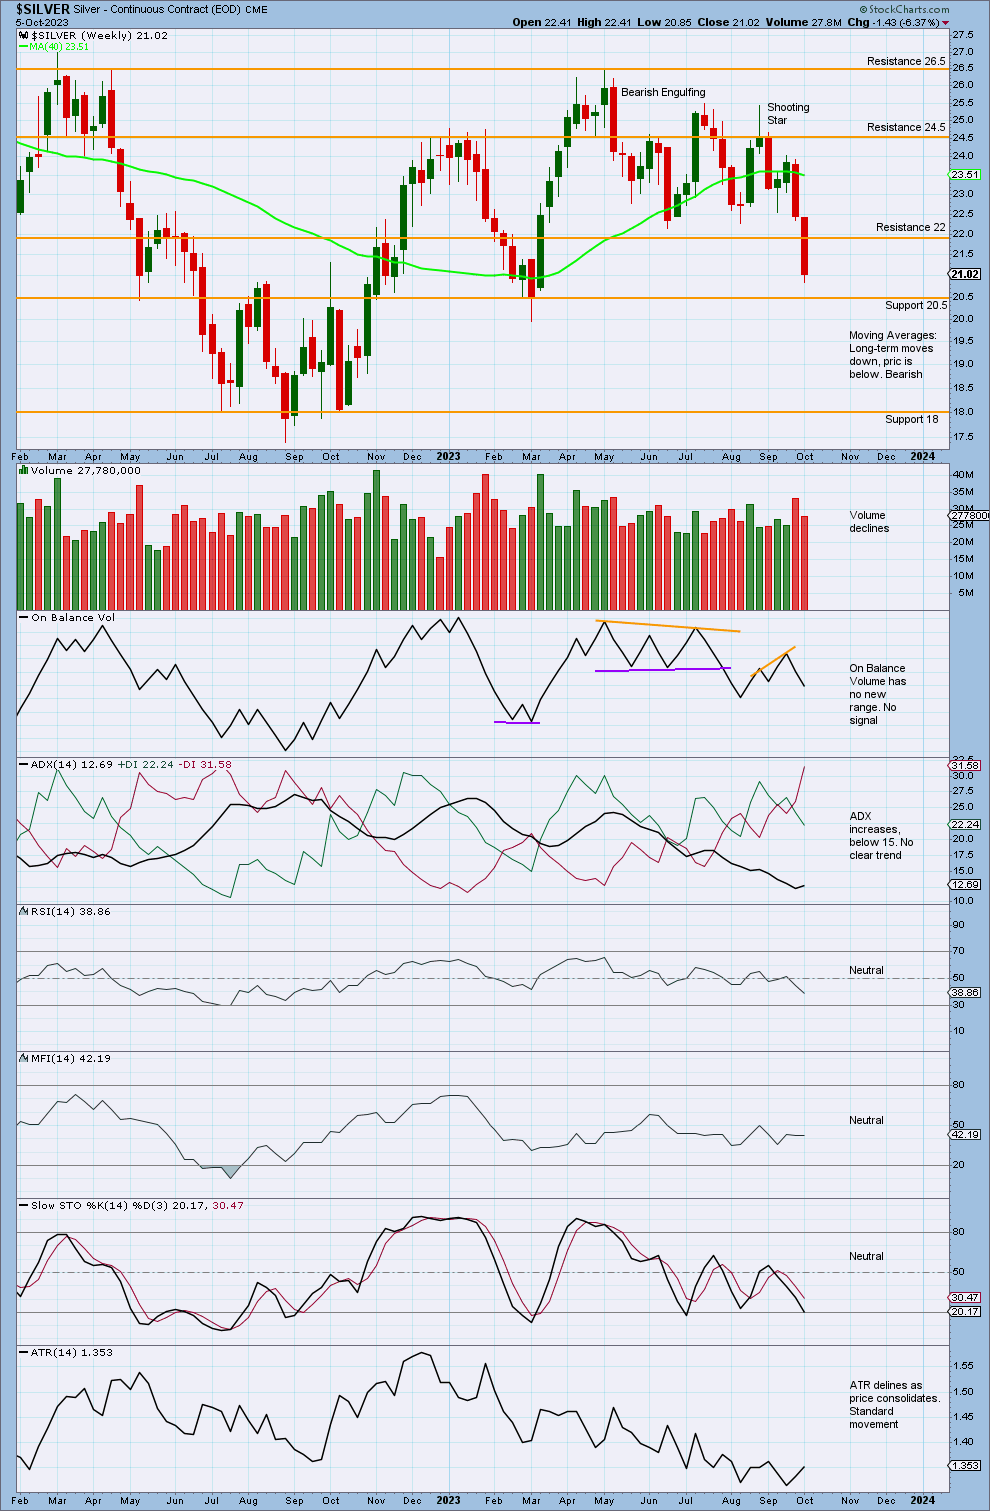
Price declines below resistance at 22.
The volume profile is bearish, with stronger volume on bearish candlesticks. Volume currently declines, as price falls of its own weight.
ADX increases, though it is below 15, so there is no clear trend. If ADX continues to increase to 15, then it will give the strongest bearish signal that ADX can give because it increases from a low point and below both DX lines.
On Balance volume previously broke out of support, giving a bearish signal, though it currently has no new range.
DAILY CHART
Click chart to enlarge.
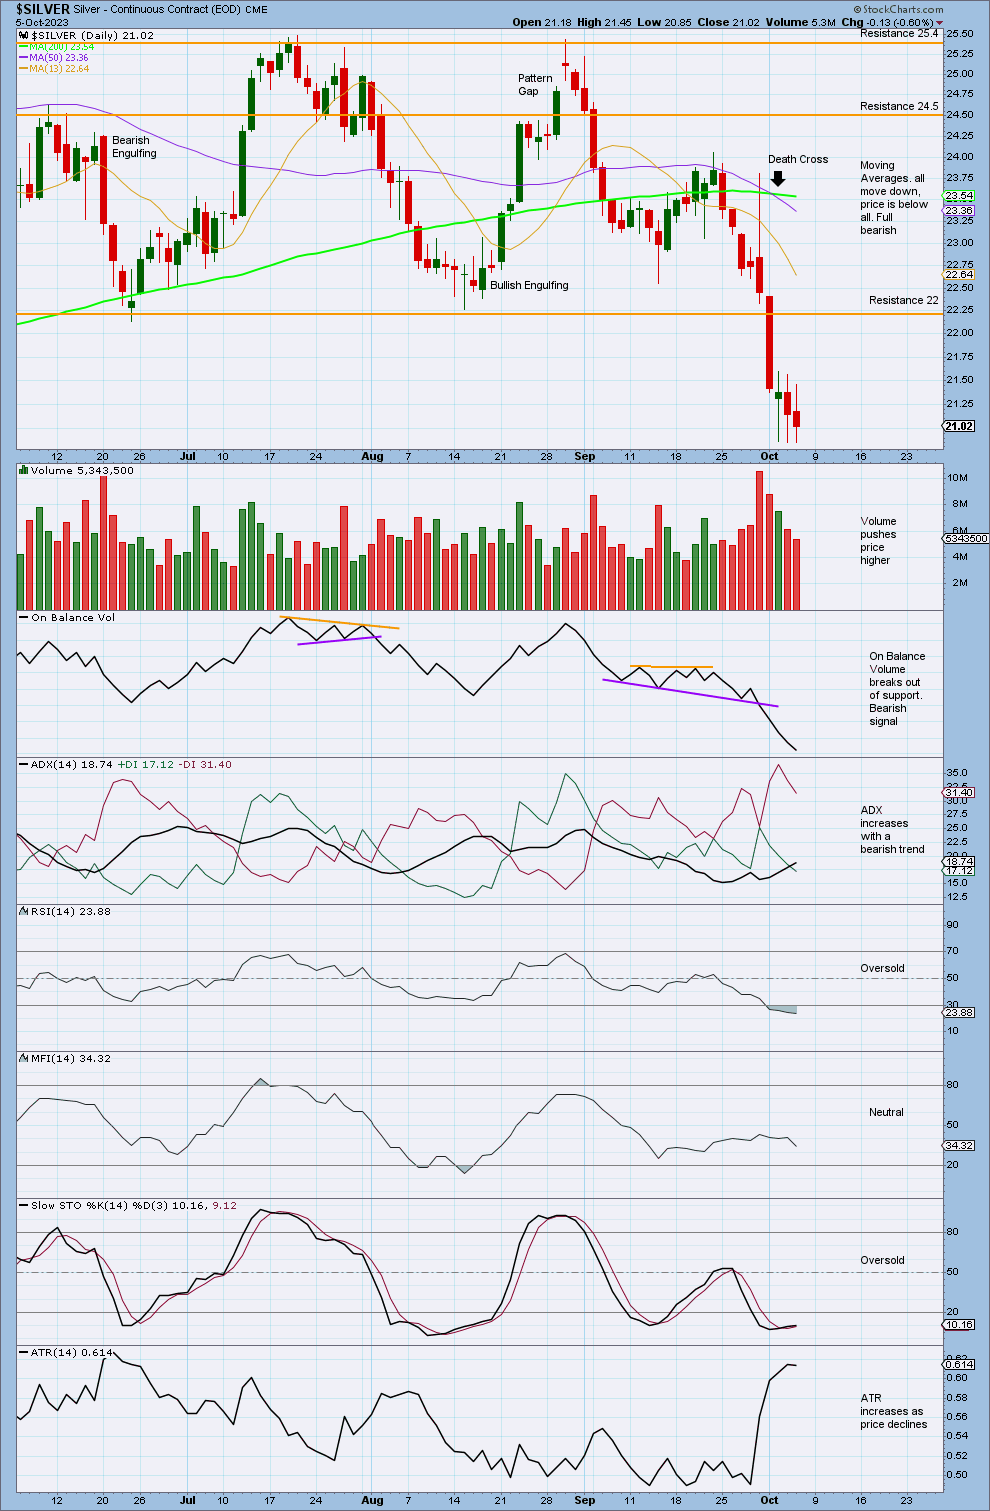
Price declines moving through resistance at 22.
The volume profile is bearish with stronger volume on bearish candlesticks, though volume currently declines as price falls of its own weight.
ADX increases with a bearish trend. ADX has initially increased from a low point and below both DX lines. This is the strongest bearish signal that ADX can give.
RSI is oversold, though it does not exhibit any divergence, and ADX is not yet extreme. This trend still has a ways to go before it may be in danger of ending.
On Balance Volume has broken out of support, giving a bearish signal.
Overall, this supports the main Elliott wave count.
Published @ 11:55 p.m.
—
Careful risk management protects your trading account(s).
Follow my two Golden Rules:
1. Invest only funds you can afford to lose.
2. Have an exit strategy for both directions; when to take profit and when to exit a losing investment.
—
New updates to this analysis are in bold.
—
 Save as PDF