November 21, 2023: NASDAQ Elliott Wave and Technical Analysis – Video and Charts
Continued bullish movement supports the bullish Elliott wave count.
Summary: Price is expected to increase. The next target is at 15,019.
Note that the S&P 500 and NASDAQ do not always find highs and lows together. The last all-time high for the S&P 500 was on January 4, 2022, whereas the last all-time high for NASDAQ was November 22, 2021.
Last updated monthly charts are here.
BULLISH WAVE COUNT
WEEKLY CHART
Click chart to enlarge.
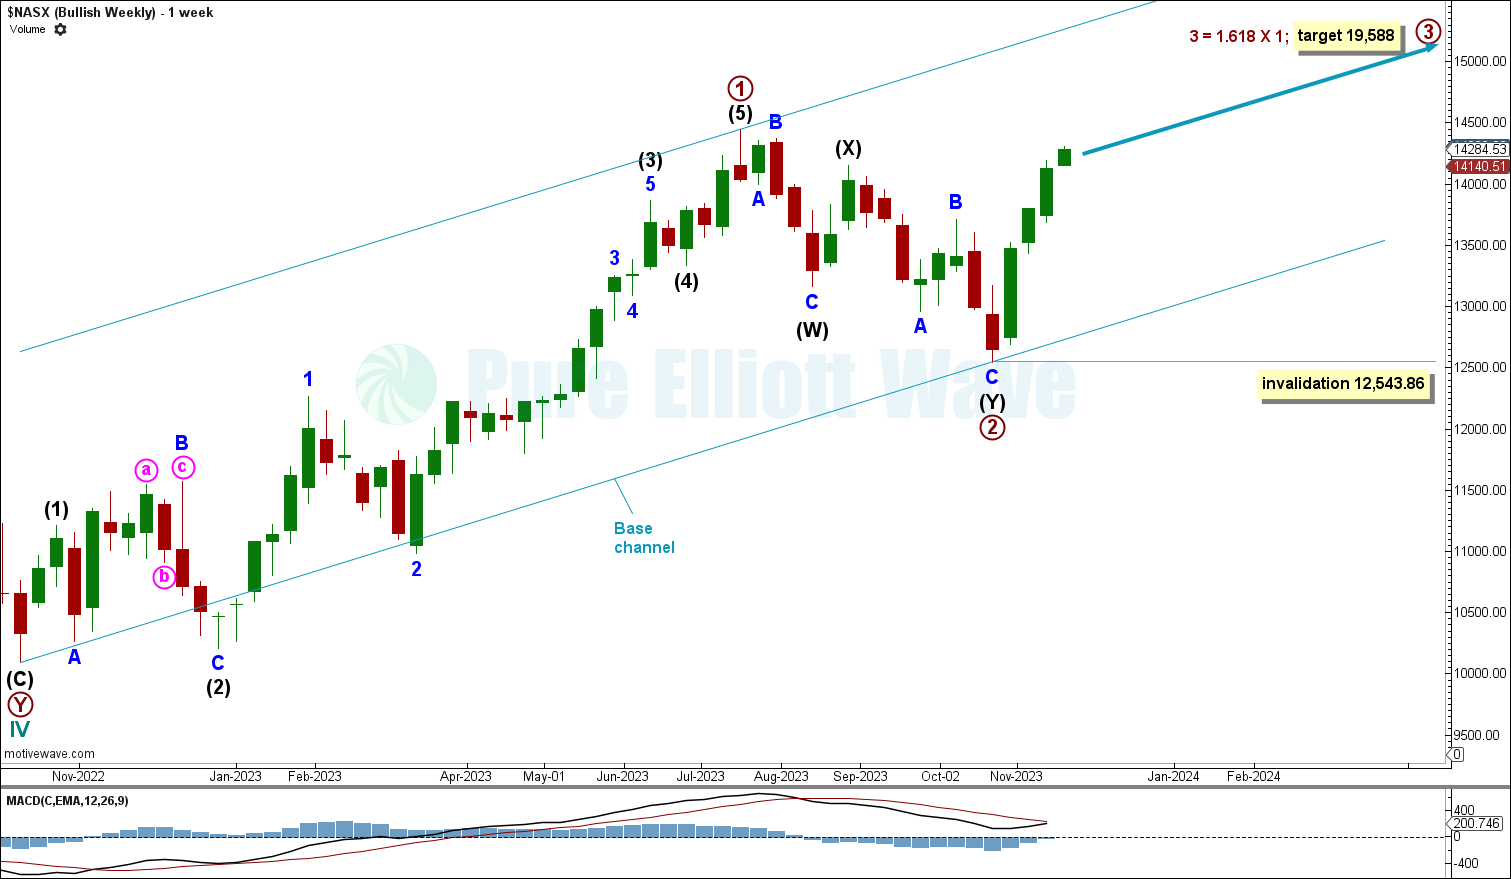
Primary wave 2 within cycle wave V is labelled complete at the October 22nd low.
Price now continues to increase with a push in bullish momentum for primary wave 3.
Primary wave 3 has a target calculated at 19,588, the 1.618 Fibonacci ratio of primary wave 1.
Within primary wave 3, any corrective movement cannot move below 12,543.86.
DAILY CHART
Click chart to enlarge.
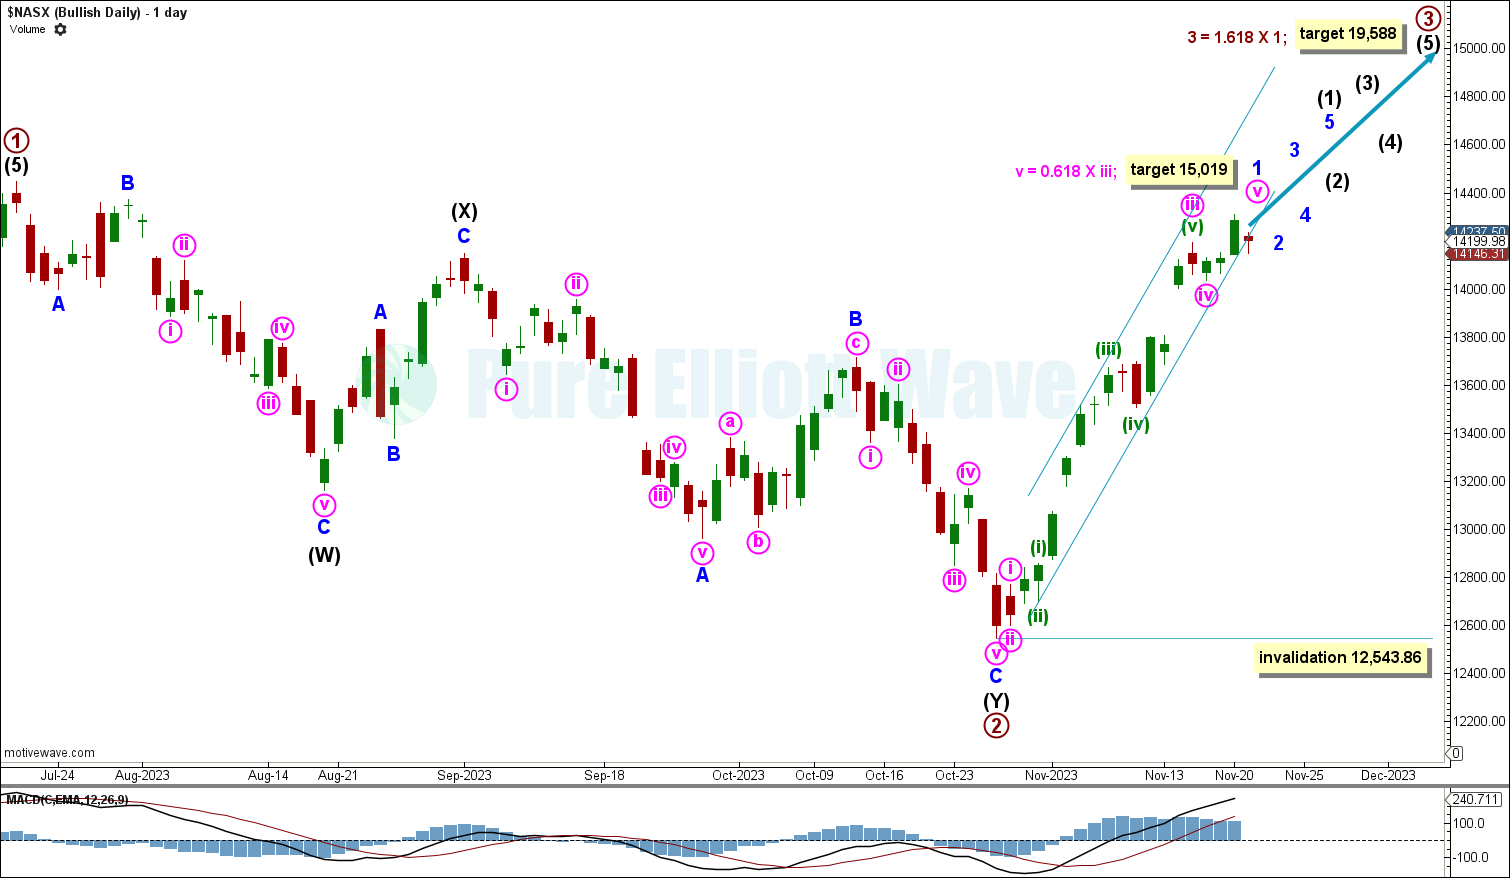
Price increases for the end of minor wave 1 within intermediate wave (1) of primary wave 3. At 15,019 minute wave v would reach 0.618 the length of minute wave iii.
A narrow channel is drawn about minor wave 1. If this channel is breached by a full red daily candlestick below and not touching the lower trend line, then that may be taken as an indication that minor wave 1 is complete and minor wave 2 has arrived.
When minor wave 2 arrives, it cannot move below the start of minor wave 1 at 12,543.86.
WEEKLY ALTERNATE CHART
Click chart to enlarge.
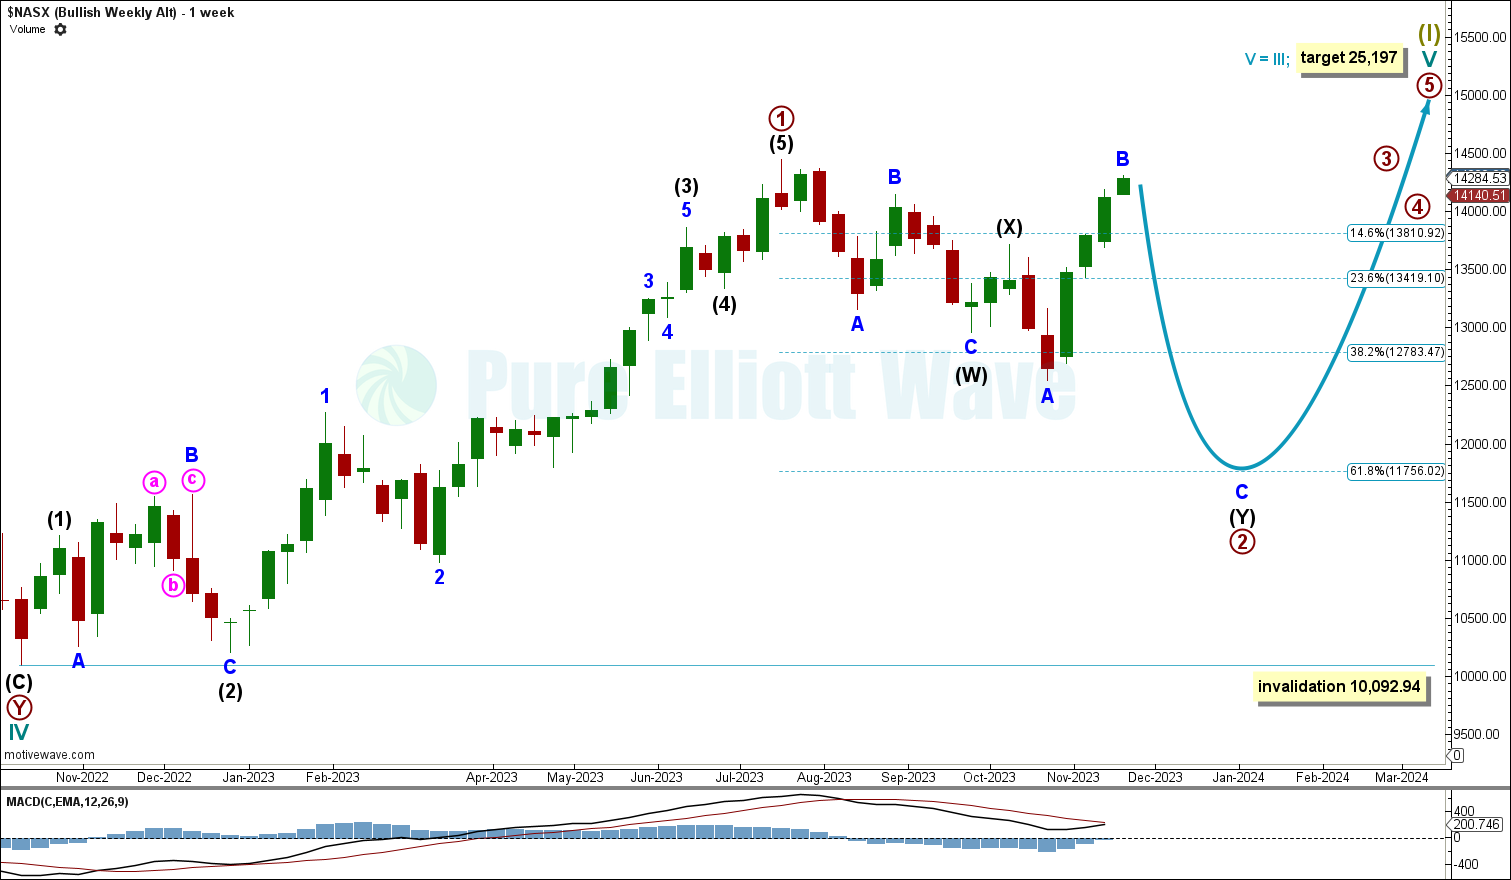
This alternate sees primary wave 2 as an incomplete double combination.
Minor wave B within intermediate wave (Y) is labelled complete at the November 21st high. Price may now decline for minor wave C.
Minor wave B may still continue up to 14,884.42, where it would reach twice the length of minor wave A, which is the maximum conventionally allowed length for a B wave within an expanded flat.
Primary wave 2 is expected to pull price lower. A target is calculated at 11,756.02, the 0.618 Fibonacci ratio of primary wave 1.
Primary wave 2 cannot move below the start of primary wave 1 at 10,092.94.
BEARISH ELLIOTT WAVE COUNT
WEEKLY CHART
Click chart to enlarge.
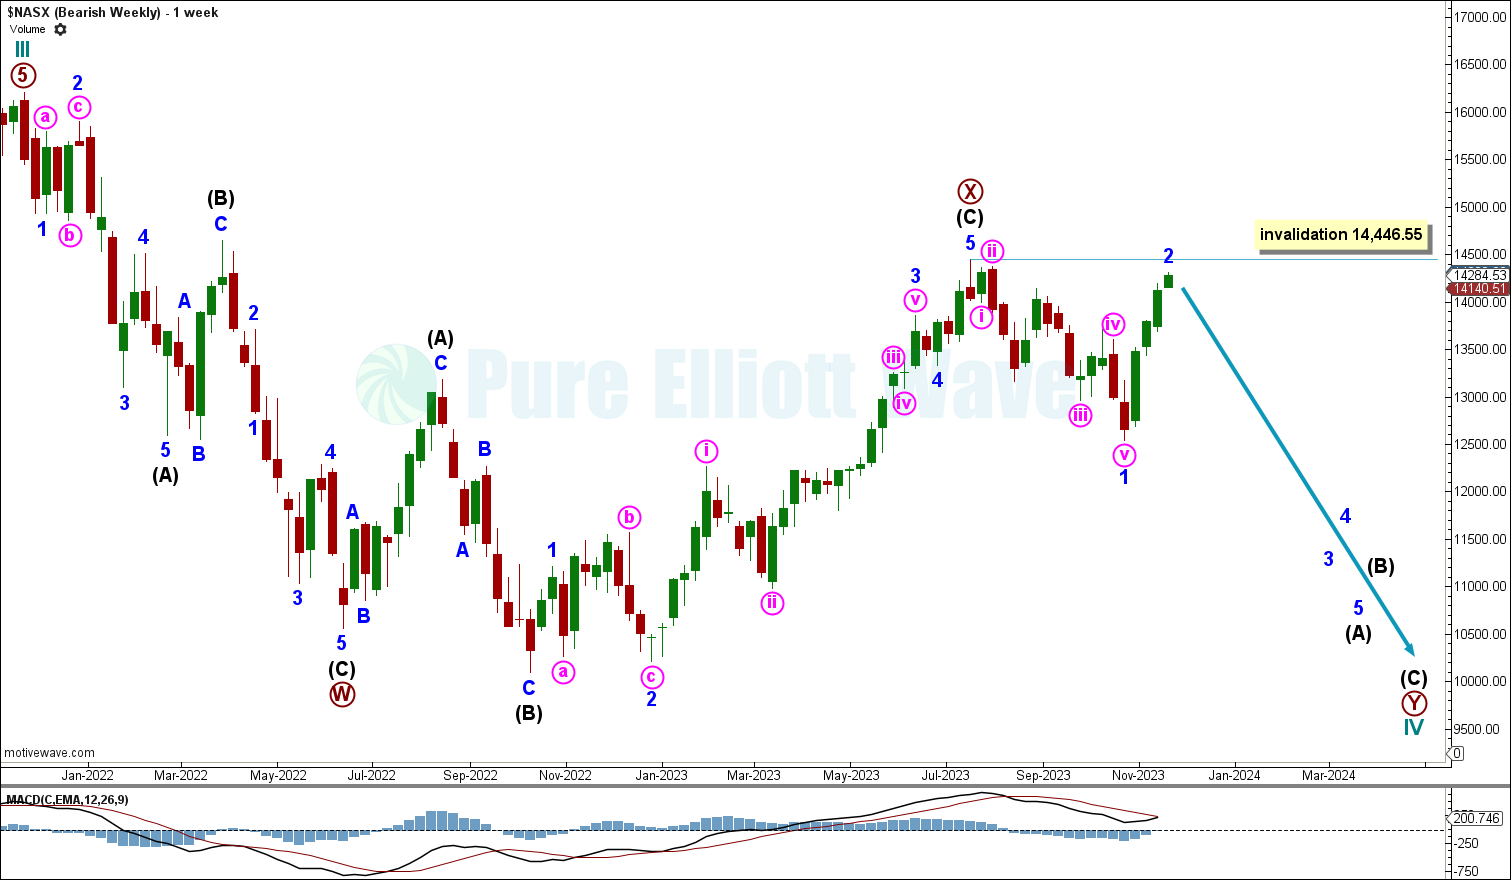
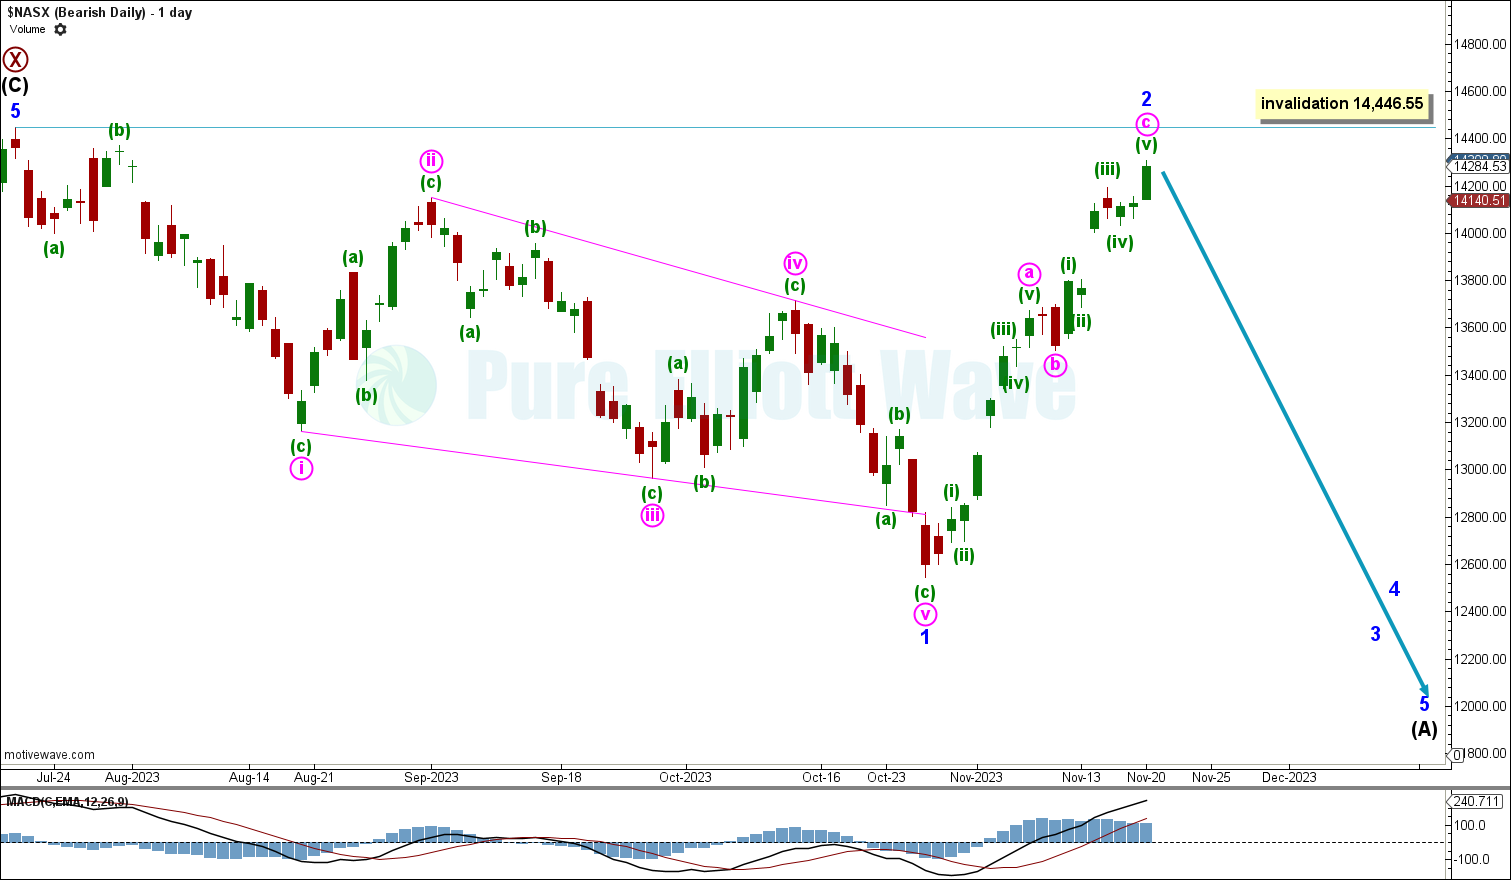
This wave count sees cycle wave IV incomplete, currently moving lower for primary wave Y within a double zigzag or double combination.
Primary wave X is labelled complete at the July 16th high, subdividing as an expanded flat.
Primary wave Y pulls price lower, currently within minor wave 3 of intermediate wave (A).
Any corrective movement within intermediate wave (A) cannot move above 14,446.55
DAILY CHART
Click chart to enlarge.
Minor wave 2 continued higher. It is labelled complete at the November 21st high.
Price now expected to decline for minor wave 3.
If minor wave 2 continues, then it cannot move above the start of minor wave 1 at 14,446.55. If price moves above this point, then this wave count will be discarded.
TECHNICAL ANALYSIS
WEEKLY CHART
Click chart to enlarge.
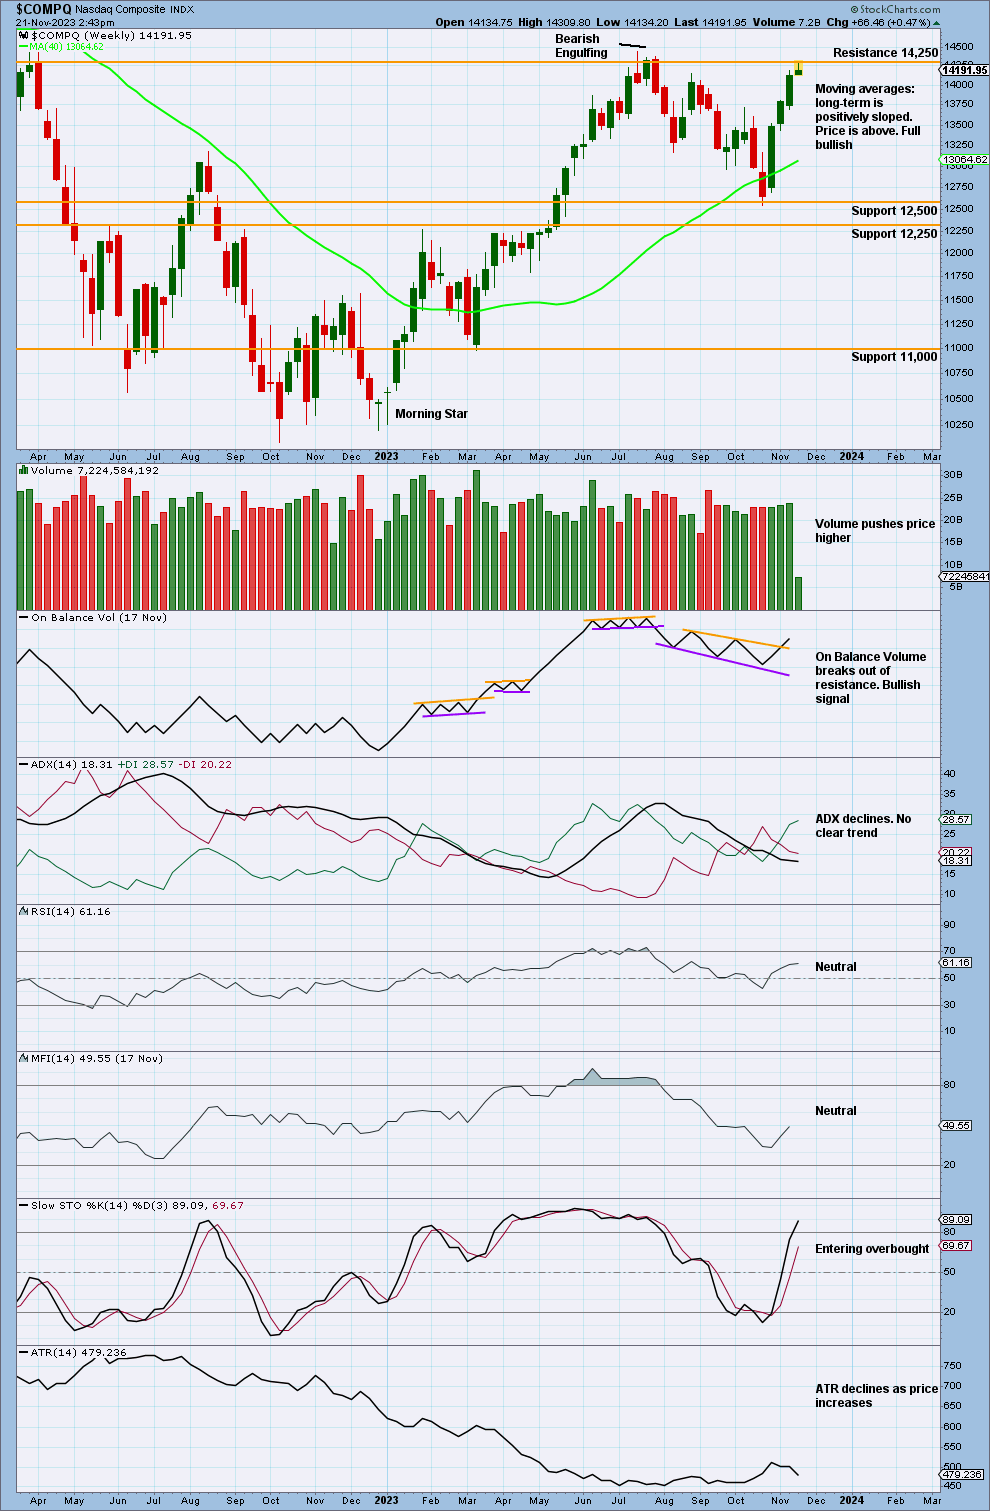
Price continues to increase, finding resistance at 14,250.
Volume continues to push price higher.
Stochastics is entering overbought as price finds resistance at 14,250.
This chart is bullish and supports the main Elliott Wave count.
DAILY CHART

Click chart to enlarge
Price increases with volume overall pushing price higher.
The previous measuring gap has a target calculated at 14,463.51. Price has not reached this target yet.
ADX continues to increase with a bullish trend that is not yet extreme
RSI has previously entered overbought, though it is currently neutral. Money Flow Index is currently overbought. A corrective movement may occur soon to relieve these conditions.
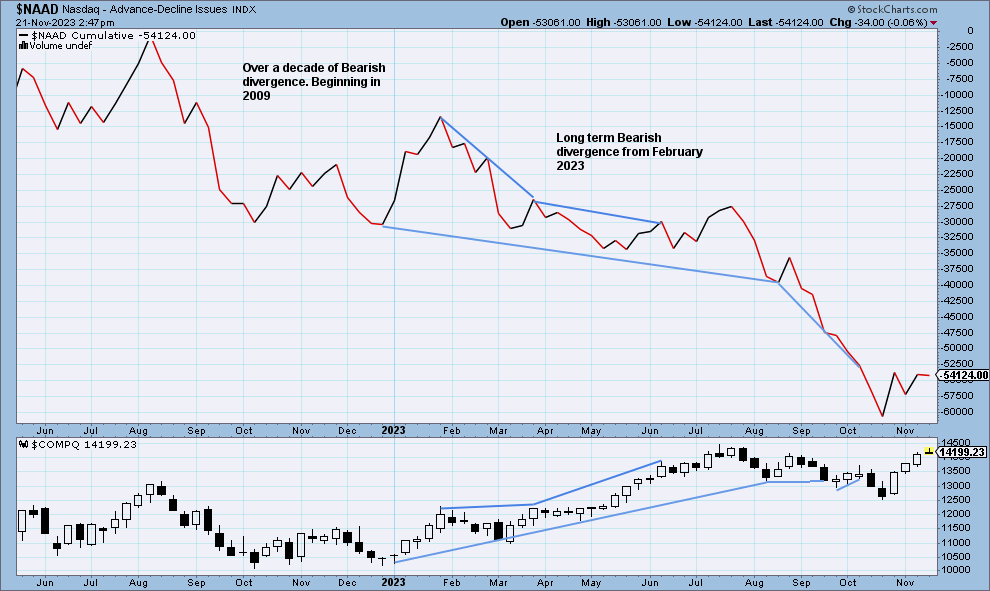
NAAD WEEKLY CHART
Click chart to enlarge
Nasdaq price is making higher highs, but the Nasdaq AD line has made lower highs. This divergence is bearish, and it shows that the rise in price does not have support from rising market breadth.
Nasdaq AD line is making new lows while price makes higher lows. This bearish divergence continues back to 2009.
Published @ 08:30 p.m. ET.
—
Careful risk management protects your trading account(s).
Follow my two Golden Rules:
1. Always trade with stops.
2. Risk only 1-5% of equity on any one trade.
—
New updates to this analysis are in bold.
—
 Save as PDF