November 16, 2023: SILVER Elliott Wave and Technical Analysis – Video and Charts
Summary: Price increases with a push in bullish momentum. Bullish technicals support the second Elliott Wave count.
Monthly charts are updated here.
BEARISH ELLIOTT WAVE COUNT
WEEKLY CHART
Click chart to enlarge.
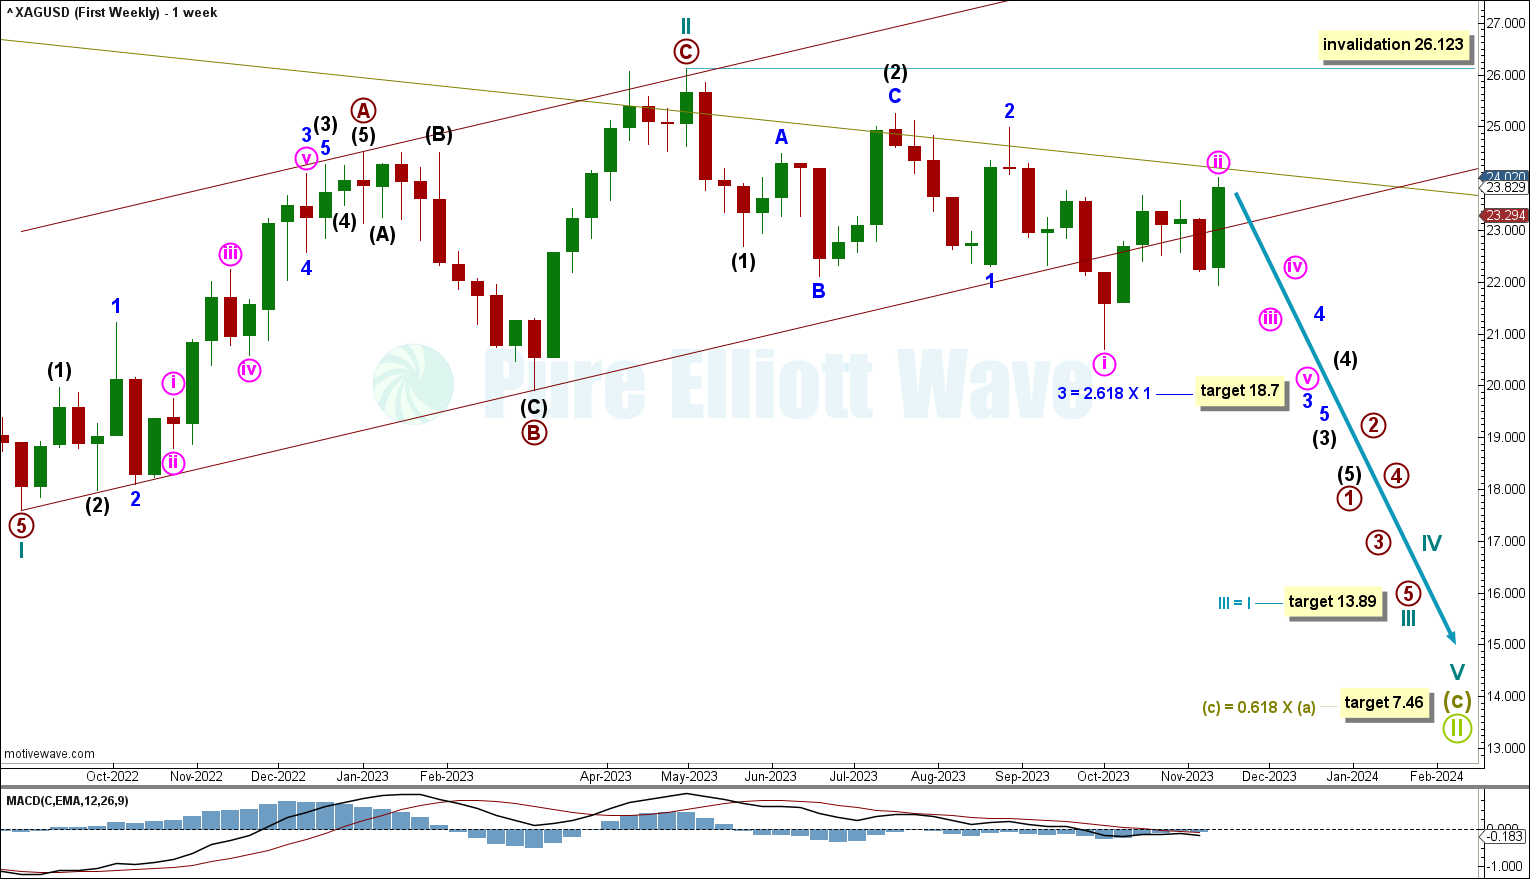
There are two possible structures that Supercycle wave (c) may subdivide as, an impulse (more likely) or an ending diagonal (less likely). An impulse requires cycle wave I to subdivide as a five wave motive structure. Cycle wave I fits well as an impulse, which indicates Supercycle wave (c) would most likely be subdividing as an impulse.
Within the impulse, cycle waves I and II may be complete, with price now moving down for cycle wave III.
Cycle wave III is expected to be in its third intermediate wave of its first primary wave. Intermediate waves (1) and (2) may be complete. It is possible that intermediate wave (2) continues higher, though it cannot move above the start of intermediate wave (1) at 26.123.
Price has moved around support at the Elliott channel drawn around cycle wave II. If price breaks below this channel with a full candlestick below and not touching the channel, then there will be increased confidence in cycle wave III pulling price lower.
Price is now expected to move lower for third waves at minute, minor, intermediate, and cycle degrees. Overlapping third waves at these degrees should be unmistakable and should come with increasing range and momentum.
Minor wave 3 has a target calculated to reach 18.7, the 2.618 Fibonacci ratio of minor wave 1.
Cycle wave III has a target calculated at 13.89, which is equality in length with cycle wave I.
Supercycle wave (c) has a target calculated at 7.46, the 0.618 Fibonacci ratio of Supercycle wave (a).
DAILY CHART
Click chart to enlarge.
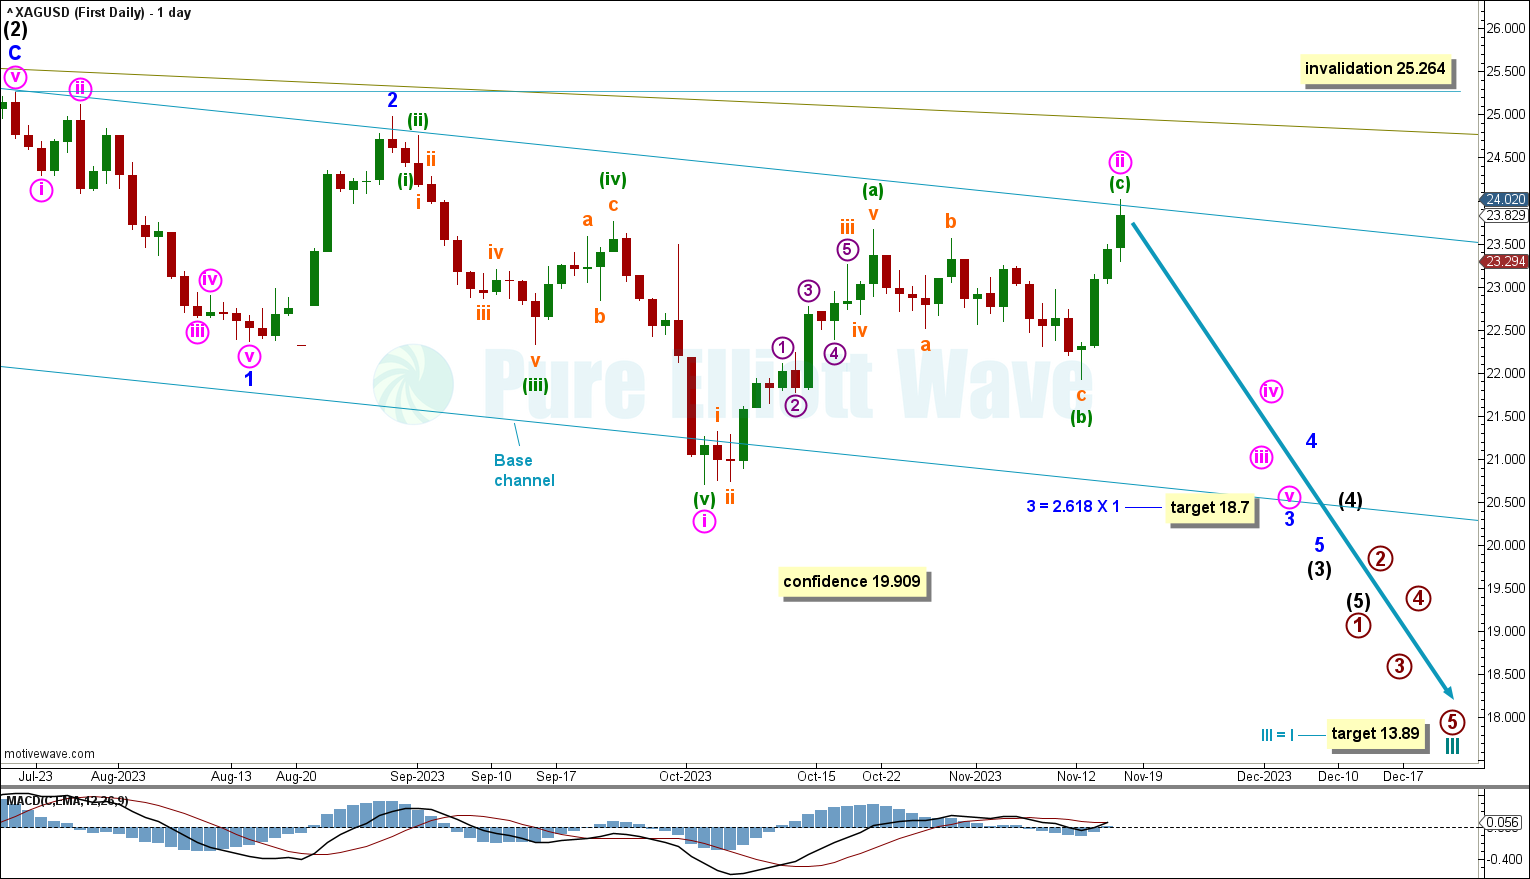
Cycle wave III has to unfold as an impulse.
Within primary wave 1: Intermediate waves (1) and (2) may be complete and intermediate wave (3) must move lower and can only subdivide as an impulse.
Within intermediate wave (3): Minor waves 1 and 2 may be complete.
Minute wave ii within minor wave 3 is labelled complete at the November 16th high. Price is now declining for minute wave iii.
This wave count expects overlapping third waves at minute, minor, and intermediate degrees, which should unfold with increased downwards momentum. At these degrees, the third waves should be unmistakable.
If minor wave 2 continues, then it cannot move above the start of minor wave 1 at 25.264.
If price moves below the last low of primary wave B within cycle wave II at 19.909, then there will be added confidence to this wave count as at that point the alternate wave count below would be invalidated.
A base channel is drawn around intermediate wave (3). Minor wave 3 is expected to break below this channel. If price does break below this channel with a full candlestick below and not touching the channel, then there will be increased confidence in this wave count.
BULLISH ELLIOTT WAVE COUNT.
WEEKLY CHART
Click chart to enlarge.
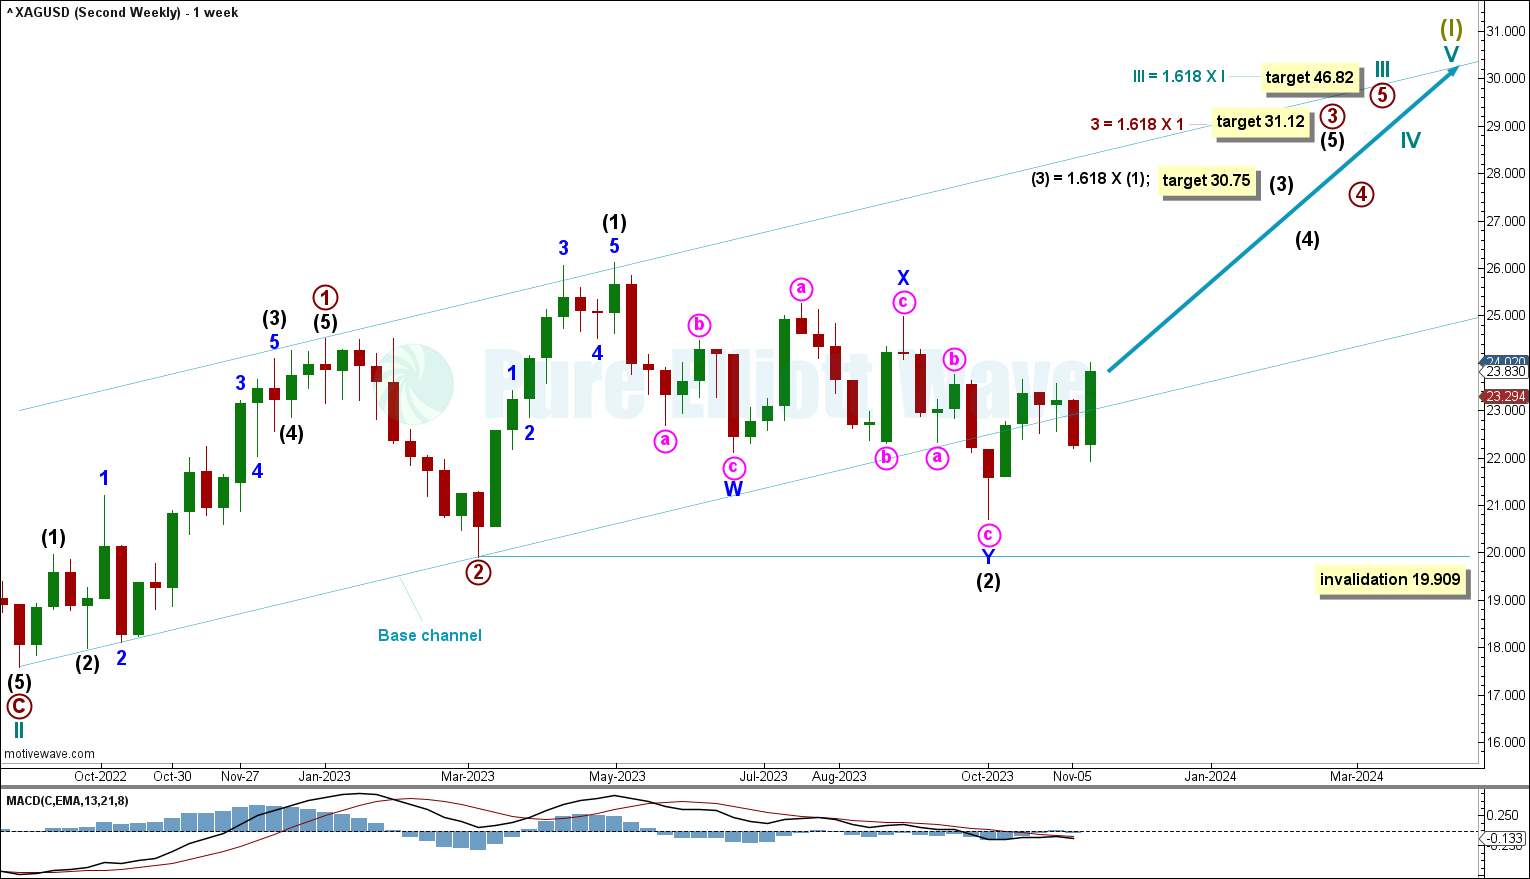
Within the trend of Supercycle wave (I), cycle wave III may have begun. Cycle wave III may only subdivide as an impulse. Within the impulse, primary waves 1 and 2 may be complete. Within primary wave 3, a second wave correction may not move below 19.909.
Intermediate wave (2) is labelled complete at the October 1st low, subdividing as a complete double zigzag. This structure may continue lower before the wave count is invalidated, and may need to be relabeled if it does move lower.
Overlapping third waves are now expected at intermediate, primary, and cycle degrees. Third waves at these degrees should be obvious and come with increasing range and momentum. This reduces the confidence in this wave count.
Intermediate wave (3) has a target calculated at 30.75, the 1.618 Fibonacci ratio of intermediate wave (1).
Draw a base channel about primary waves 1 and 2. Draw the first trend line from the start of primary wave 1 to the end of primary wave 2, then place a parallel copy at the end of primary wave 1. The lower edge of the base channel may show where deep corrections may find support. The current third wave movements should break out of this base channel in the direction of the trend. Price has moved around support at this channel, and is expected to increase for primary wave 3.
Primary wave 3 has a target calculated at 31.12, the 1.618 Fibonacci ratio of primary wave 1.
At 46.82 cycle wave III would reach 1.618 the length of cycle wave I. This target may be met in some years.
DAILY CHART
Click chart to enlarge.
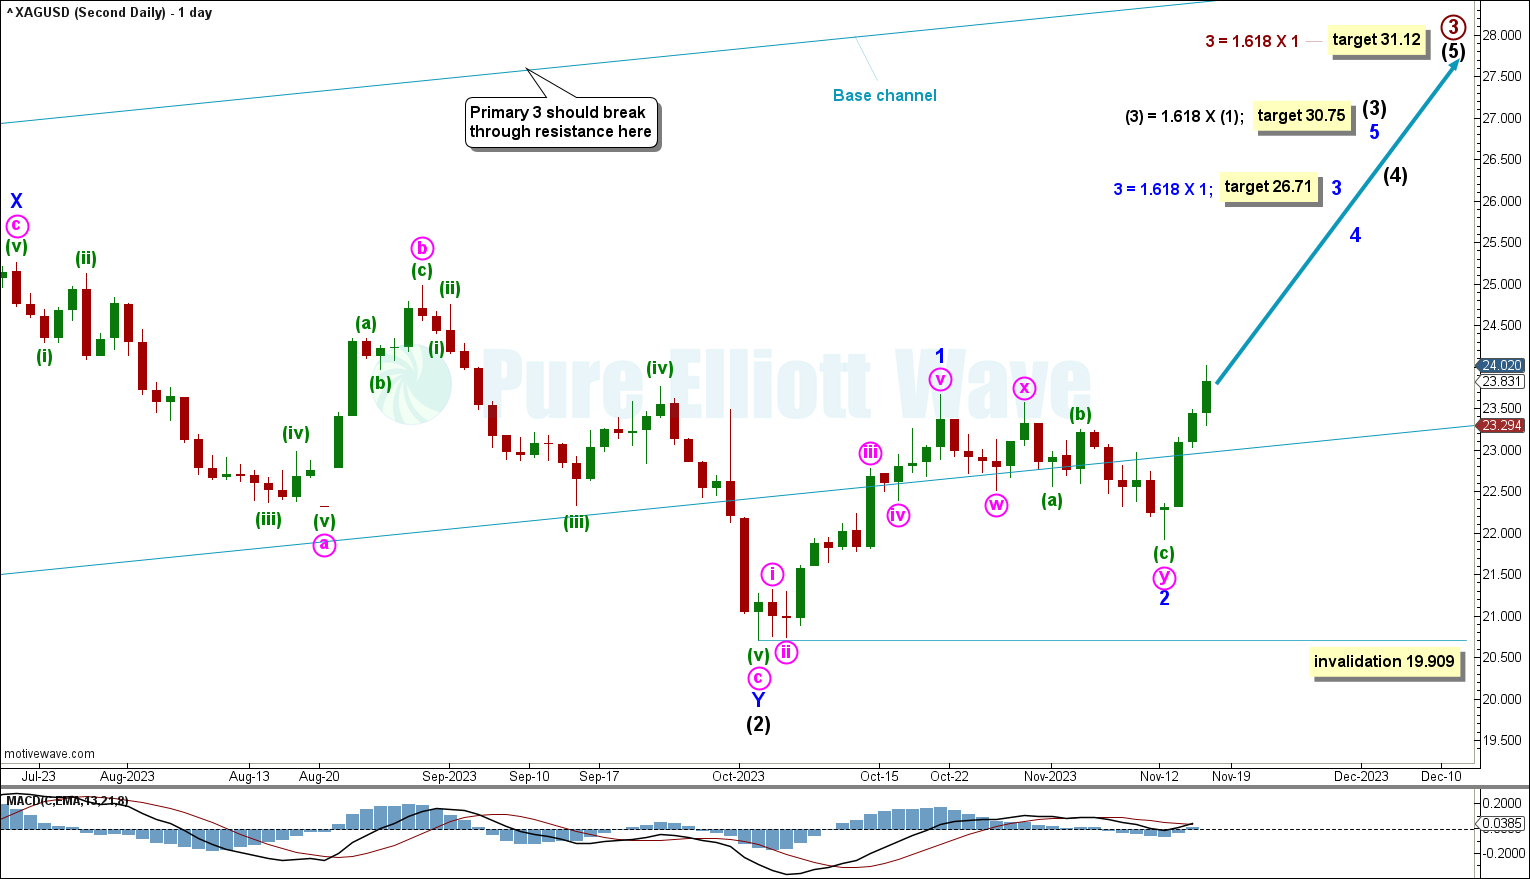
Price increases for intermediate wave (3). Currently, minor wave 3 is expected to pull price higher with a target calculated at 26.71, the 1.618 FIbonacci ratio of minor wave 1.
If minor wave 2 continues lower, then it cannot move below the start of minor wave 1 at 19.909.
As price increases above support at the base channel, upwards movement is expected to continue for overlapping third waves.
Primary wave 3 is expected to break through resistance at upper edge of the base channel.
TECHNICAL ANALYSIS
WEEKLY CHART
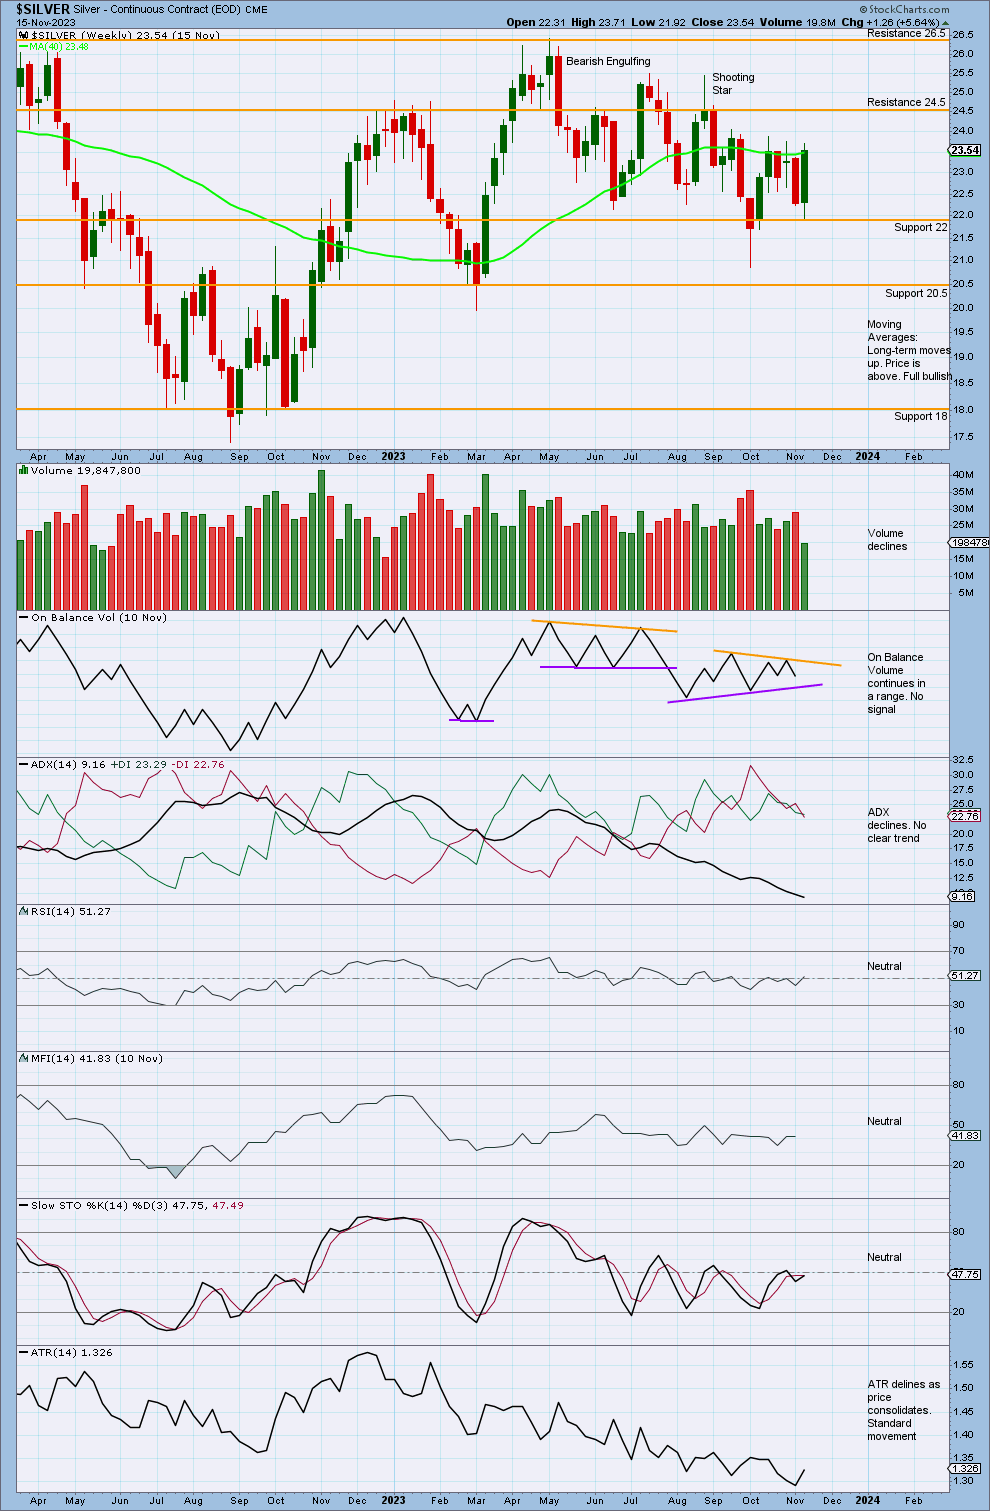
Click chart to enlarge.
Price increases with overall declining volume. This is a concern for a bullish wave count, which expects a third wave at two large degrees to be beginning; third waves should exhibit strength not weakness. However, this may change in coming weeks.
Price found strong support at 22 and is now increasing with a strong bullish candlestick.
DAILY CHART
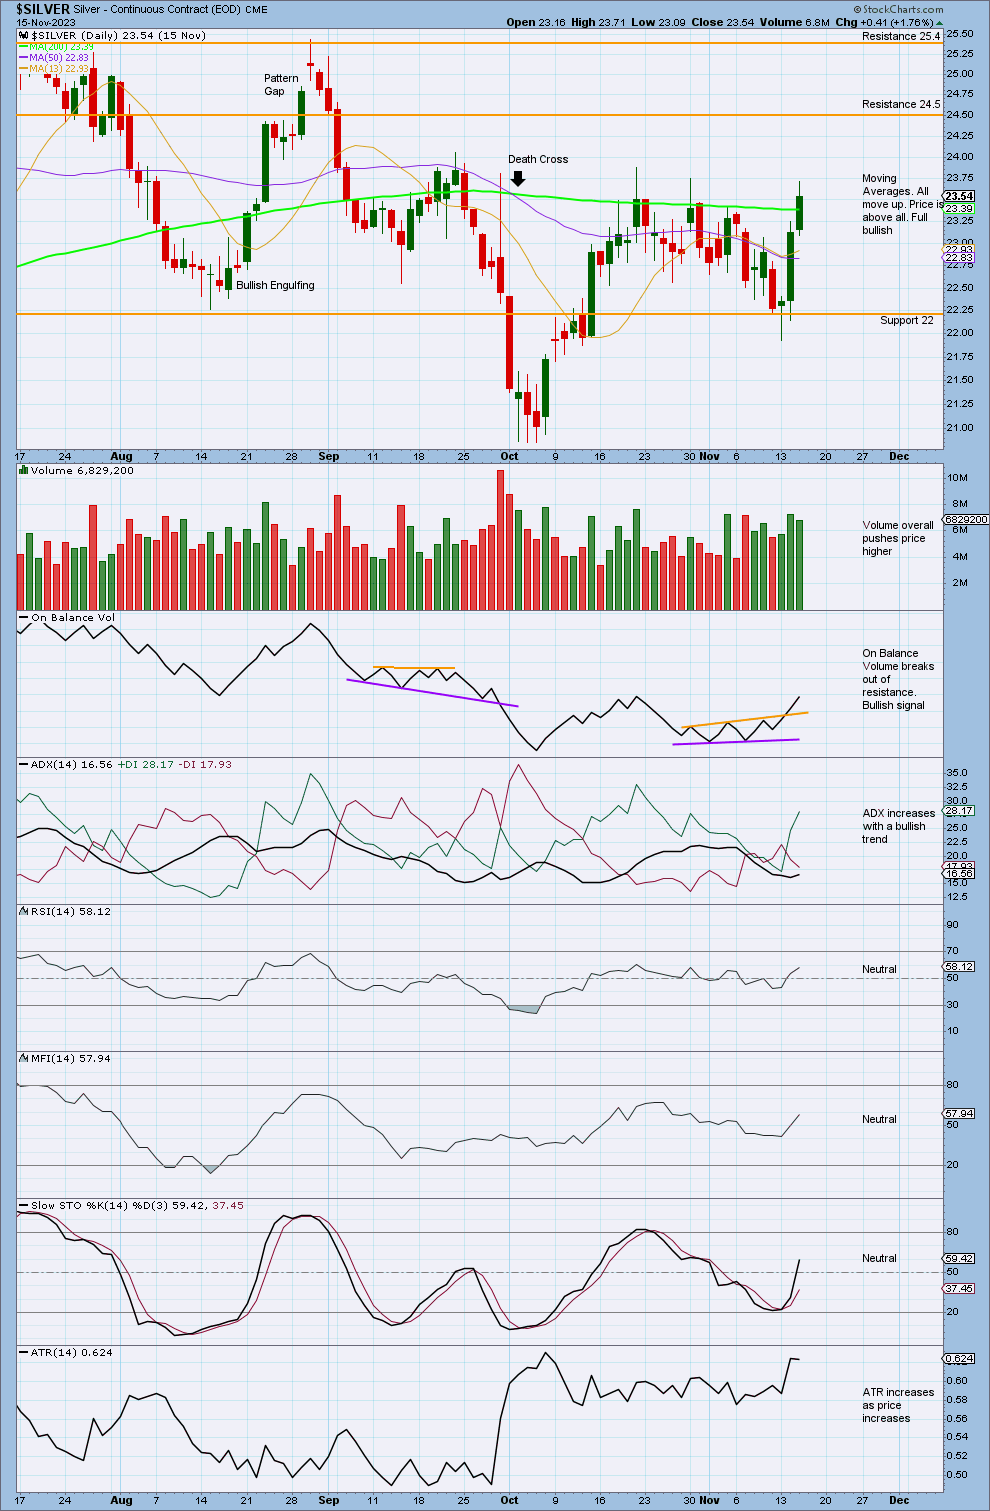
Click chart to enlarge.
Price increases with a push from volume after finding support at 22. For the short term, some support from volume now indicates a little support for a bullish Elliott Wave count.
After the last low in October, volume has pushed price higher, with an increase on bullish candlesticks.
ADX now increases from a low point, and below both DX lines, with a bullish trend. This is the strongest signal that ADX can give.
This chart supports the second Elliott Wave count.
Published @ 07:42 p.m. ET.
—
Careful risk management protects your trading account(s).
Follow our two Golden Rules:
1. Always trade with stops.
2. Risk only 1-5% of equity on any one trade.
—
New updates to this analysis are in bold.
—
 Save as PDF