January 4, 2024: SILVER Elliott Wave and Technical Analysis – Video and Charts
Summary: Price declines, moving around the base channel on the main Elliott Wave count.
Monthly charts are updated here.
BULLISH ELLIOTT WAVE COUNT
WEEKLY CHART
Click chart to enlarge.
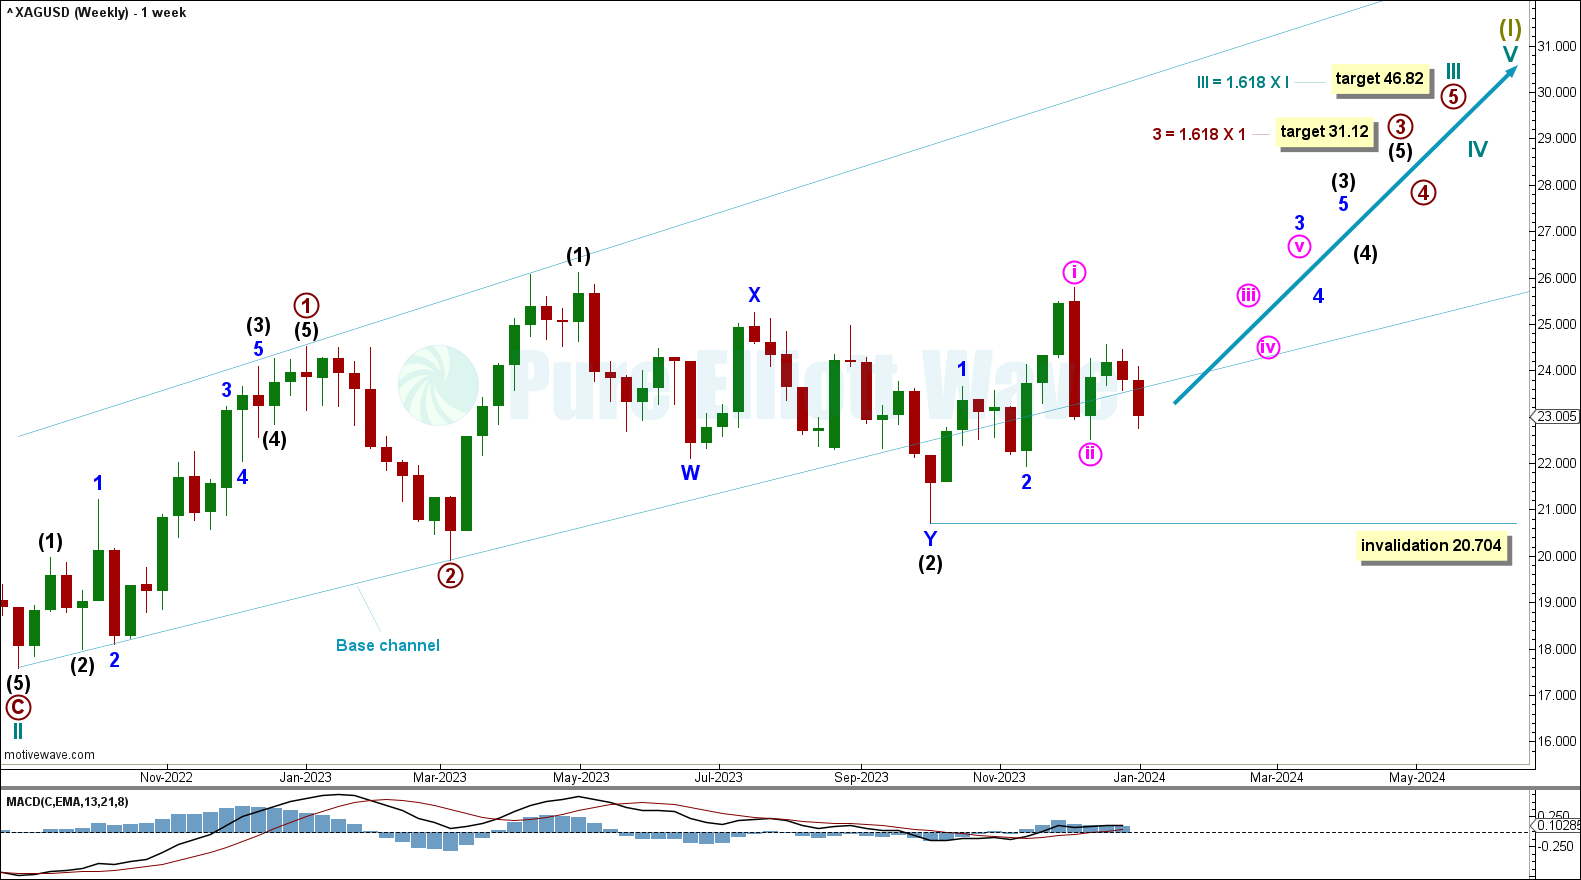
Within the trend of Supercycle wave (I), cycle wave III overall pulls price higher with overlapping first and second waves.
Overlapping third waves are expected at intermediate, primary, and cycle degrees. Third waves at these degrees should be obvious and come with increasing range and momentum (however, they may start slow as they build momentum). This reduces the confidence in this wave count.
Draw a base channel about primary waves 1 and 2. Draw the first trend line from the start of primary wave 1 to the end of primary wave 2, then place a parallel copy at the end of primary wave 1. The lower edge of the base channel may show where deep corrections may find support. The current third wave movements should break out of this base channel in the direction of the trend. Price is expected to increase for primary wave 3, breaking above the upper edge of the channel.
DAILY CHART
Click chart to enlarge.
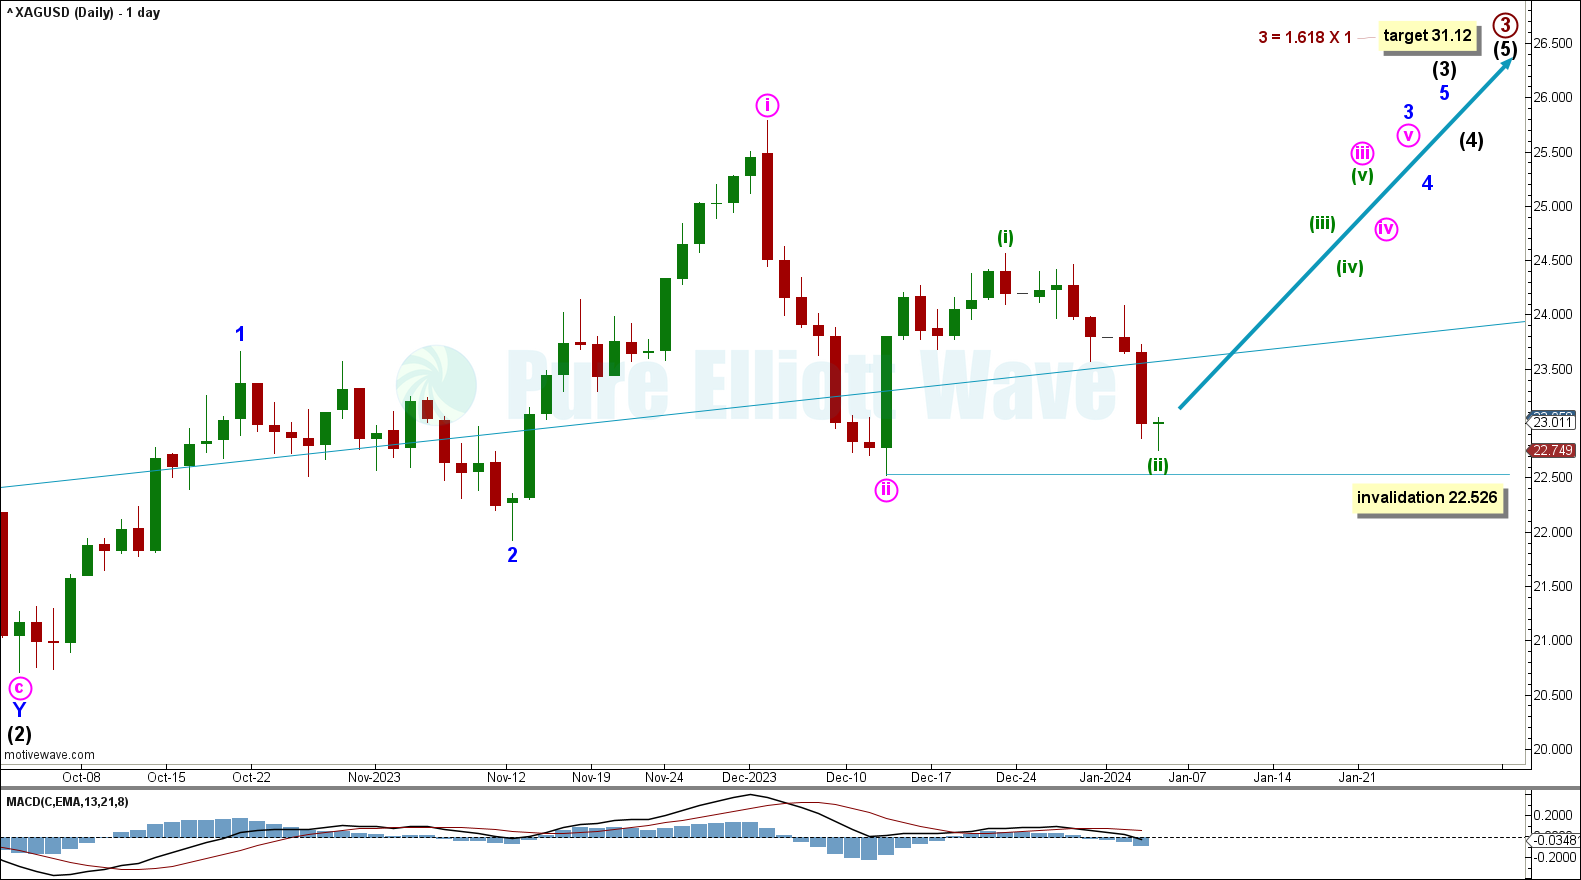
Price has declined for minuette wave (ii) within minute wave iii.
Overall, multiple third waves at six degrees are expected to pull price higher.
If minuette wave (ii) continues lower, then it cannot move below the start of minuette wave (i) at 22.526.
Price has broken below the base channel for minuette wave (ii). If price breaks back into the base channel, then there will be confidence in minuette wave (ii) being complete and minuette wave (iii) to pull price higher.
Primary wave 3 is expected to eventually break through resistance at upper edge of the base channel.
WEEKLY ALTERNATE CHART
Click chart to enlarge.
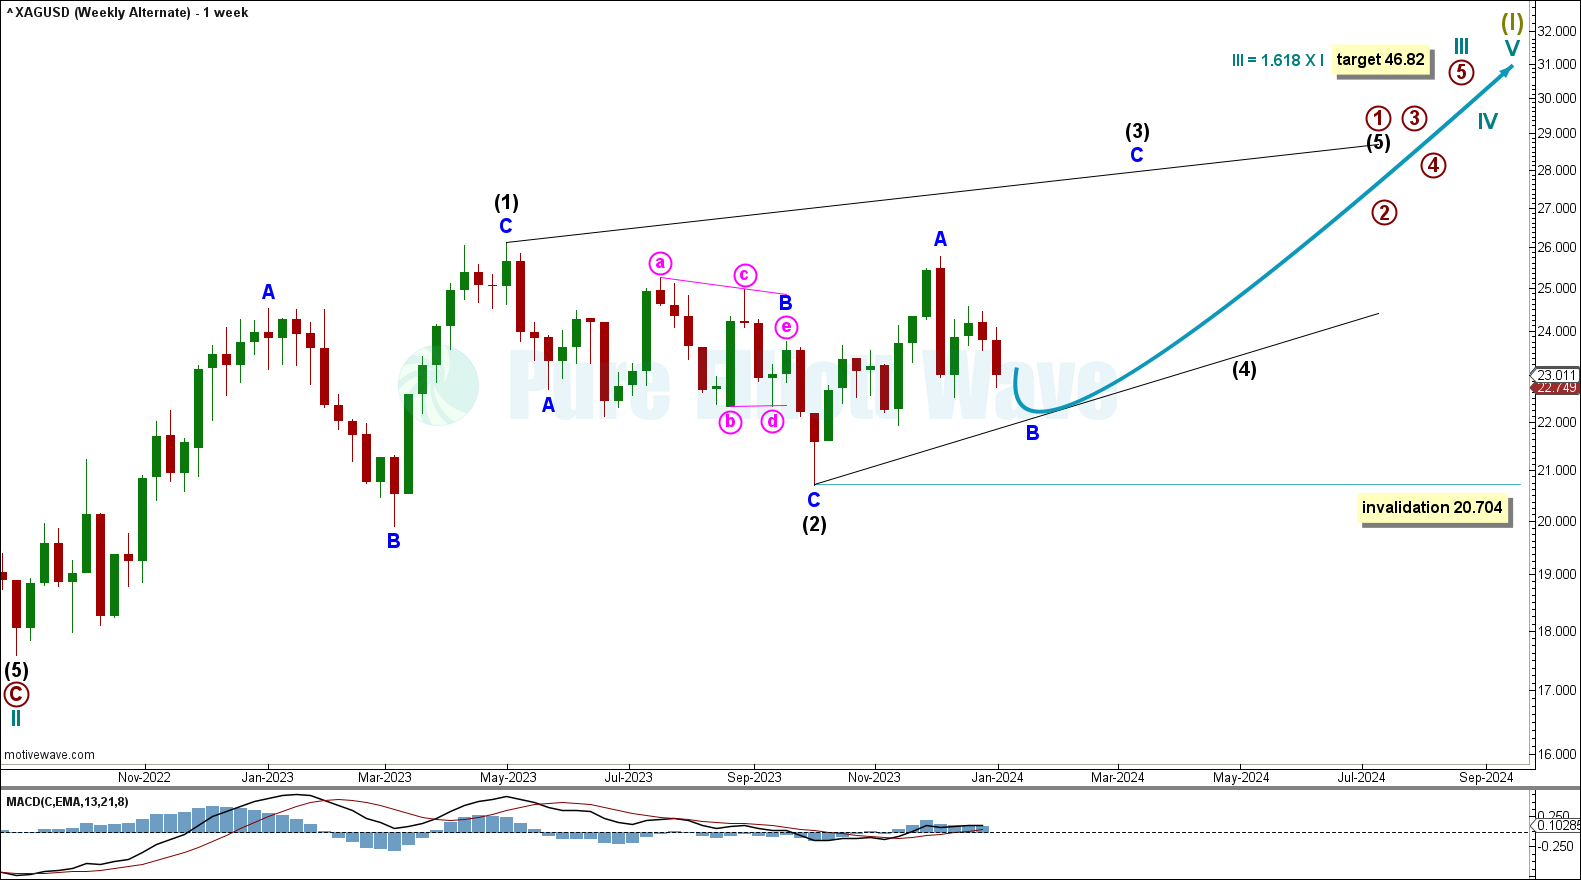
This alternate sees primary wave 1 within cycle wave III unfolding as an incomplete leading diagonal.
Price is expected to continue lower for minor wave B within intermediate wave (3).
Within intermediate wave (3), minor wave B cannot move below the start of minor wave A at 20.704.
Cycle wave III is overall expected to pull price higher with a target calculated at 46.82, the 1.618 Fibonacci ratio of cycle wave I.
TECHNICAL ANALYSIS
WEEKLY CHART
Click chart to enlarge.
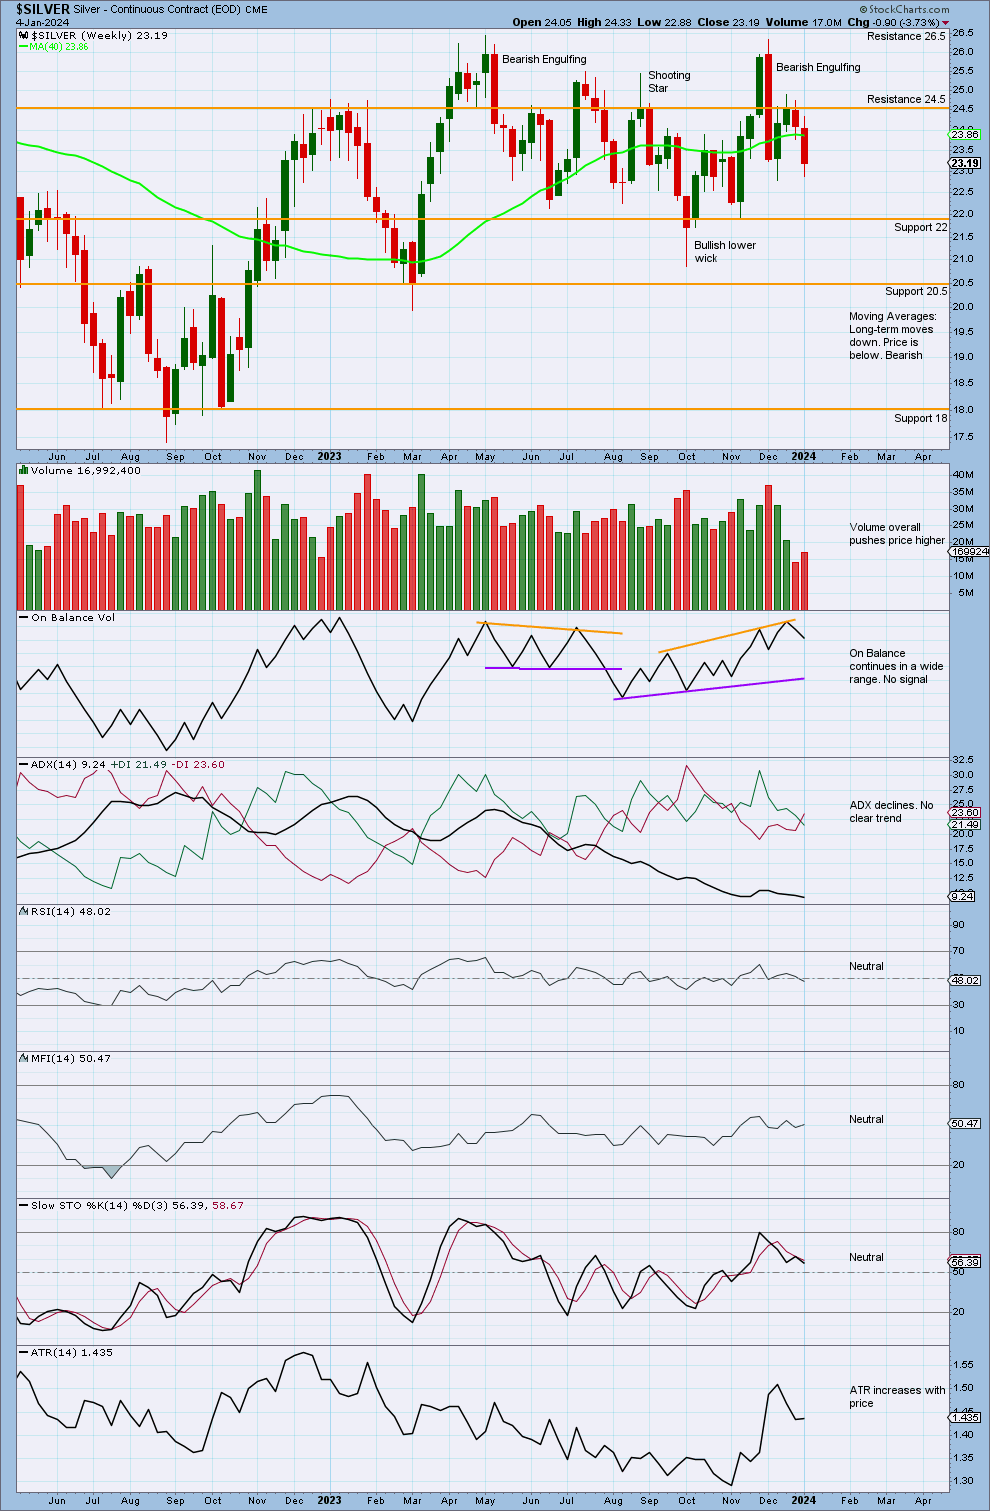
Price declines with overall declining volume. The volume profile is bearish.
ADX declines, showing no clear trend.
There was a Bearish Engulfing pattern at the high on December 4, 2023. Price has been declining.
DAILY CHART
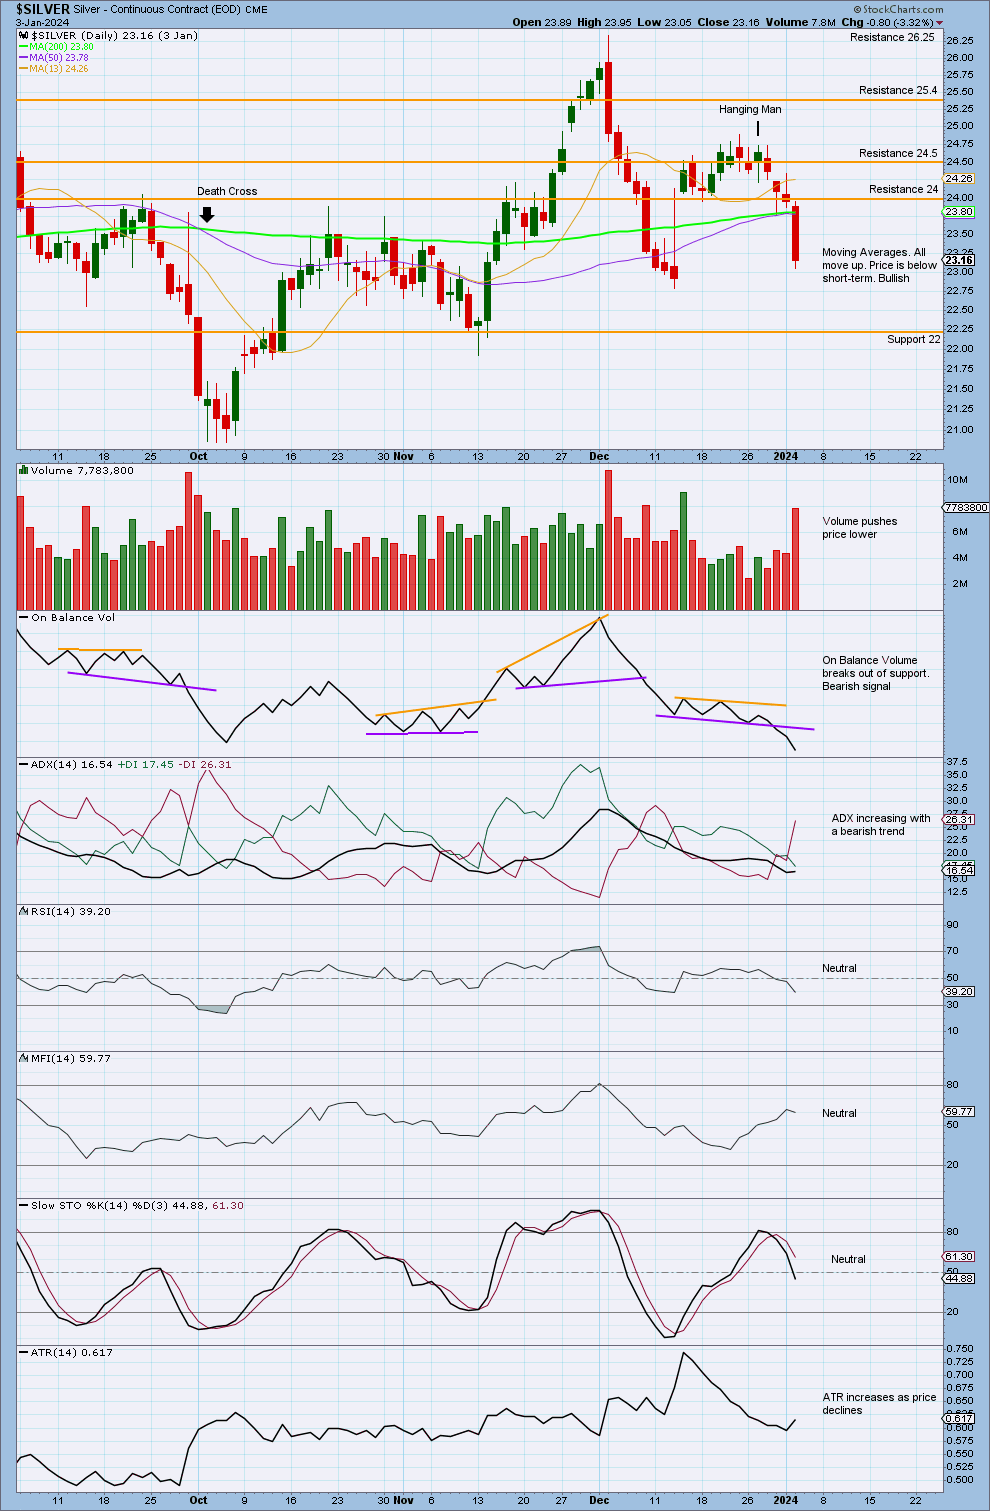
Click chart to enlarge.
Price declines with a push from volume, especially today, which ended with a strong bearish candlestick.
On Balance Volume breaks out of support, giving a bearish signal.
Published @ 08:05 p.m. ET.
—
Careful risk management protects your trading account(s).
Follow our two Golden Rules:
1. Always trade with stops.
2. Risk only 1-5% of equity on any one trade.
—
New updates to this analysis are in bold.
—
 Save as PDF