March 17, 2023: EURUSD Elliott Wave and Technical Analysis – Video and Charts
Summary: The bigger picture for Euro expects overall upwards movement for the long term, most likely to not make a new high above 1.06380.
For the short term, a pullback may continue lower to a target zone from 1.02006 to 1.01790. Thereafter, a strong third wave up may begin.
Quarterly and monthly charts were last updated here.
WEEKLY CHART
Click chart to enlarge.
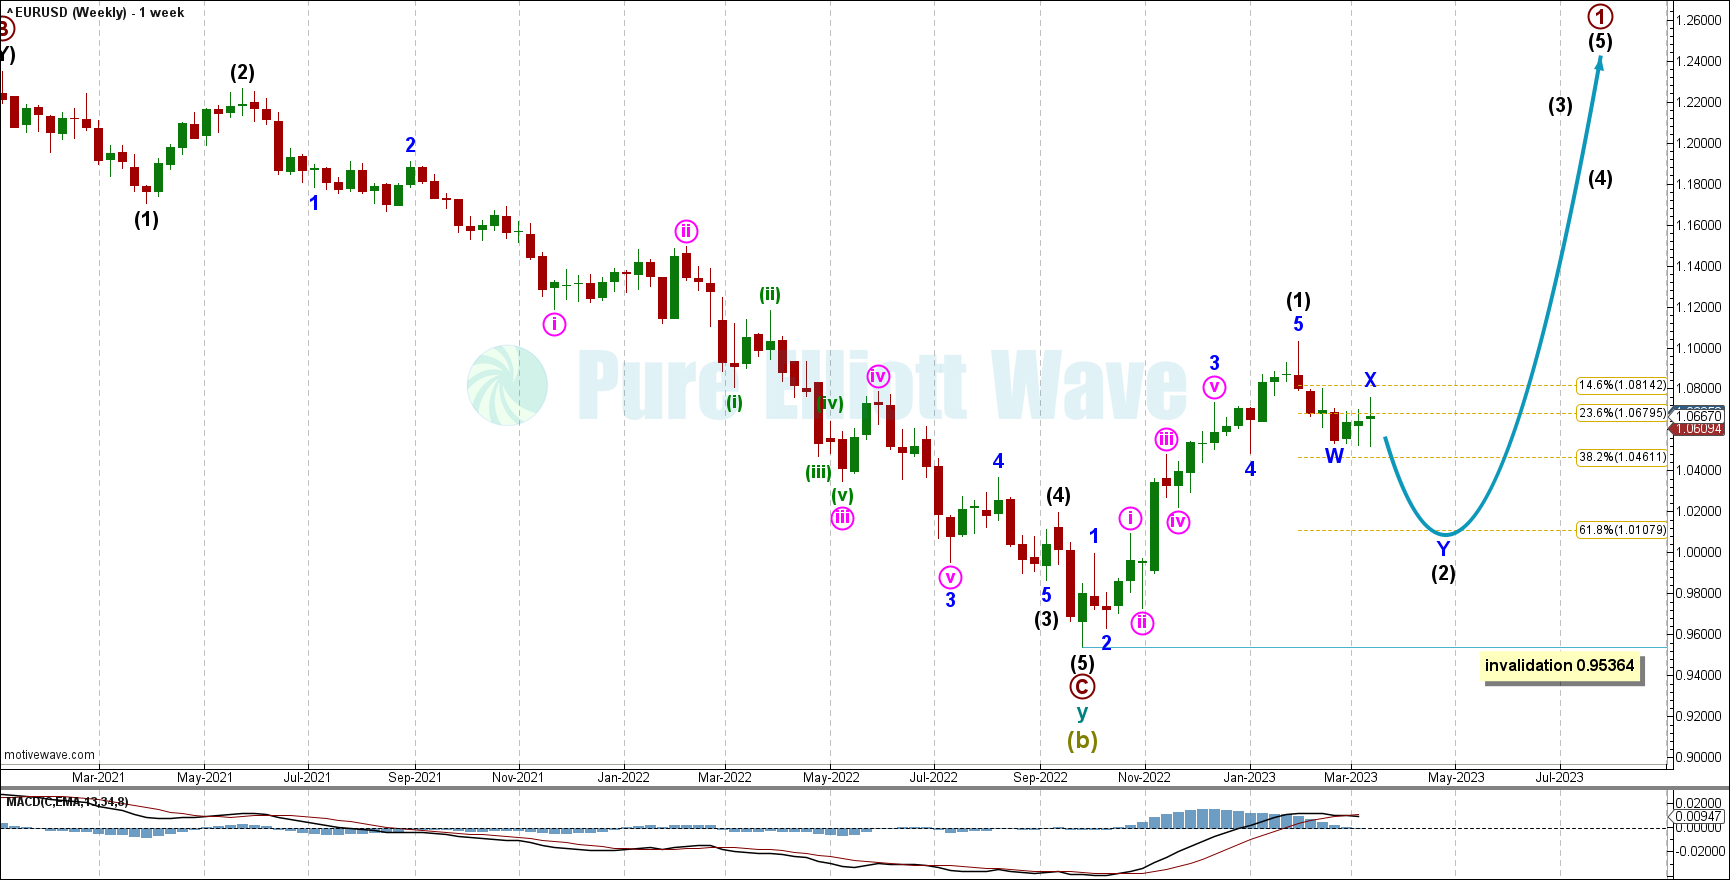
The weekly chart focusses on the end of Super Cycle wave (b) and the start of Super Cycle wave (c).
Within Super Cycle wave (c), cycle wave a must subdivide as a five wave motive structure. Primary wave 1 within cycle wave a would be most likely incomplete.
Within primary wave: Intermediate wave (1) may be over at the last high and now intermediate wave (2) may continue lower to find support about the 0.618 Fibonacci ratio of intermediate wave (1) at 1.01079.
Intermediate wave (1) lasted 18 weeks, 3 weeks short of a Fibonacci 21. Intermediate wave (2) may be expected to last about a Fibonacci 13 or 21 weeks in total, give or take about 2 either side of these numbers.
The most recent weekly candle has been labelled as the end of minor wave X.
Intermediate wave (2) may not move beyond the start of intermediate wave (1) below 0.95364.
DAILY CHART
Click chart to enlarge.
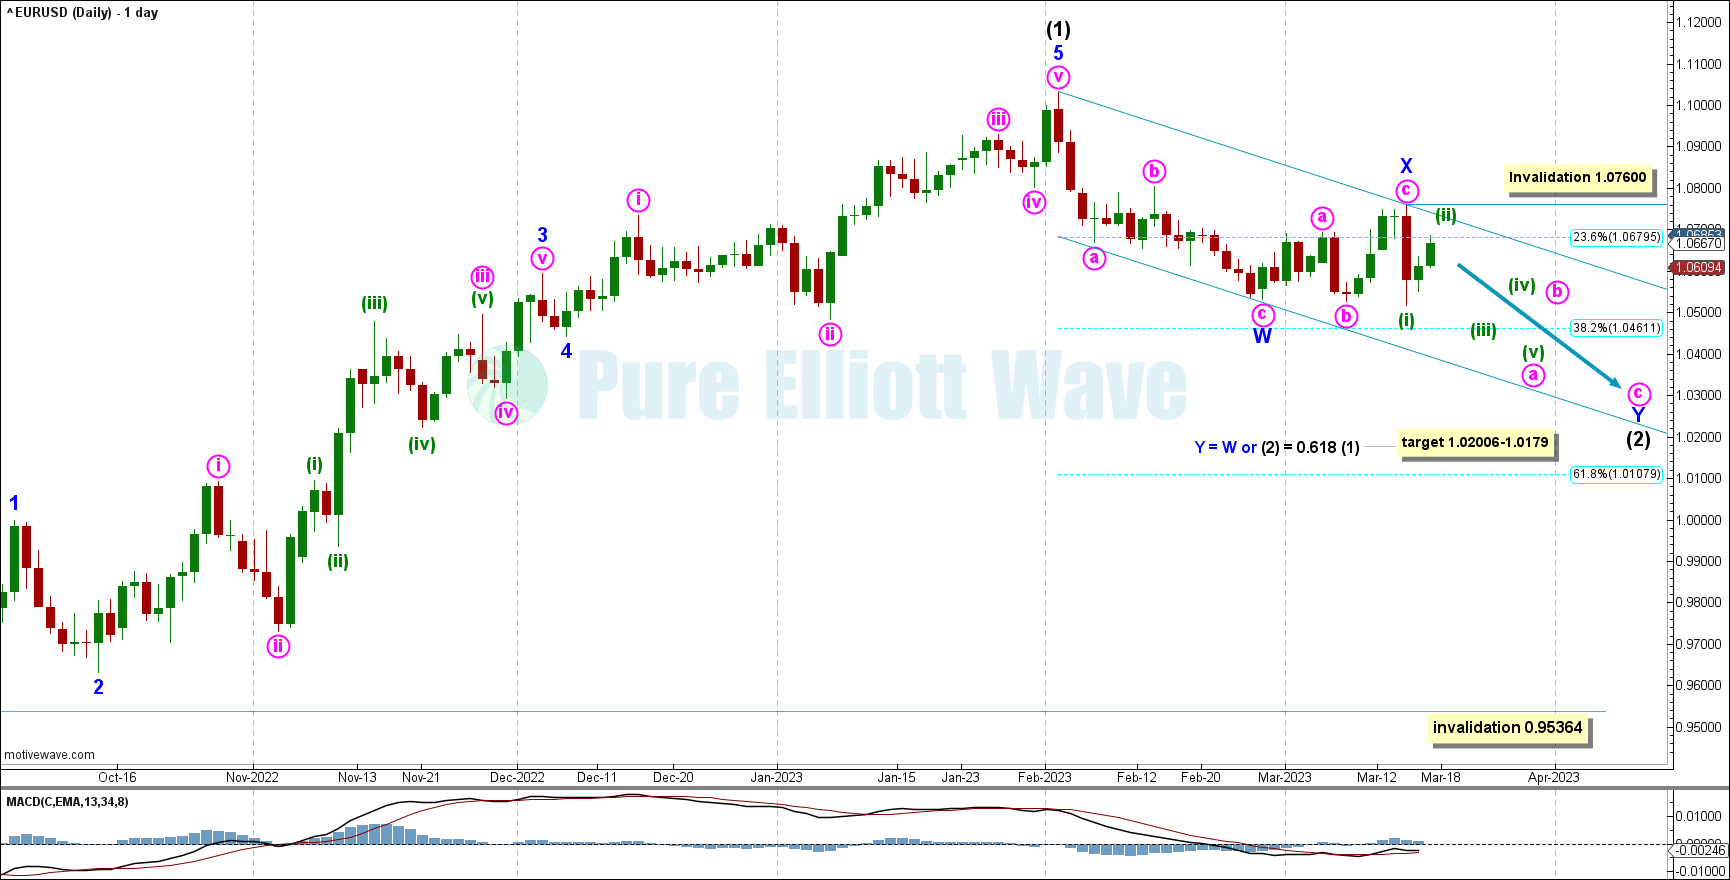
The daily chart focusses on intermediate waves (1) and (2).
Intermediate wave (2) may be unfolding as a double zigzag. Within the double, the first zigzag may be complete and is labelled minor wave W. The double is joined by a corrective structure in the opposite direction, an expanding flat labelled minor wave X, which may also be complete. The second zigzag in the double is labelled minor wave Y has just begun. The purpose of a second zigzag in a double is to deepen the correction when the first zigzag does not move price deep enough. If minor wave Y ends at the target zone, then this purpose would be achieved.
Within minute wave a of minor wave Y, minuette (i) subdivides as a very clean impulse, not a zig-zag, and is likely complete, which supports that minor wave X is complete.
Also within minute wave a of minor wave Y, minuette (ii) is nearly complete.
A target is calculated at two degrees. At 1.01079 intermediate wave (2) would reach the 0.618 Fibonacci ratio of intermediate wave (1). At 1.02006 minor wave Y would reach equality in length with minor wave W. This gives an 93 pip target zone.
HOURLY CHART
Click chart to enlarge.
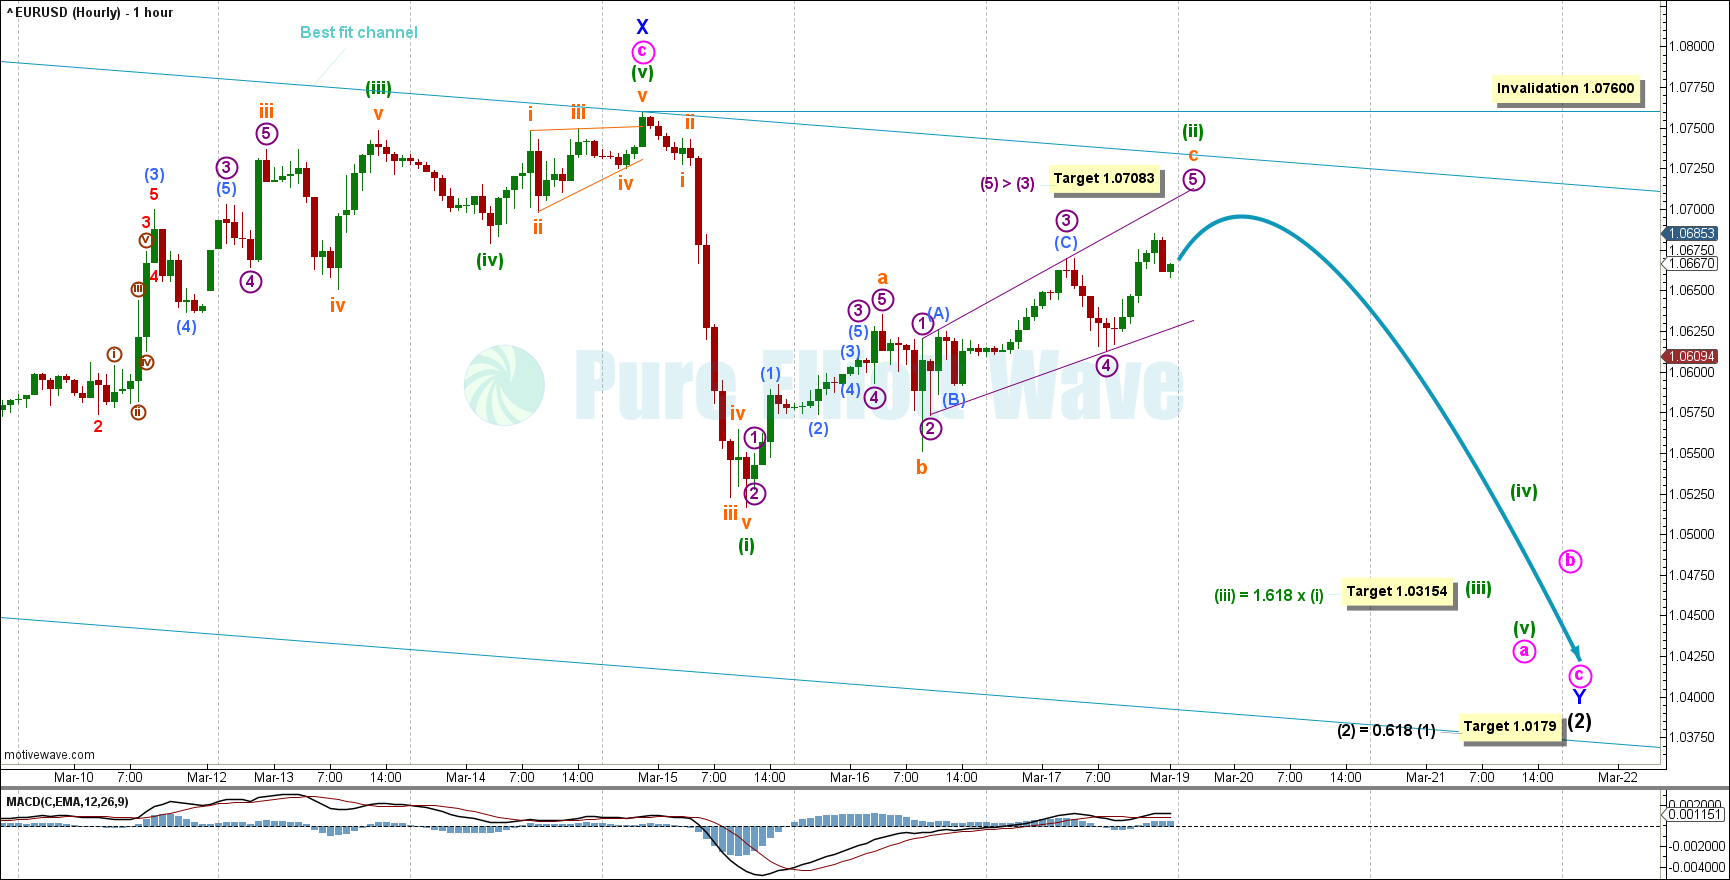
The hourly chart focusses on the start of minor wave Y.
Minor wave Y must subdivide as a zigzag. Within the zigzag, minute wave a may be incomplete. When minute wave a is complete, then a bounce or consolidation for minute wave b should unfold over a few days and may not move beyond the start of minute wave a above 1.07600.
Within minute wave a: Minuette (i) may be complete and minuette (ii) is nearing completion. Minuette (ii) appears to be subdividing as a zig-zag.
Subminuette wave c within minuette (ii) is nearly complete, subdividing as a possible ending expanding diagonal. Within subminuette wave c, micro wave 5 must be longer than micro wave 3, so a minimum upward target is calculated at 1.07083. Overhead, there is also resistance from the best fit channel which could see the end of price rising and minuette (iii) start to unfold shortly after.
A target has been calculated for minuette (iii) to reach 1.03154, or 1.618 the length of minuette (i).
For the short term, this wave count expects downwards movement.
TECHNICAL ANALYSIS
VOLUME
VOLUME WEEKLY CHART
Click chart to enlarge.
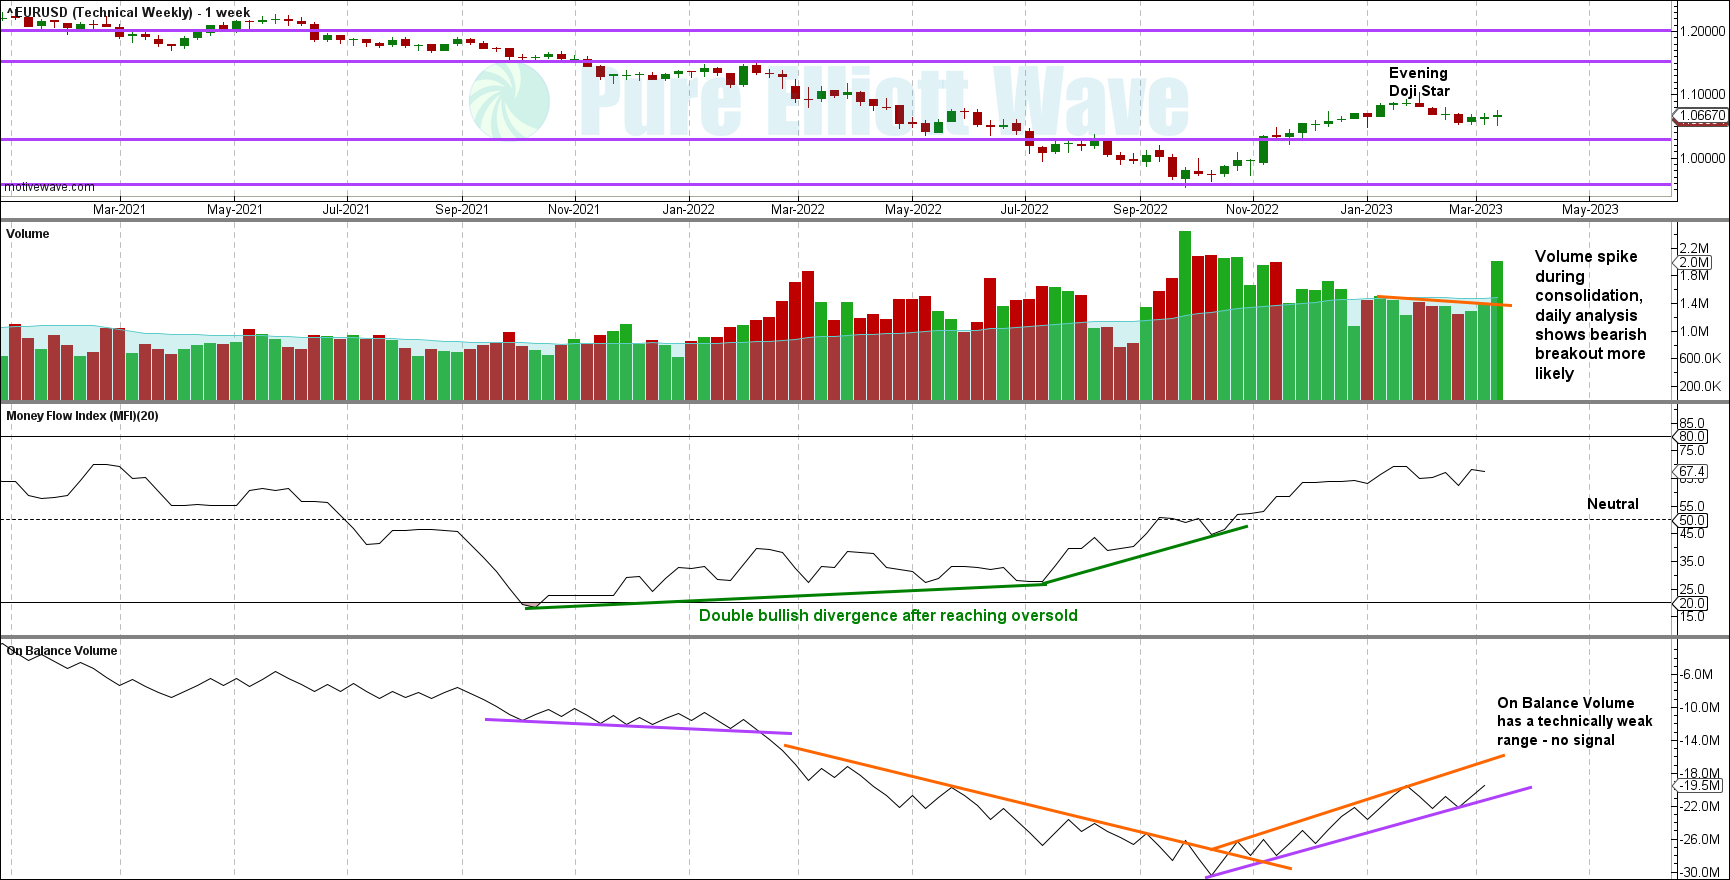
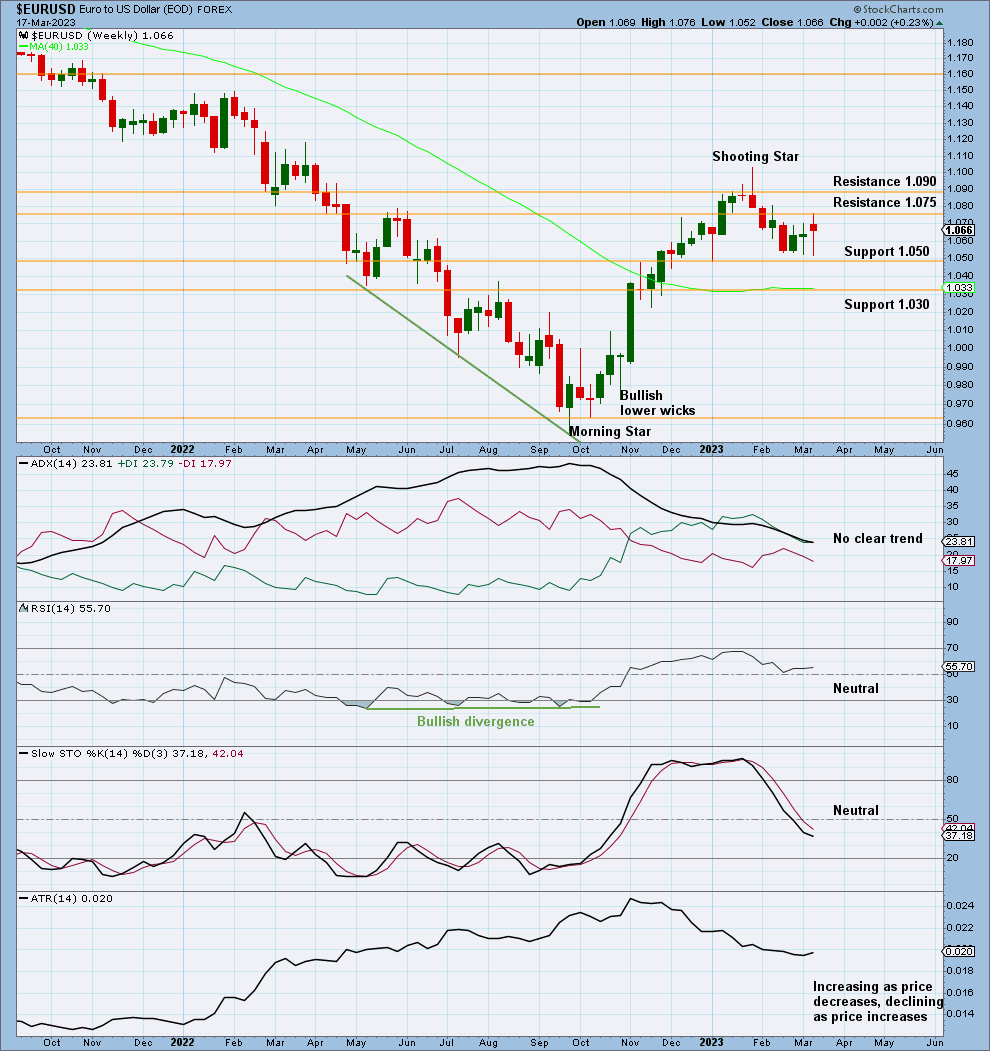
The volume profile is slightly bearish.
On balance volume shows a weak trading range with no signal.
Money flow remains neutral.
WEEKLY CHART
Click chart to enlarge.
Price is below resistance about 1.075. Support below is close at 1.050. If price breaks through 1.050, support remains thin below. Expect price to fall until it finds support and Stochastics reaches oversold. If Stochastics reaches oversold before price finds support, then price may not reach as low as 0.965.
VOLUME DAILY CHART
Click chart to enlarge.
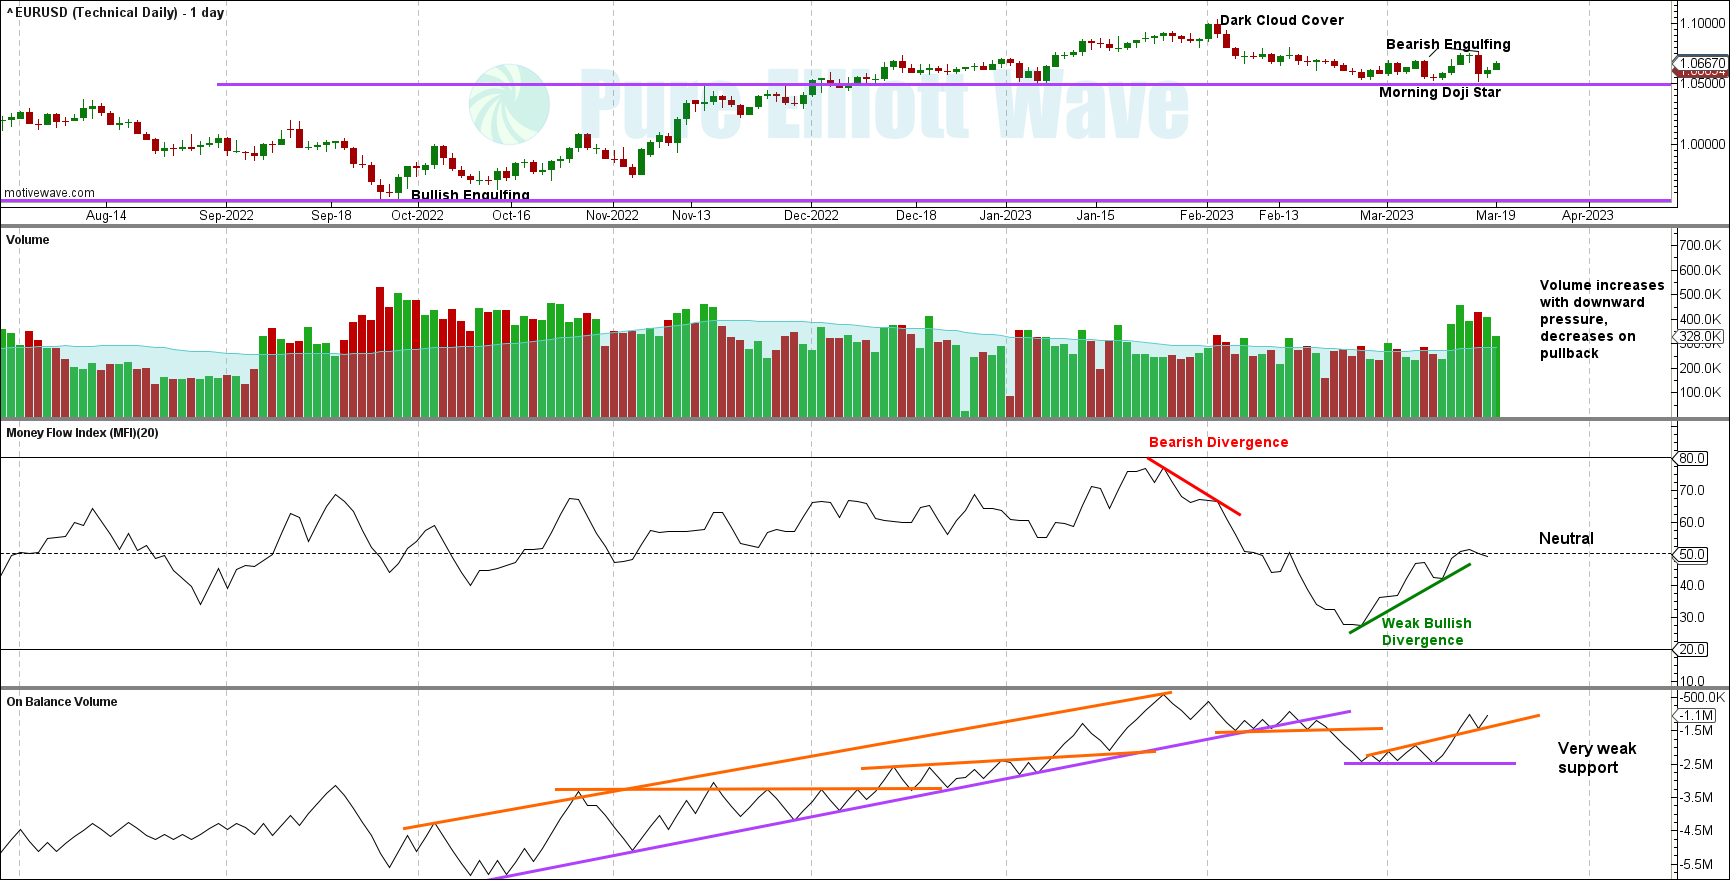
Over the past few days, volume increased with downwards movement and decreased with upwards movement, indicating bearish pressure.
Although money flow exhibited bullish divergence, this divergence is weak due to the low of the second pivot only being a few pips below the first. The bearish signals from other technicals below outweigh this signal.
On balance volume shows no new range, and trend lines recently breached lowers the significance of their strength.
DAILY CHART
Click chart to enlarge.
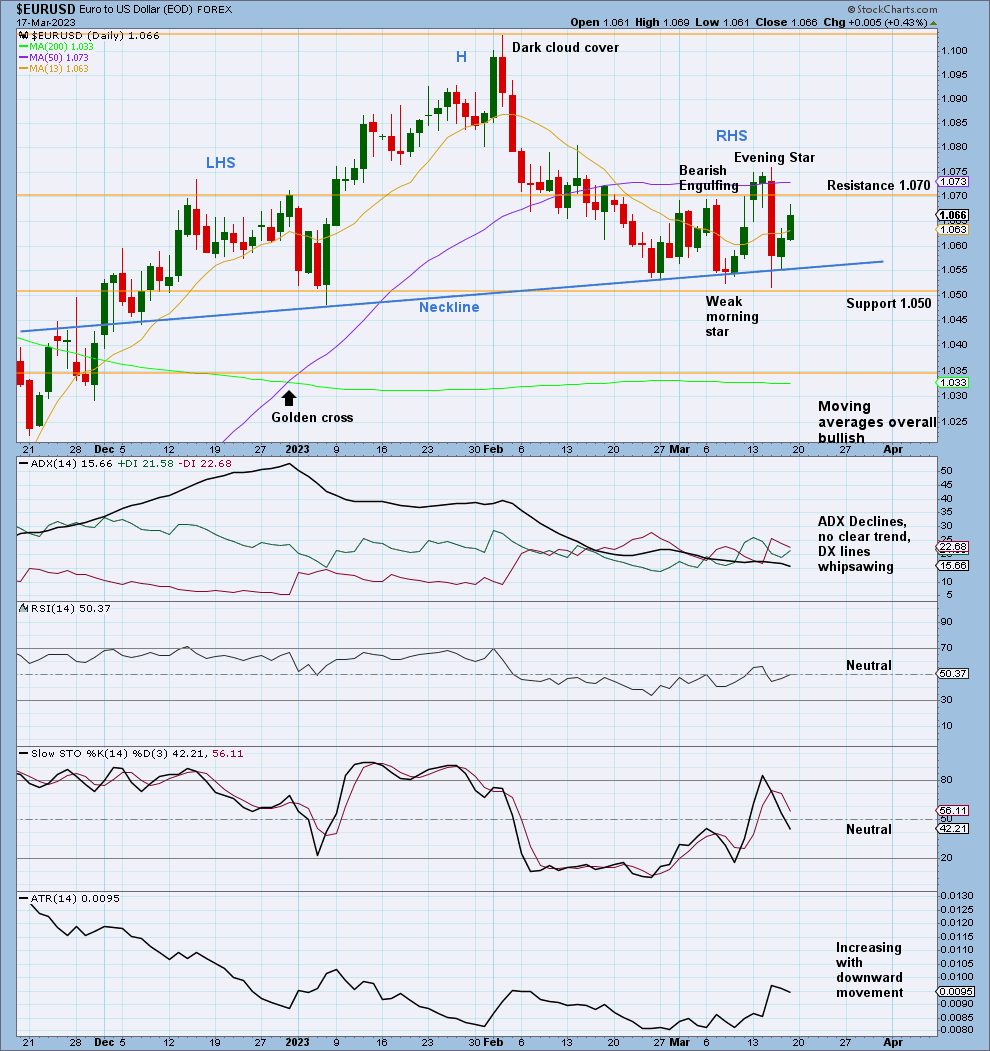
There is no clear trend at either the daily or weekly time frame.
A head and shoulders candlestick pattern has been cited on the chart, highlighted by the left shoulder (LHS), head (H), and right shoulder (RHS). A neckline was drawn from the bases of the heads where the shoulders connect. A candlestick closing below this neckline has a high probability of a downward trend developing.
This week also shows a strong evening star candlestick pattern, a large bullish candlestick, and push from volume to the downside.
ATR is increasing with downwards movement.
ADX whipsaws, which is common in consolidating markets.
If support at 1.050 is broken on a closing basis, then downwards momentum is expected.
Published @ 10:15 a.m. ET on March 19, 2023.
—
Careful risk management protects your trading account(s).
Follow my two Golden Rules:
1. Always trade with stops.
2. Risk only 1-5% of equity on any one trade.
—
New updates to this analysis are in bold.
—
 Save as PDF