April 14, 2023: EURUSD Elliott Wave and Technical Analysis – Video and Charts
For the short term, a pullback may continue lower to a target zone from 1.0179 to 0.99505. Thereafter, a strong third wave up may begin.
Recent slow price action shows we are still in minor wave B. Minor B is now 107% of minor A, indicating an expanded flat may be unfolding for intermediate wave (2). Minor wave C may be expected to move substantially below the end of minor wave A.
An alternate wave count shows minor wave B complete as an ending diagonal. Confidence and invalidation levels are close by to verify which wave count is more likely early next week.
Quarterly and monthly charts were last updated here.
WEEKLY CHART
Click chart to enlarge.
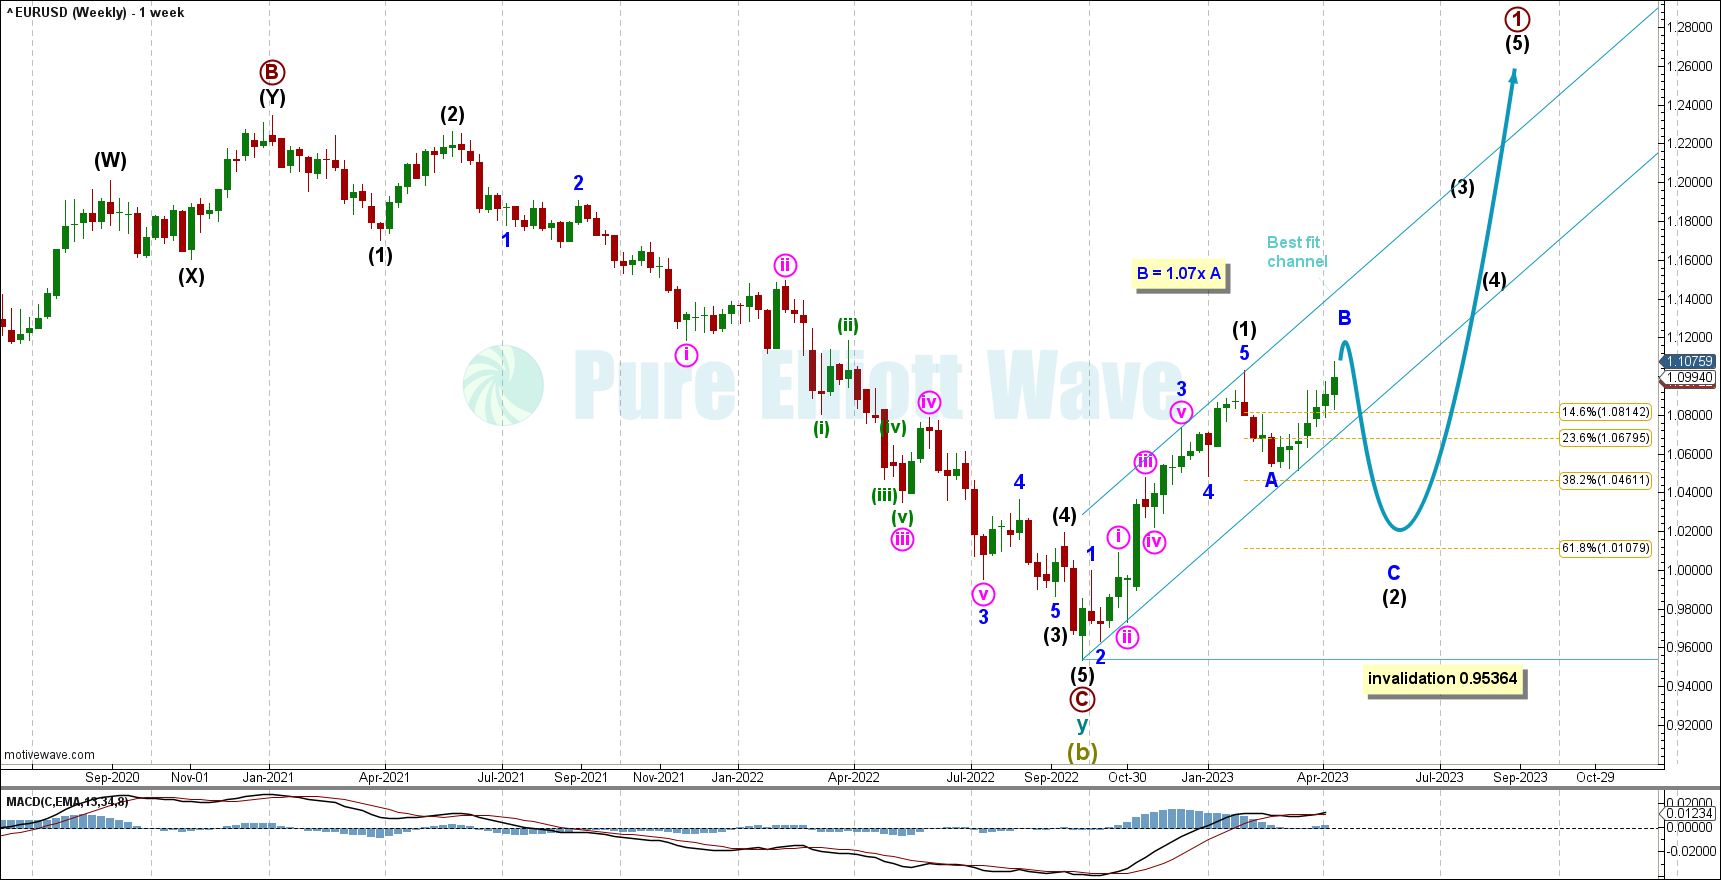
The weekly chart focusses on the end of Super Cycle wave (b) and the start of Super Cycle wave (c).
Within Super Cycle wave (c), cycle wave a must subdivide as a five wave motive structure. Primary wave 1 within cycle wave a would be most likely incomplete.
Within primary wave 1: Intermediate wave (1) may be over at the last high and now intermediate wave (2) may continue lower to find support about the 0.618 Fibonacci ratio of intermediate wave (1) at 1.01079. When wave B is complete, then one of these targets will be much more clear, and another clear target can be calculated based off the ratios of minor wave A and C. According to the daily and hourly wave counts, minor wave B is not complete yet.
Intermediate wave (1) lasted 18 weeks, 3 weeks short of a Fibonacci 21. Intermediate wave (2) may be expected to last about a Fibonacci 13 or 21 weeks in total, give or take about 2 either side of these numbers.
A best fit channel has been drawn to encompass all of the present upwards momentum. If price breaks below the best fit channel, then that may be an indication minor wave C may start.
Minor wave B is now longer than 1.05 times the length of minor wave A, indicating an expanded flat may be unfolding. Within an expanded flat, minor wave C may extend downwards 1.618 the length of minor A.
Intermediate wave (2) may not move beyond the start of intermediate wave (1) below 0.95364.
DAILY CHART
Click chart to enlarge.
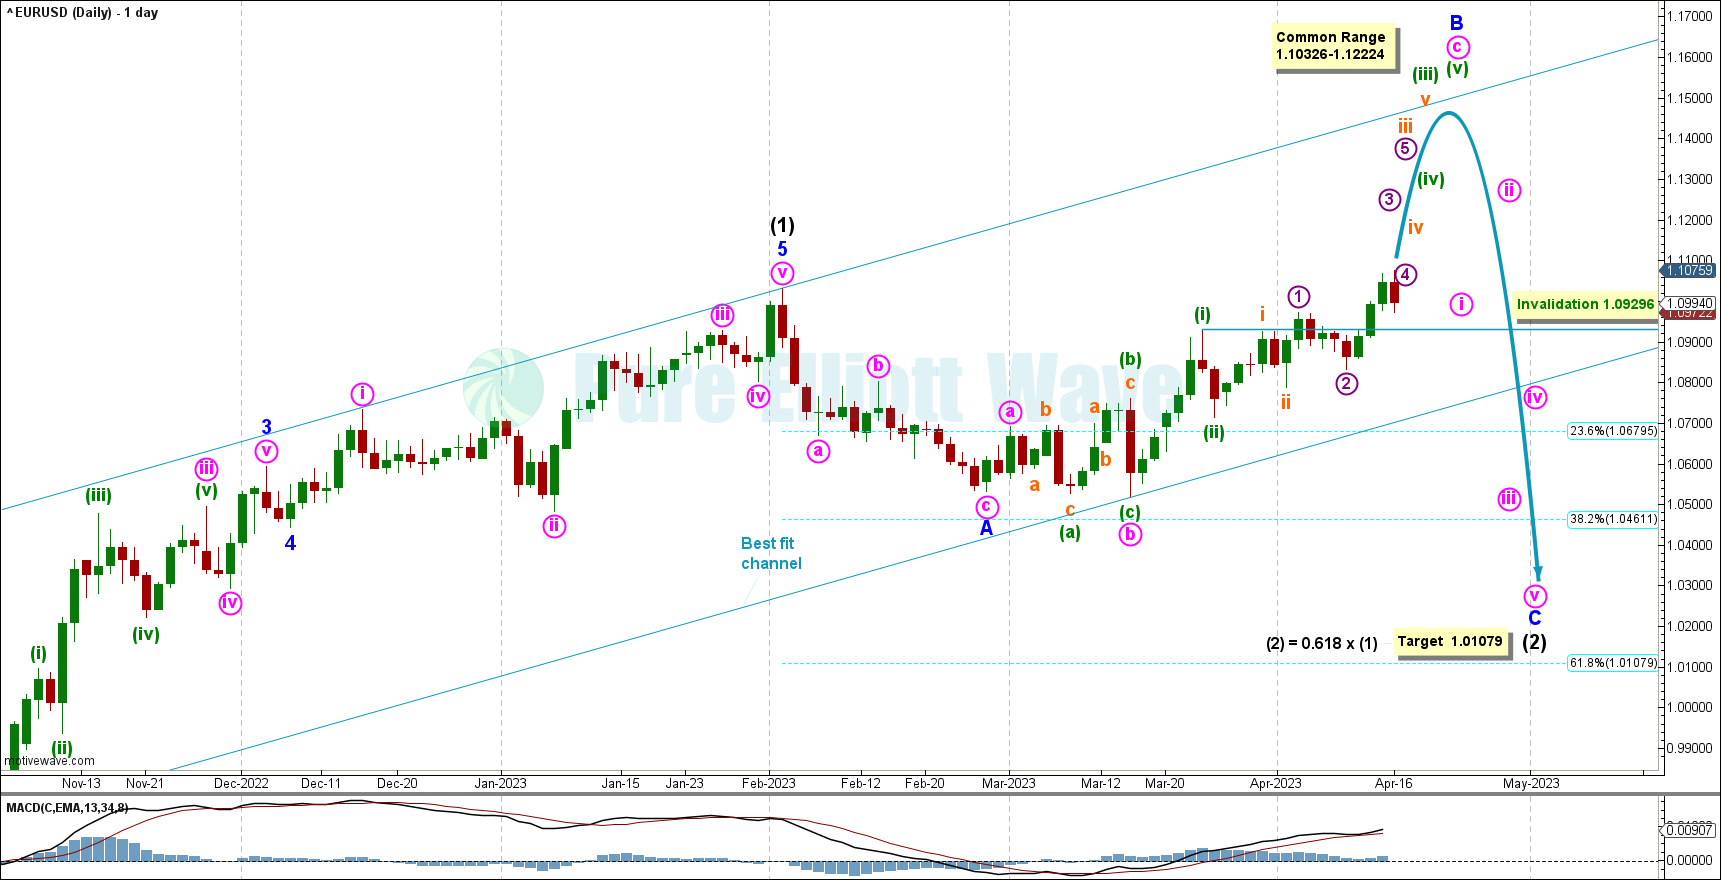
The daily chart focusses on intermediate waves (1) and (2).
With recent upwards movement from minor wave B, reaching 107% retracement of the three wave structure labeled as minor A, an expanded flat may be occurring, which is a common corrective structure.
Today’s (April 14th) red candlestick has overlapped micro wave 1, which means more extensions within the extension are happening, a very bullish scenario.
Invalidation is nearby at 1.09296, at which price enters the territory of minuette wave (i). If this level is breached, then I will label minor wave B as complete and use the alternate wave count below.
A common range is calculated for minor B to reach 1.05 to 1.38 times the length of minor wave A, from 1.10326 to 1.12224.
No bullish invalidation is given. Minor wave B may continue upwards and may be labeled a bullish trend if it reaches over 2 times the length of minor A, a very unlikely ratio between the two.
A clearer target will be calculated on the completion of minor wave B in this scenario, as minor A and C often exhibit relationships in expanded flats.
HOURLY CHART
Click chart to enlarge.
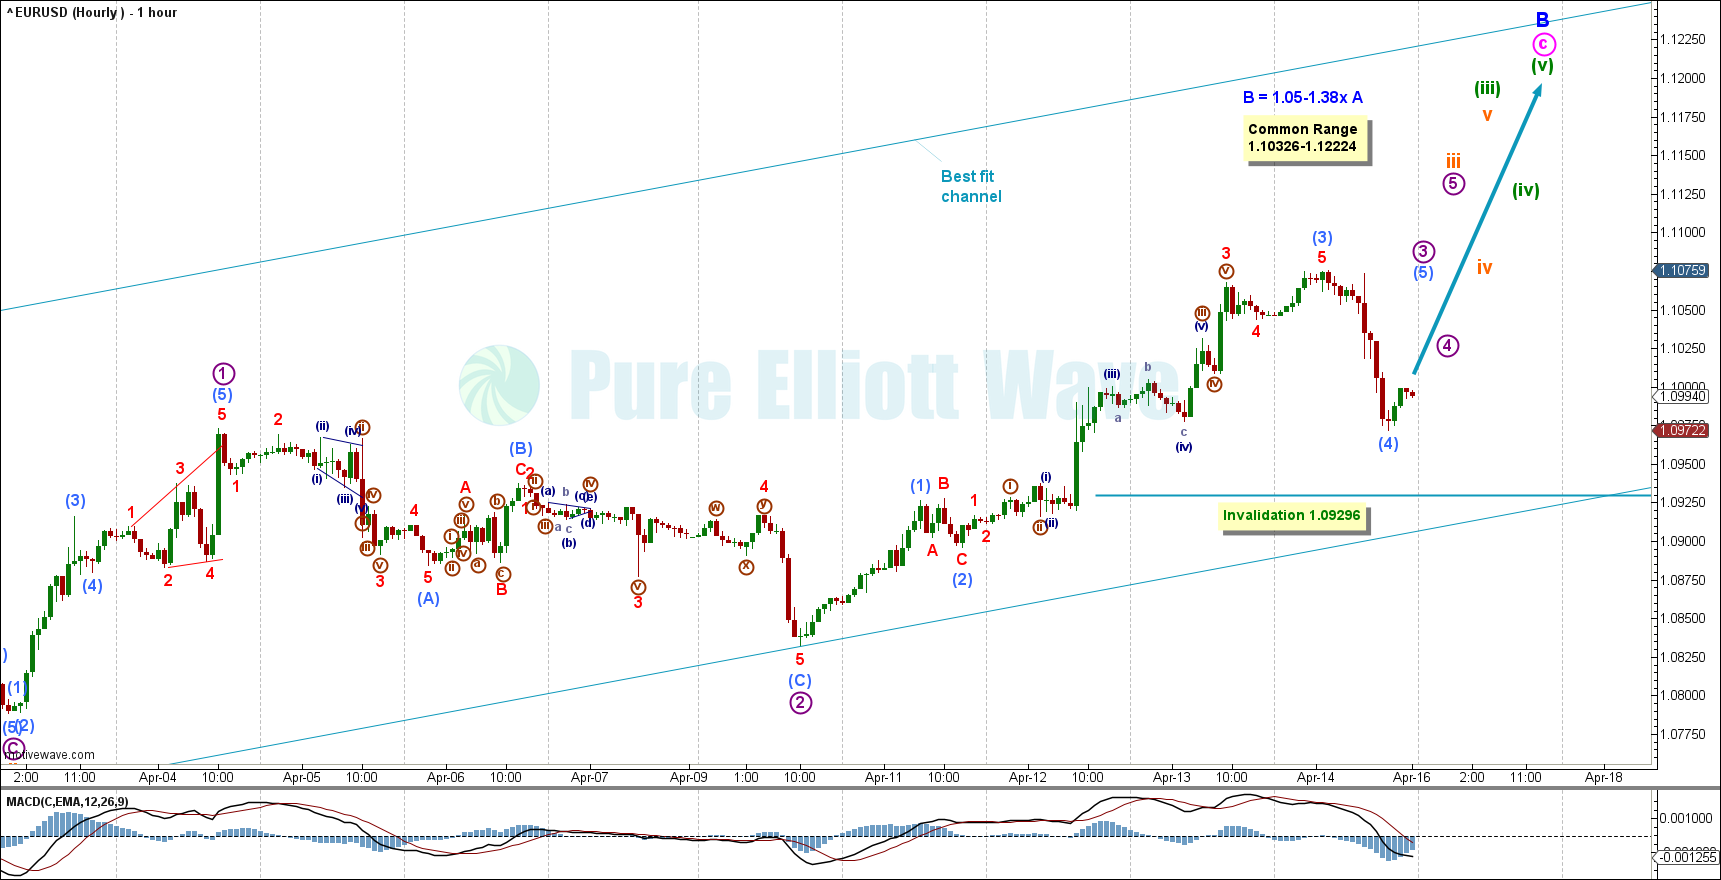
The hourly chart focusses on minute wave C within minor B.
Minor wave B shows multiple overlapping waves, so it may be a diagonal or an extended third wave. Price has overlapped with micro wave 1, so this cannot be micro wave 4, which indicates micro wave 3 may be incomplete. Another extension is expected to the upside. This wave count expects at least 4 more actionary waves upwards (waves in the direction of the upwards trend).
Invalidation is copied over from the daily chart, very close by at 1.09296. If this wave count is invalidated, then we will shift to the alternate below.
A best fit channel for minute C is drawn around price action. A daily candlestick below and not touching this channel would indicate bearish movement.
For the short term, upwards movement is expected to continue and then a sharp decline.
ALTERNATE DAILY CHART
Click chart to enlarge.
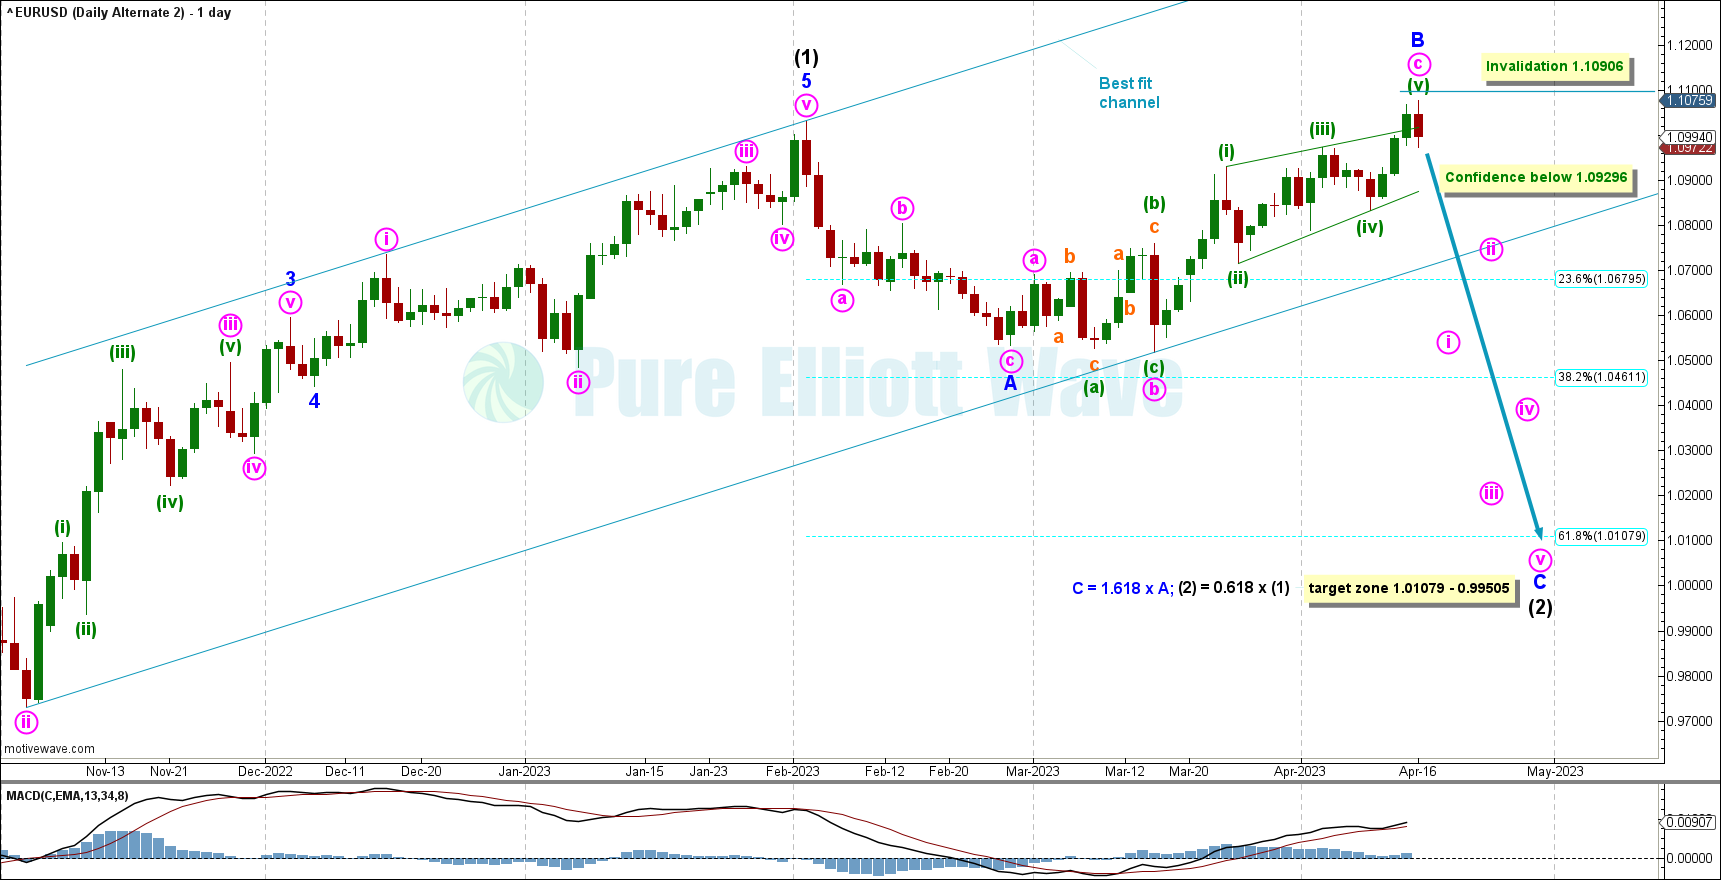
This alternate daily chart shows the possibility of minor wave B being complete, ending with an ending contracting diagonal. This is an alternate because minuette (i) counts most easily as an impulse.
Invalidation overhead is close by at 1.10906, where minuette (v) would exceed the length of minuette (iii). Confidence in this count would occur when the main wave count is invalidated at 1.09296.
With minor wave B complete, a target is calculated for minor wave C to reach 1.618 times the length of minor A at 0.99505, giving us a range from 1.01079 to 0.99505. This wave count is very bearish as diagonals often precede sharp movement.
ALTERNATE HOURLY CHART
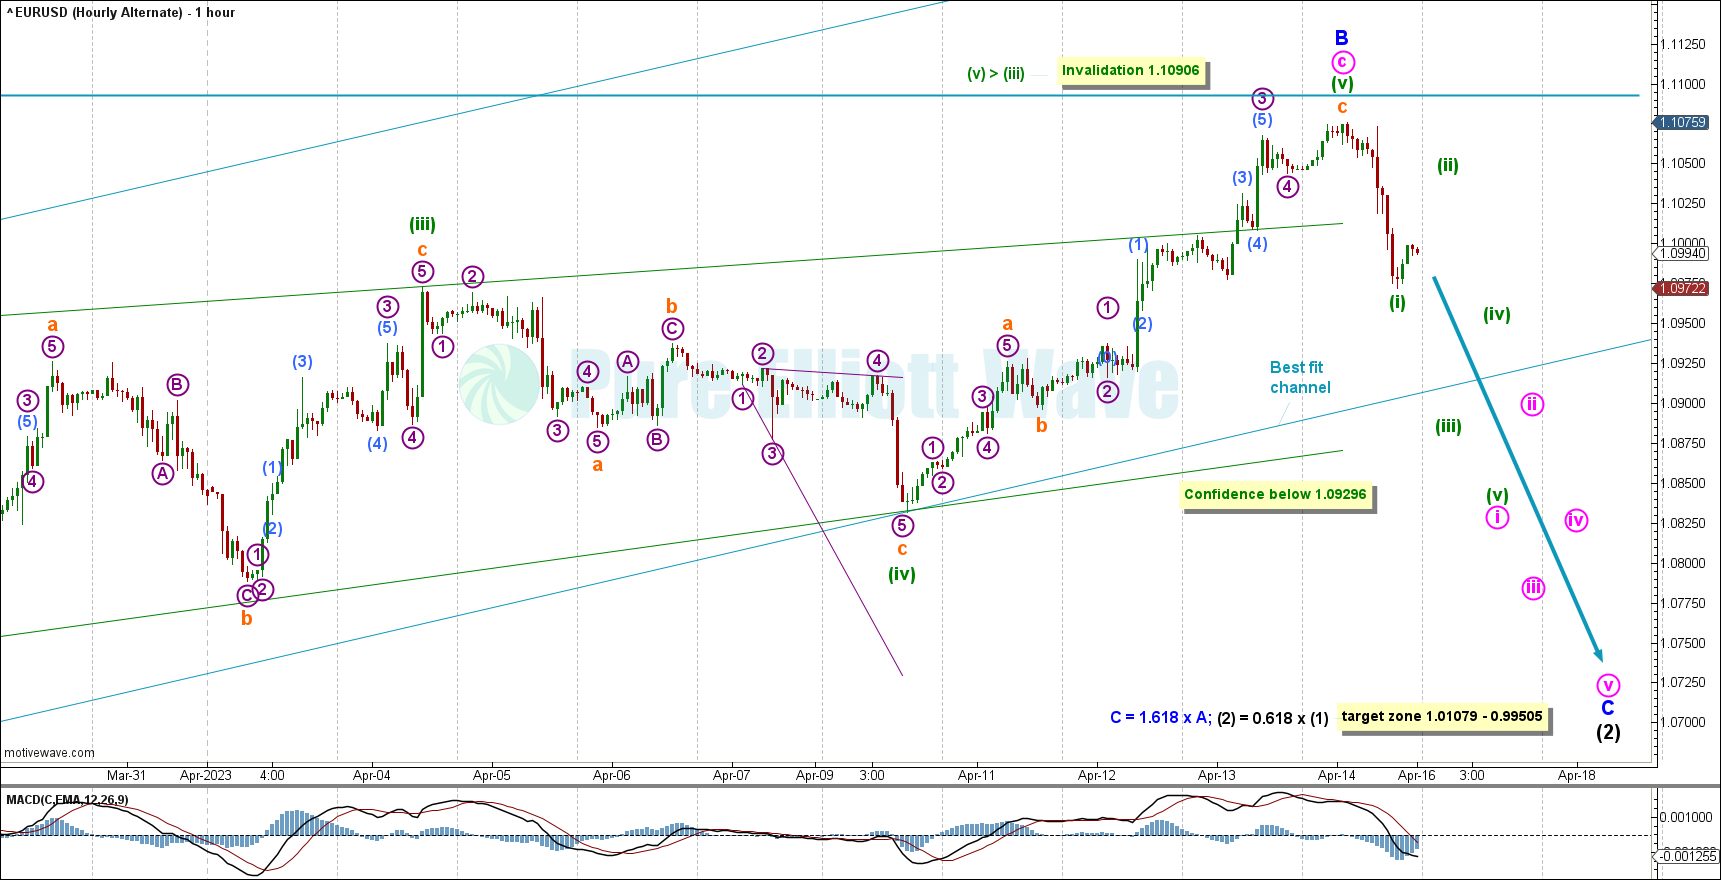
Click chart to enlarge.
On this alternate hourly chart close invalidation and confidence levels are noted.
Minor C may be already underway as a motive structure with minuette (i) already complete.
TECHNICAL ANALYSIS
VOLUME
VOLUME WEEKLY CHART
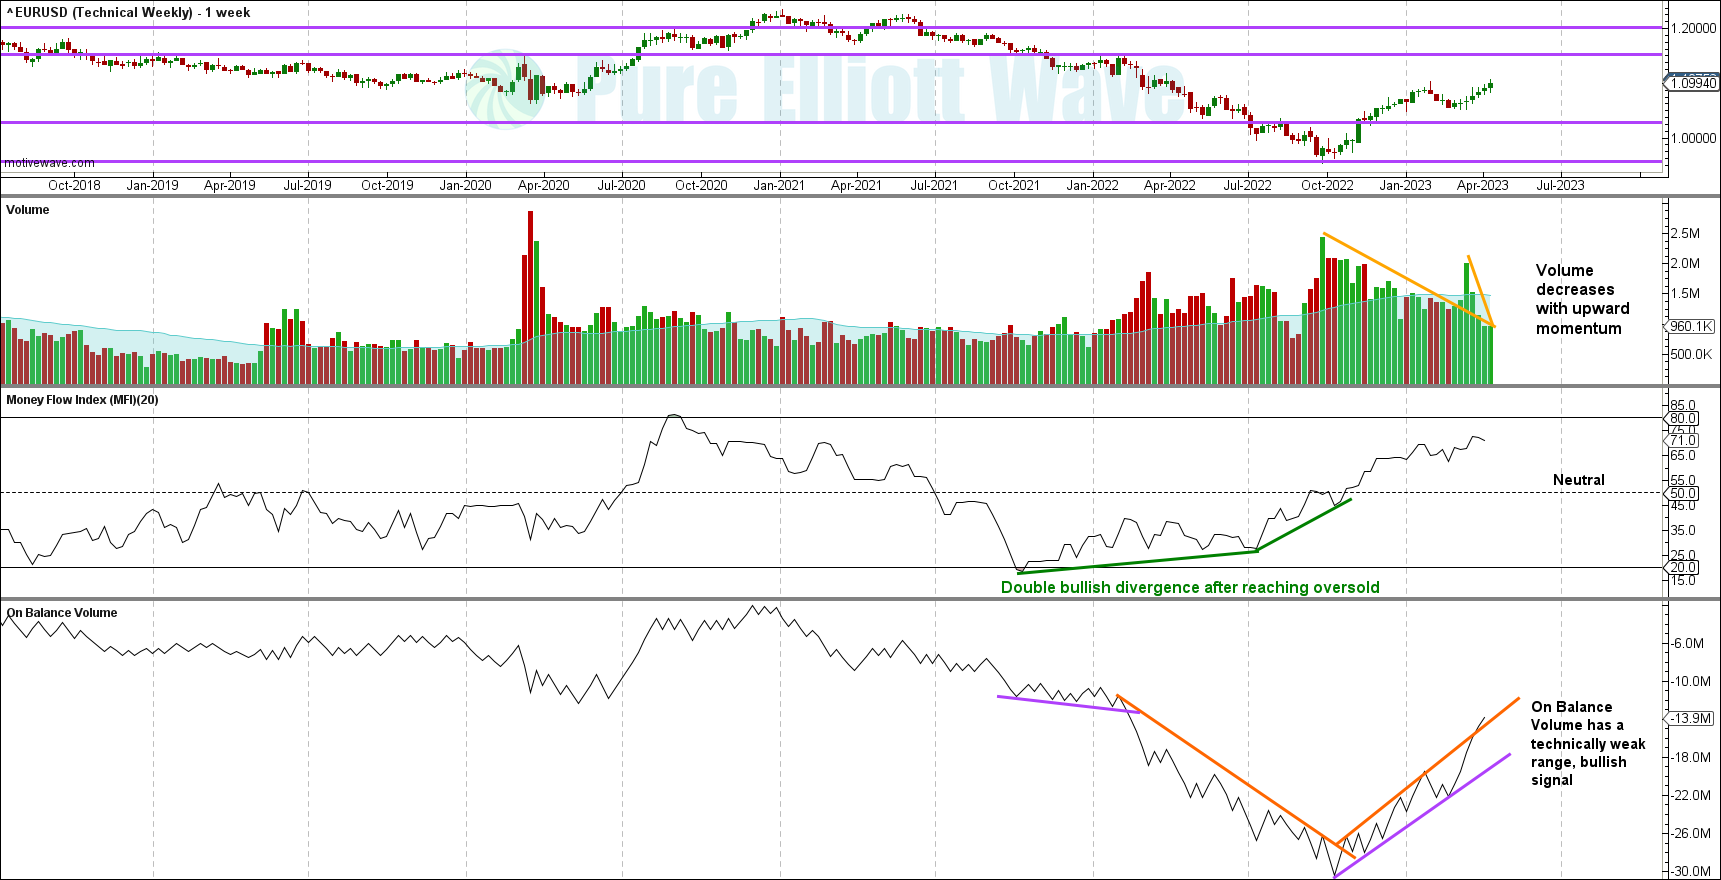
Click chart to enlarge.
The volume profile is bearish with severely decreasing volume with bullish momentum, which overshadows a weak on balance volume signal. This signal is weak due to the slope of the upwards sloping orange line, and only 2-3 tests of this line before the recent breach.
WEEKLY CHART
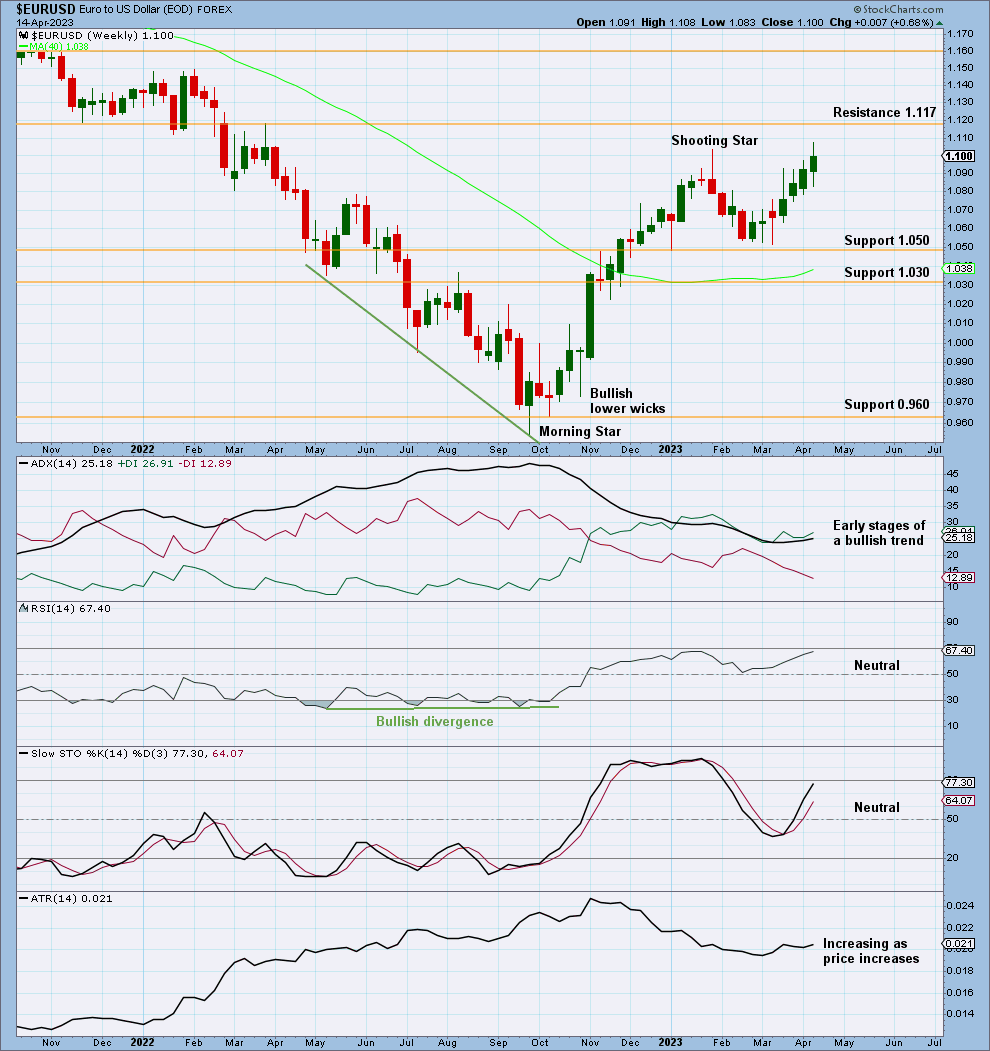
Click chart to enlarge.
This week’s candlestick broke previous resistance at 1.1000. Next overhead resistance sits at 1.1170.
ADX shows the early stages of a bullish trend with more to go.
This chart looks neutral to slightly bullish. Daily technicals provides more clarity.
VOLUME DAILY CHART
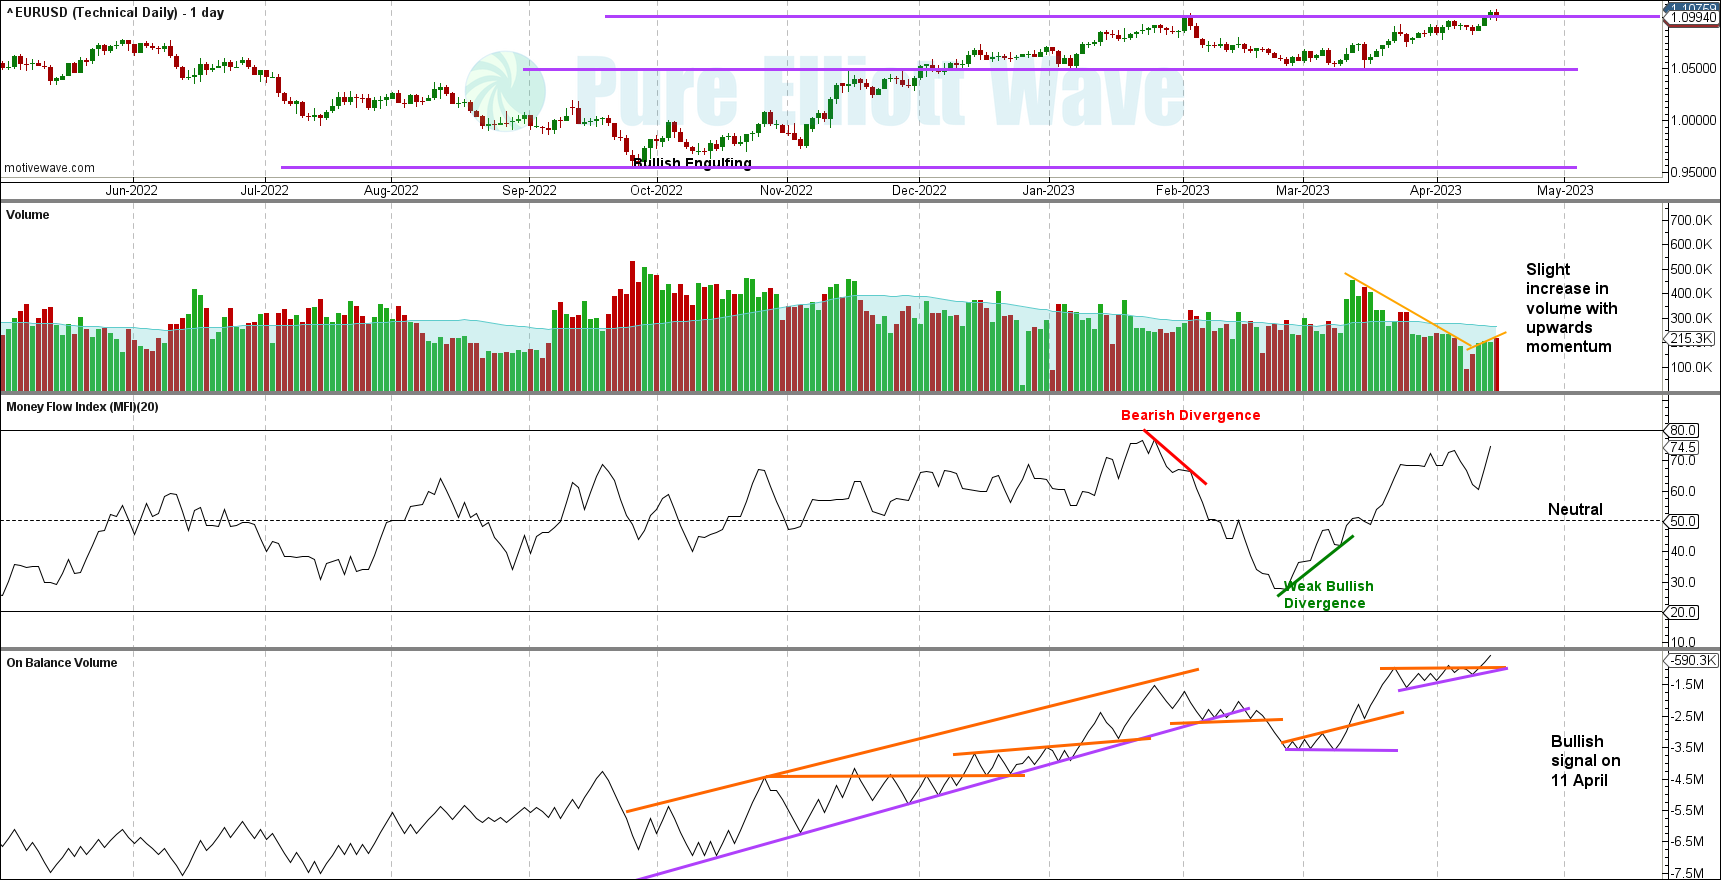
Click chart to enlarge.
Over the past month, volume has dramatically fallen with bullish movement. This is a bearish signal, a pullback is likely to occur. The last week had a very slight increase in volume with upwards momentum.
Although money flow exhibited bullish divergence, this divergence is weak due to the low of the second pivot only being a few pips below the first. The bearish signals from other technicals outweigh this signal.
On balance volume signalled a bullish breakout on April 4th and April 11th, 2023.
DAILY CHART
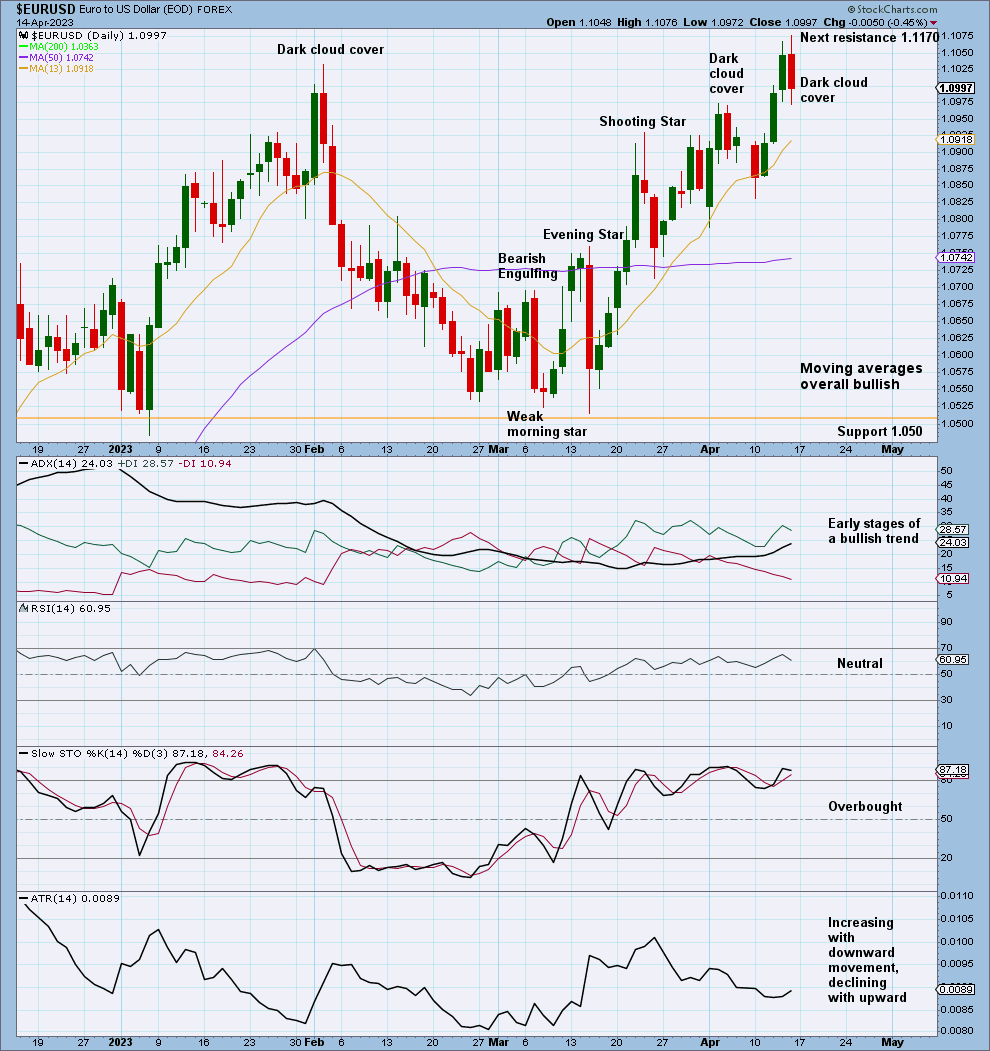
Click chart to enlarge.
The previous head and shoulders pattern was invalidated with the break over 1.1000 resistance.
Today’s dark cloud cover sends a strong bearish signal.
The moving averages are very bullish, all sloping up, with the 13 day above the 50 and the 50 day above the 200.
This chart is neutral. While ADX and RSI are not yet indicating that the upwards trend is extreme and overbought, two recent dark cloud cover patterns are countering this. Once the Elliott Wave invalidation levels are breached, we will have a clearer indication of the direction of the next movement.
Published @ 01:53 p.m. ET on April 17, 2023.
—
Careful risk management protects your trading account(s).
Follow Lara’s two Golden Rules:
1. Always trade with stops.
2. Risk only 1-5% of equity on any one trade.
—
New updates to this analysis are in bold.
—
 Save as PDF