April 21, 2023: EURUSD Elliott Wave and Technical Analysis – Video and Charts
Summary: The bigger picture for Euro expects overall upwards movement for the long term, most likely to not make a new high above 1.60380.
For the short term, a pullback may continue lower to a target zone from 1.0179 to 0.99505. Thereafter, a strong third wave up may begin.
Alternatively, the pullback may be complete and now a third wave up to a target at 1.29378 has started.
Quarterly and monthly charts were last updated here.
WEEKLY CHART
Click chart to enlarge.
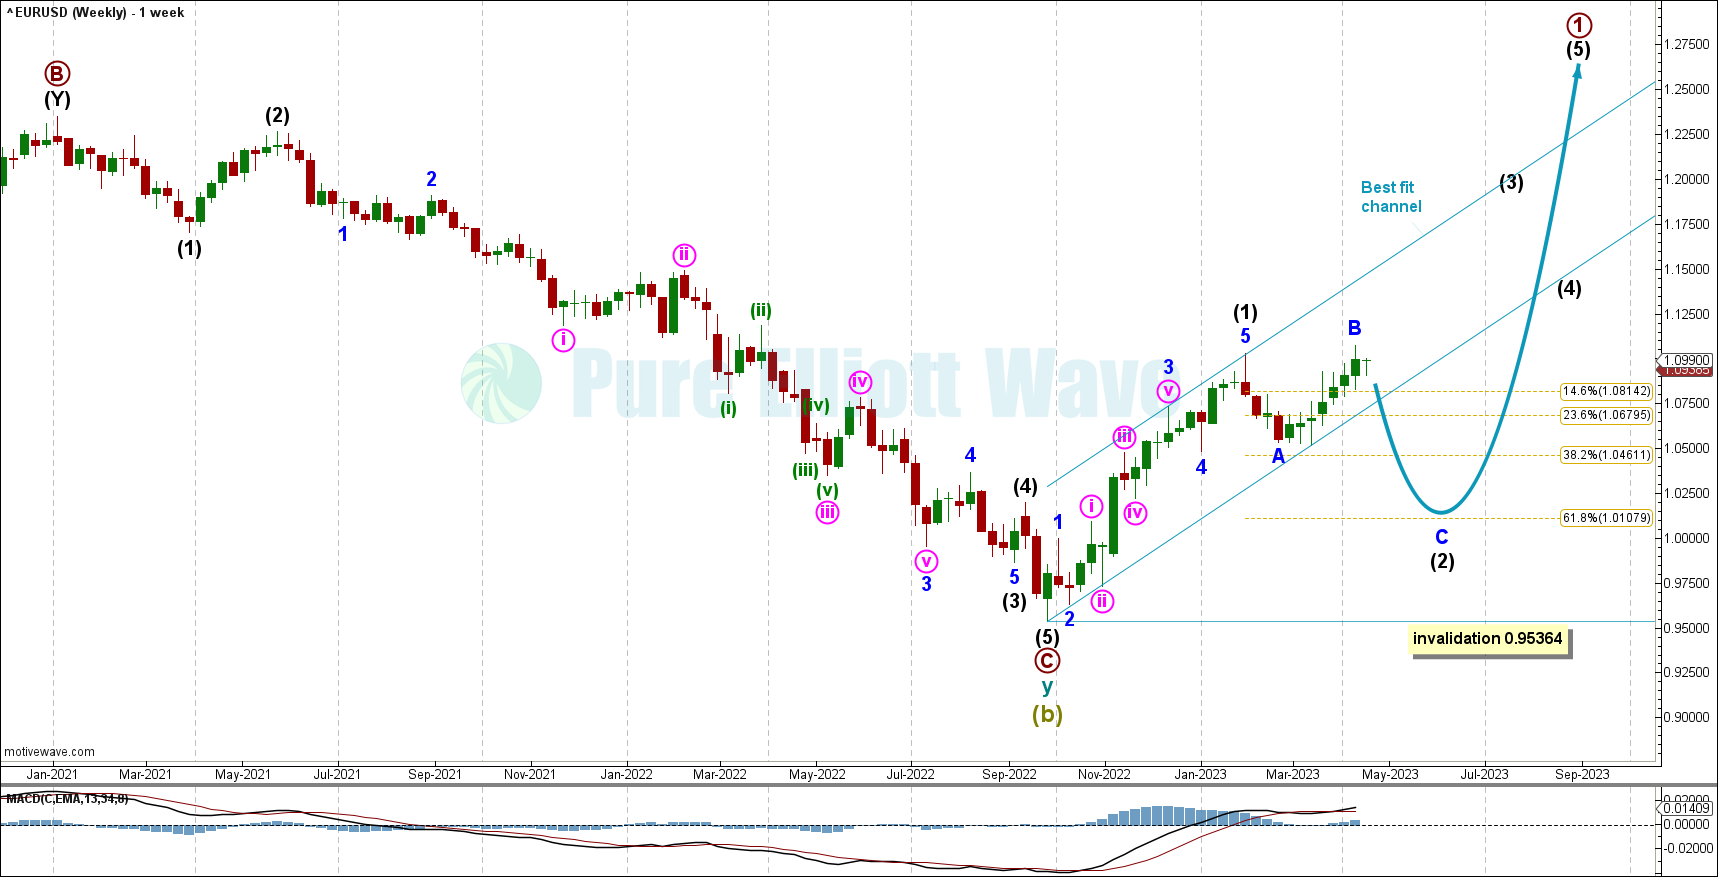
The weekly chart focusses on the end of Super Cycle wave (b) and the start of Super Cycle wave (c).
Within Super Cycle wave (c), cycle wave a must subdivide as a five wave motive structure. Primary wave 1 within cycle wave a would be most likely incomplete.
Within primary wave 1: Intermediate wave (1) may be over at the previous high and now intermediate wave (2) may continuing to find support about the 0.618 Fibonacci ratio of intermediate wave (1) at 1.01079.
Intermediate 2 may be unfolding as an expanded flat with minor B reaching 107% the length of wave A. Expanded flats are common structures. Wave C is expected to unfold to the downside in the coming weeks.
A best fit channel has been drawn to encompass all of the present upwards movement. If price breaks below the best fit channel, then that would provide confidence the trend has changed from up to down.
Intermediate wave (2) may not move beyond the start of intermediate wave (1) below 0.95364.
DAILY CHART
Click chart to enlarge.
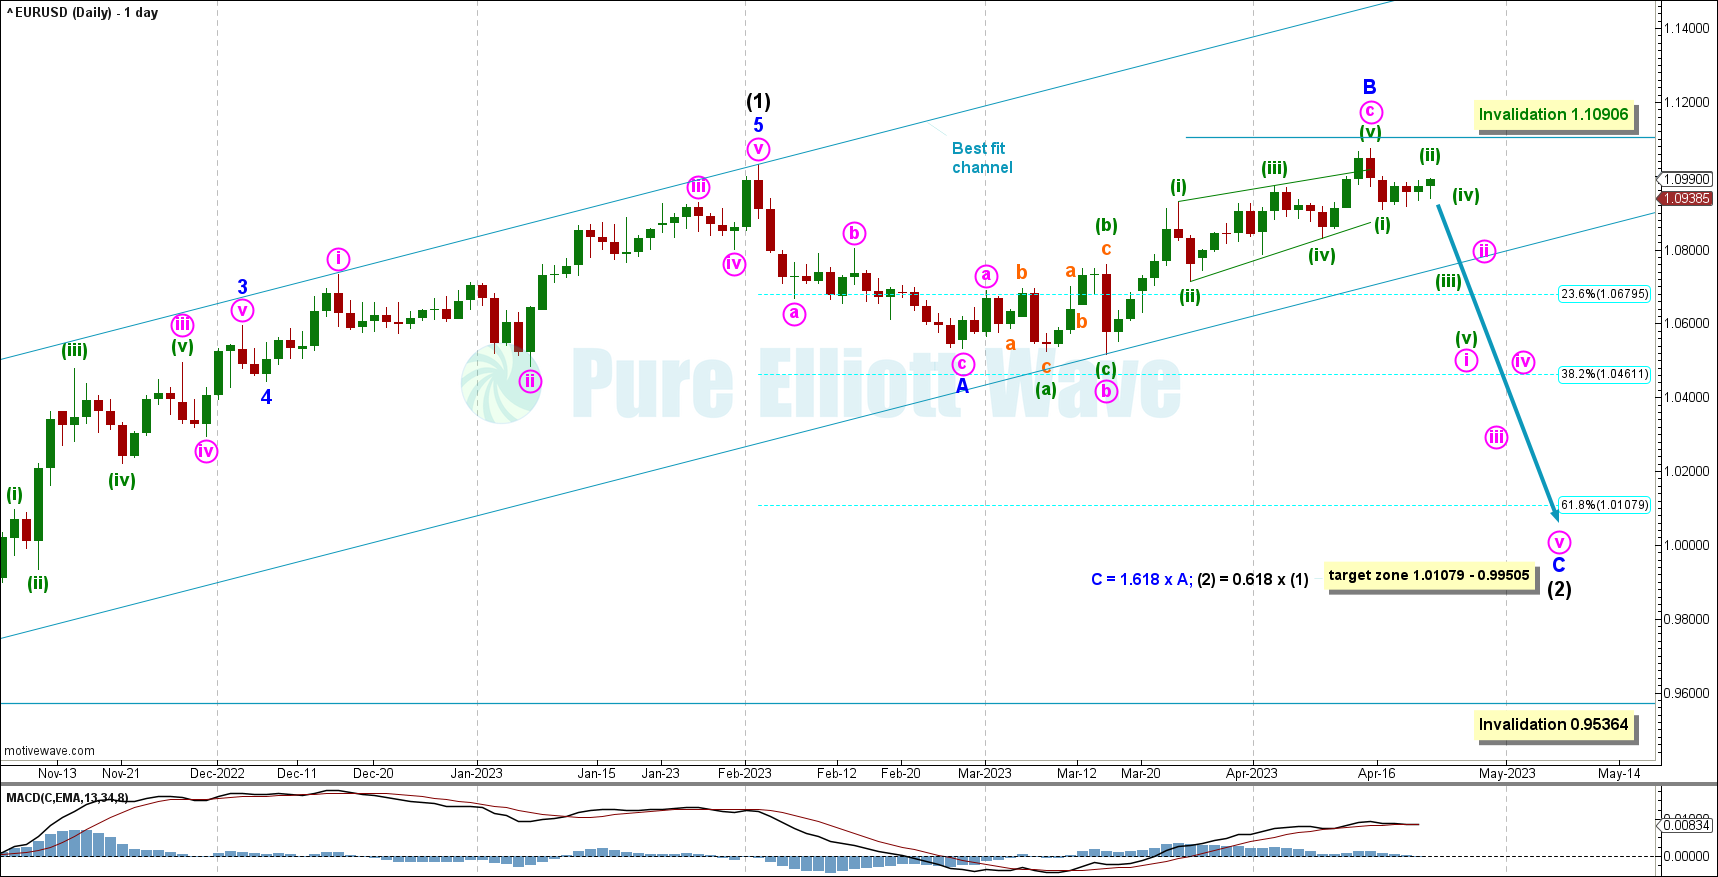
The daily chart focuses on intermediate waves (1) and (2).
Last week this wave count was an alternate. After price moved below 1.09296, this daily chart became the main wave count.
Minor B is now labeled as complete. Minor C must unfold as a motive structure downwards.
Within the zigzag of minor wave B, minute wave c may have completed as an ending contracting diagonal. Within the diagonal, minuette wave (v) is shorter than minuette wave (iii) and minuette wave (iii) is shorter than minuette wave (i). If minuette wave (v) continues any higher, then it may not be longer than minuette wave (iii), so that the rules regarding wave lengths for contracting diagonals are met. Minuette wave (v) may not move above 1.10906.
If 1.10906 is breached, then defer to the alternate below.
With minor wave B complete, a target is calculated for minor wave C to reach 1.618 times the length of minor A at 0.99505, giving us a range from 1.01079 to 0.99505. This wave count is very bearish as diagonals often precede sharp movement.
HOURLY CHART
Click chart to enlarge.
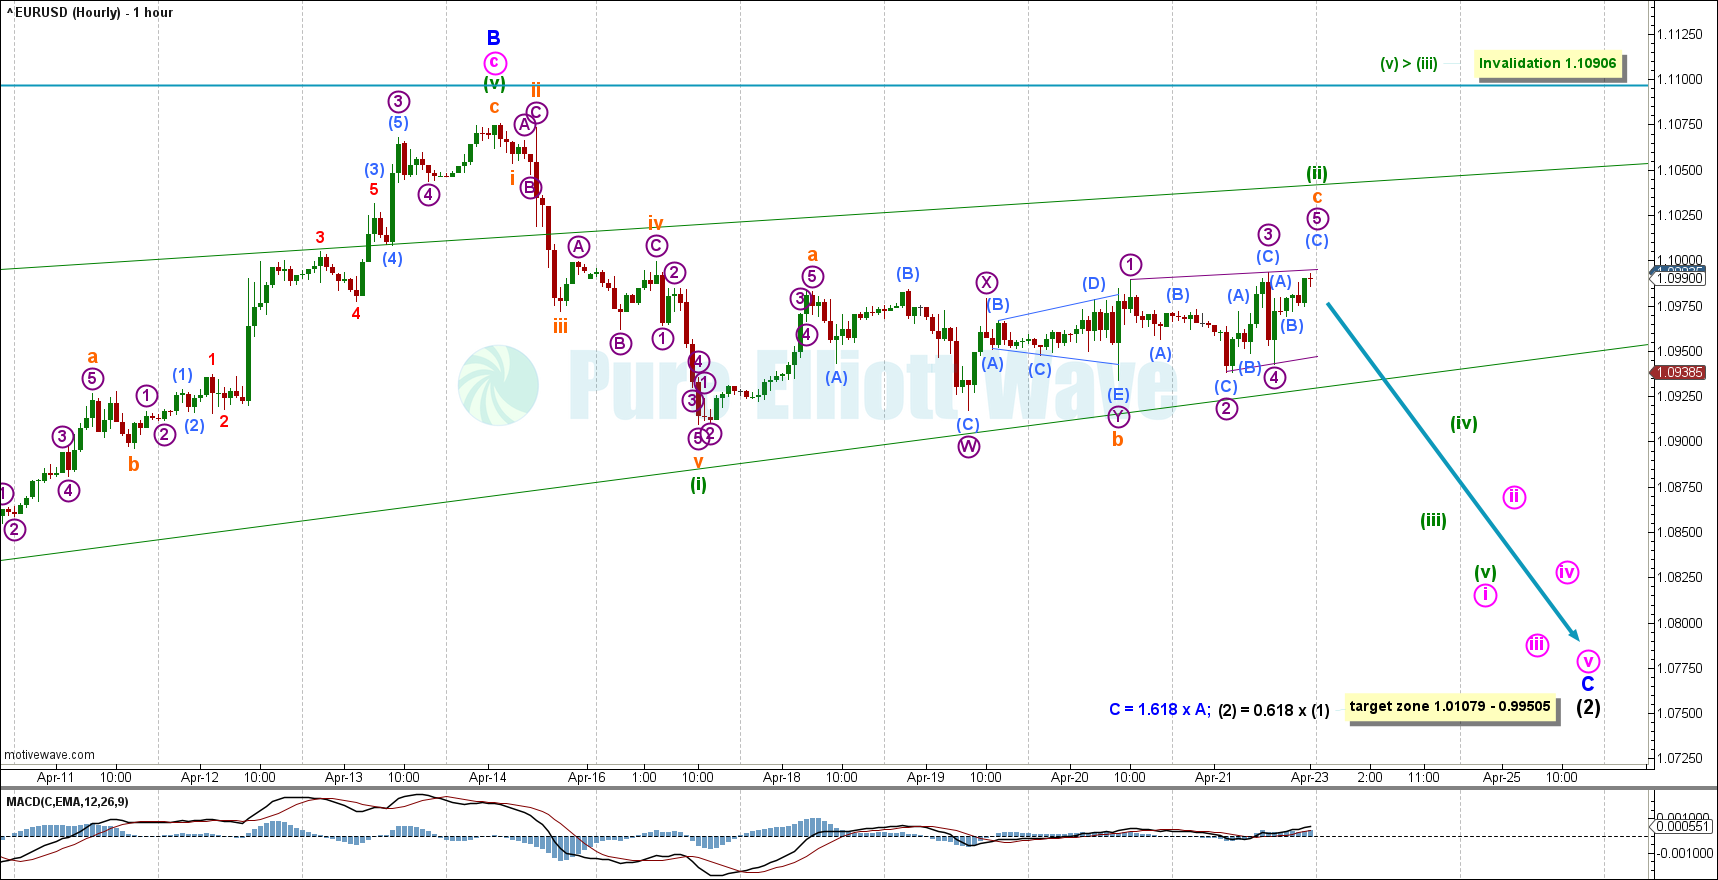
The hourly chart focuses on the beginning of minor wave C.
A 5 wave motive structure has been labeled as minuette (i) and a subsequent sideways corrective structure nearing completion has been labeled as minuette (ii). Minuette (ii) is labeled as a zigzag with subminuette a and c subdividing as motive structures and a complex wave B connecting them as a double combination. Subminuette c may be nearing completion as a ending contracting diagonal.
Invalidation overhead is close by at 1.10906. If this wave count is invalidated, then we will shift to the alternate below.
For the short term, a downwards trend is expected to continue.
ALTERNATE WEEKLY CHART
Click chart to enlarge.
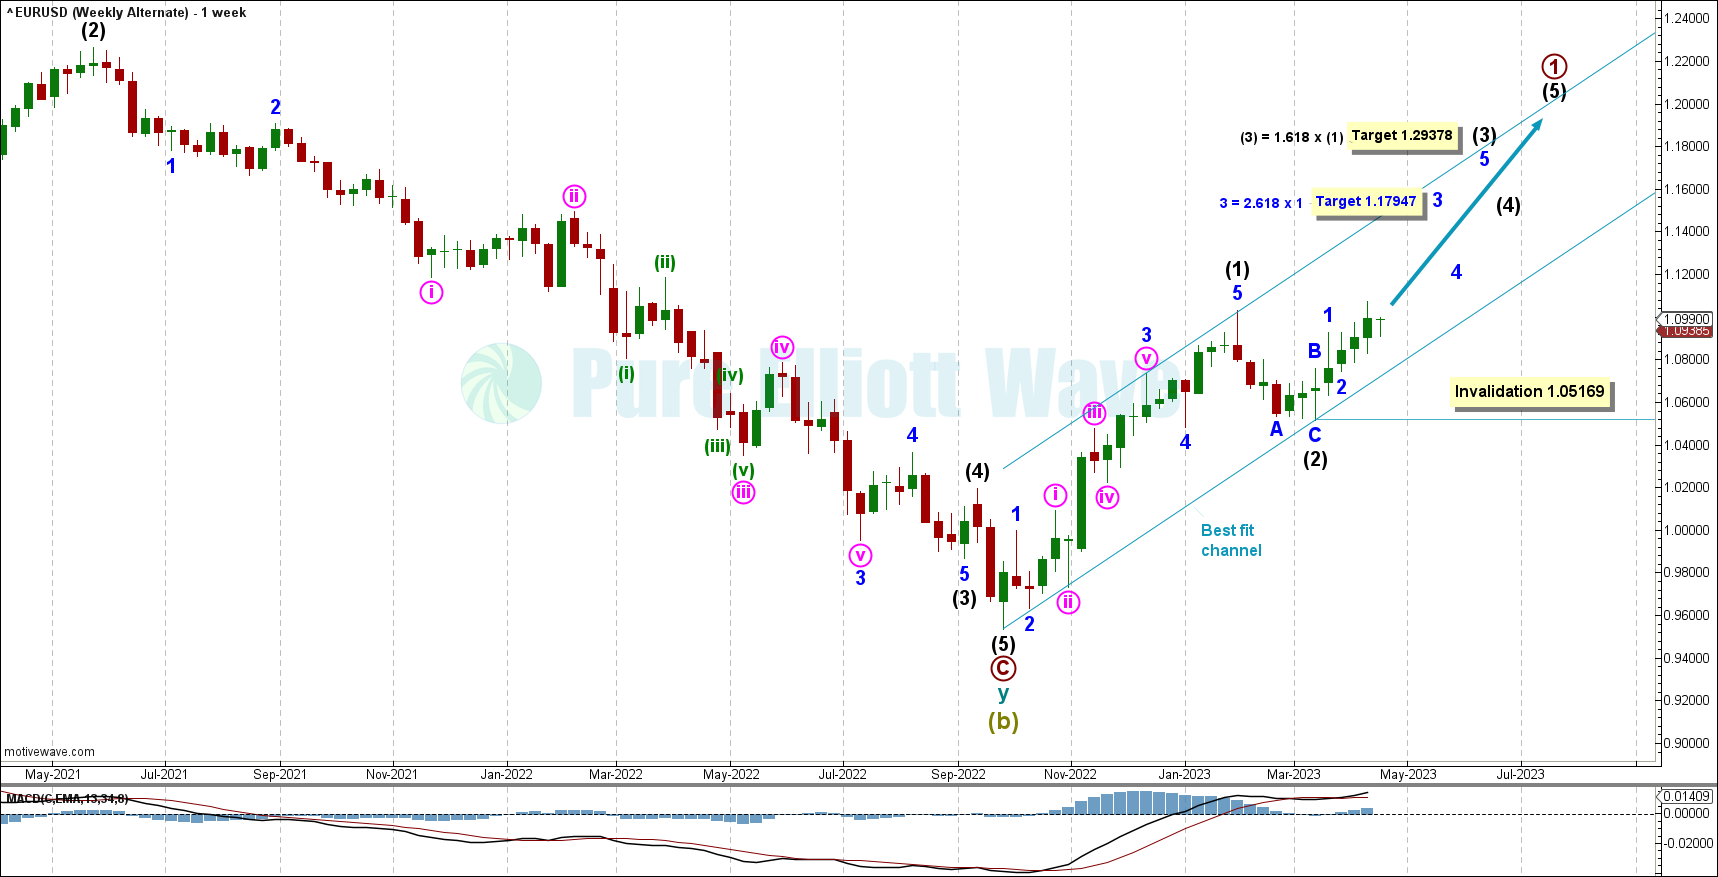
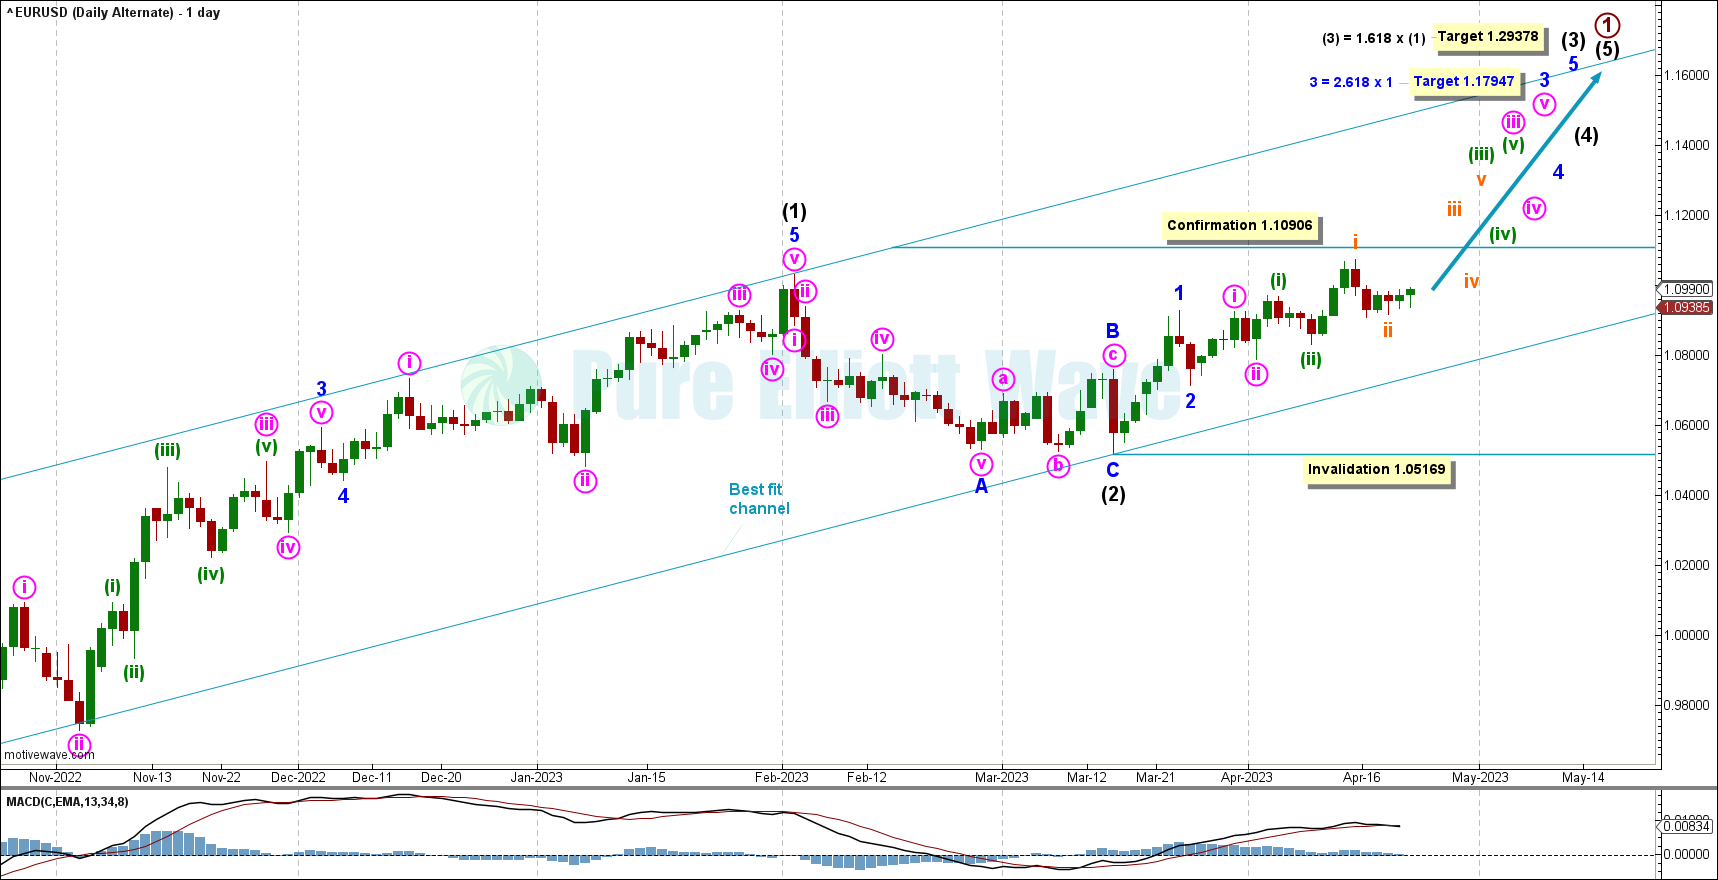
If prices moves above 1.10906, then this alternate will take effect.
This wave count shows intermediate wave (2) complete as a zigzag and an impulse unfolding upwards for intermediate wave (3). This is a very bullish wave count.
Minor wave 1 and 2 of intermediate (3) may be complete. A target is calculated for minor wave 3 to reach 2.618 times the length of minor 1 at 1.17947.
The next target is calculated for intermediate (3) to reach 1.618 the length of intermediate (1) at 1.29378.
The invalidation point is located at 1.05169, the start of minor wave 1.
ALTERNATE DAILY CHART
Click chart to enlarge.
Confirmation for this wave count sits closely above at 1.10906.
Overlapping waves 1 and 2 at minor, minute, minuette, and subminuette degree show that this wave is extending. Extending waves can be explosive price moves and are common in wave 3 positions in the EURUSD. This count expects much more movement to the upside with this extending wave.
If price breaches the best fit channel, encompassing all the previous upwards price action, that could be a sign the trend has shifted from up to down. Invalidation sits below at 1.05169.
ALTERNATE HOURLY CHART
Click chart to enlarge.
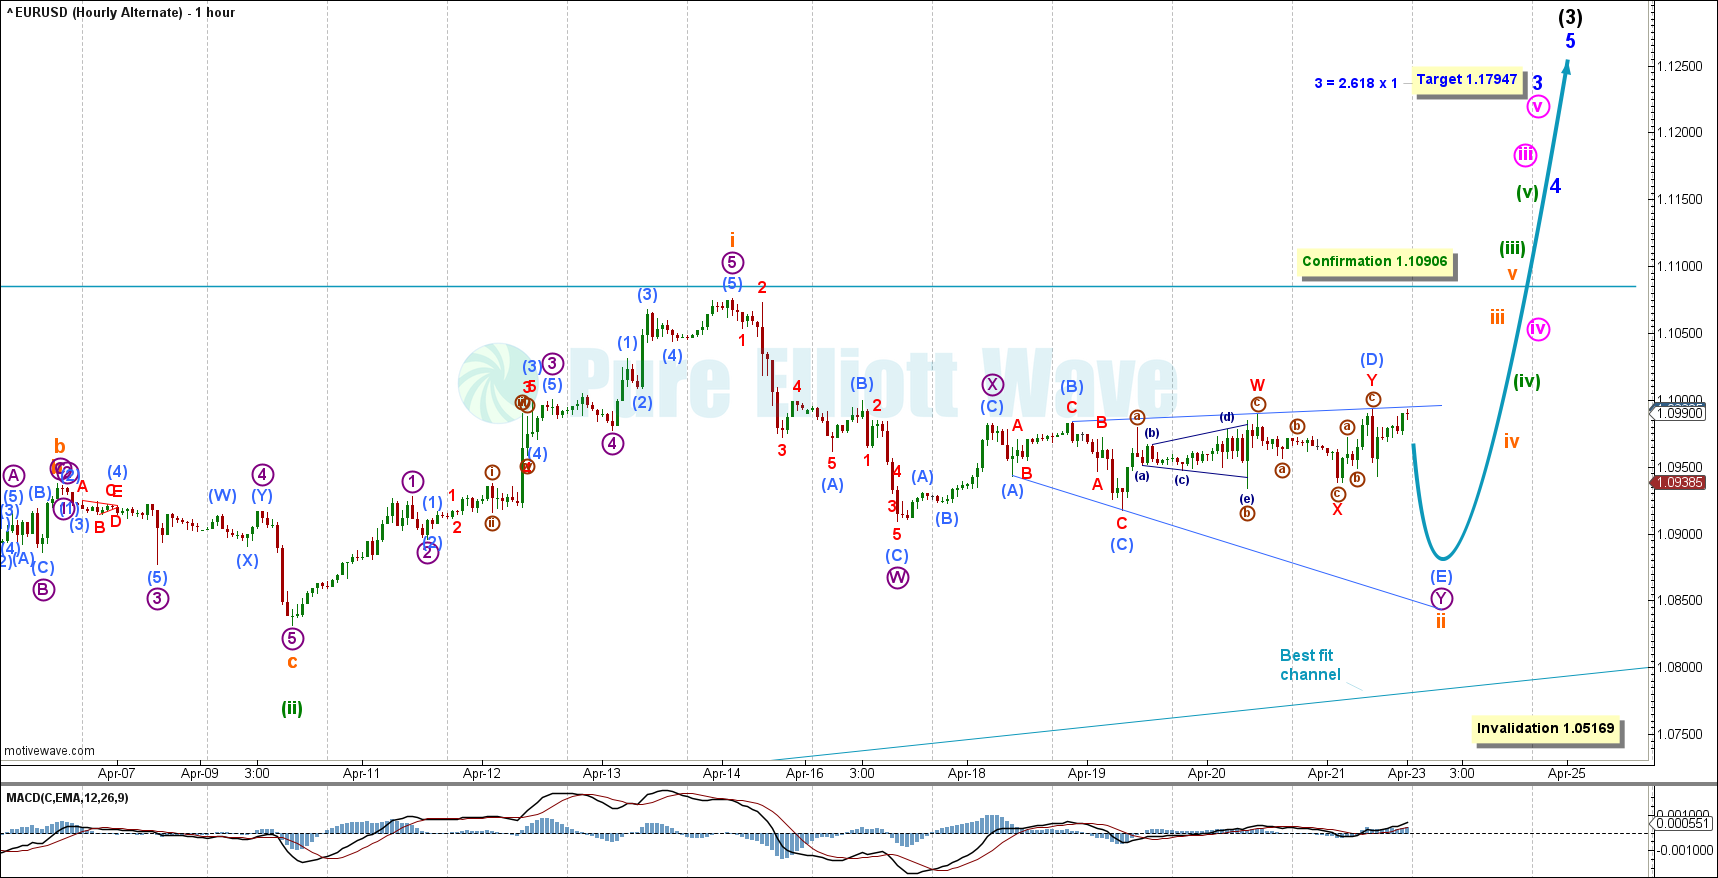
This alternate hourly chart shows subminuette i and ii inside of the extending minor wave 3.
Subminuette ii may be unfolding as a double combination, with micro W complete as a zigzag, micro X complete as a zigzag, and micro Y unfolding as an expanding triangle. Within micro Y, being composed of submicro (A), (B), (C), and (D), submicro (E) has yet to unfold and is expected to make a new low possibly meeting the bottom trend line drawn around the triangle.
Confirmation for this bullish wave count is not far above at 1.10906.
This best fit channel is a tighter channel drawn from March 15th onwards. A breach of this channel with a full candlestick below and not touching the line may indicate a trend change.
TECHNICAL ANALYSIS
VOLUME
VOLUME WEEKLY CHART
Click chart to enlarge.
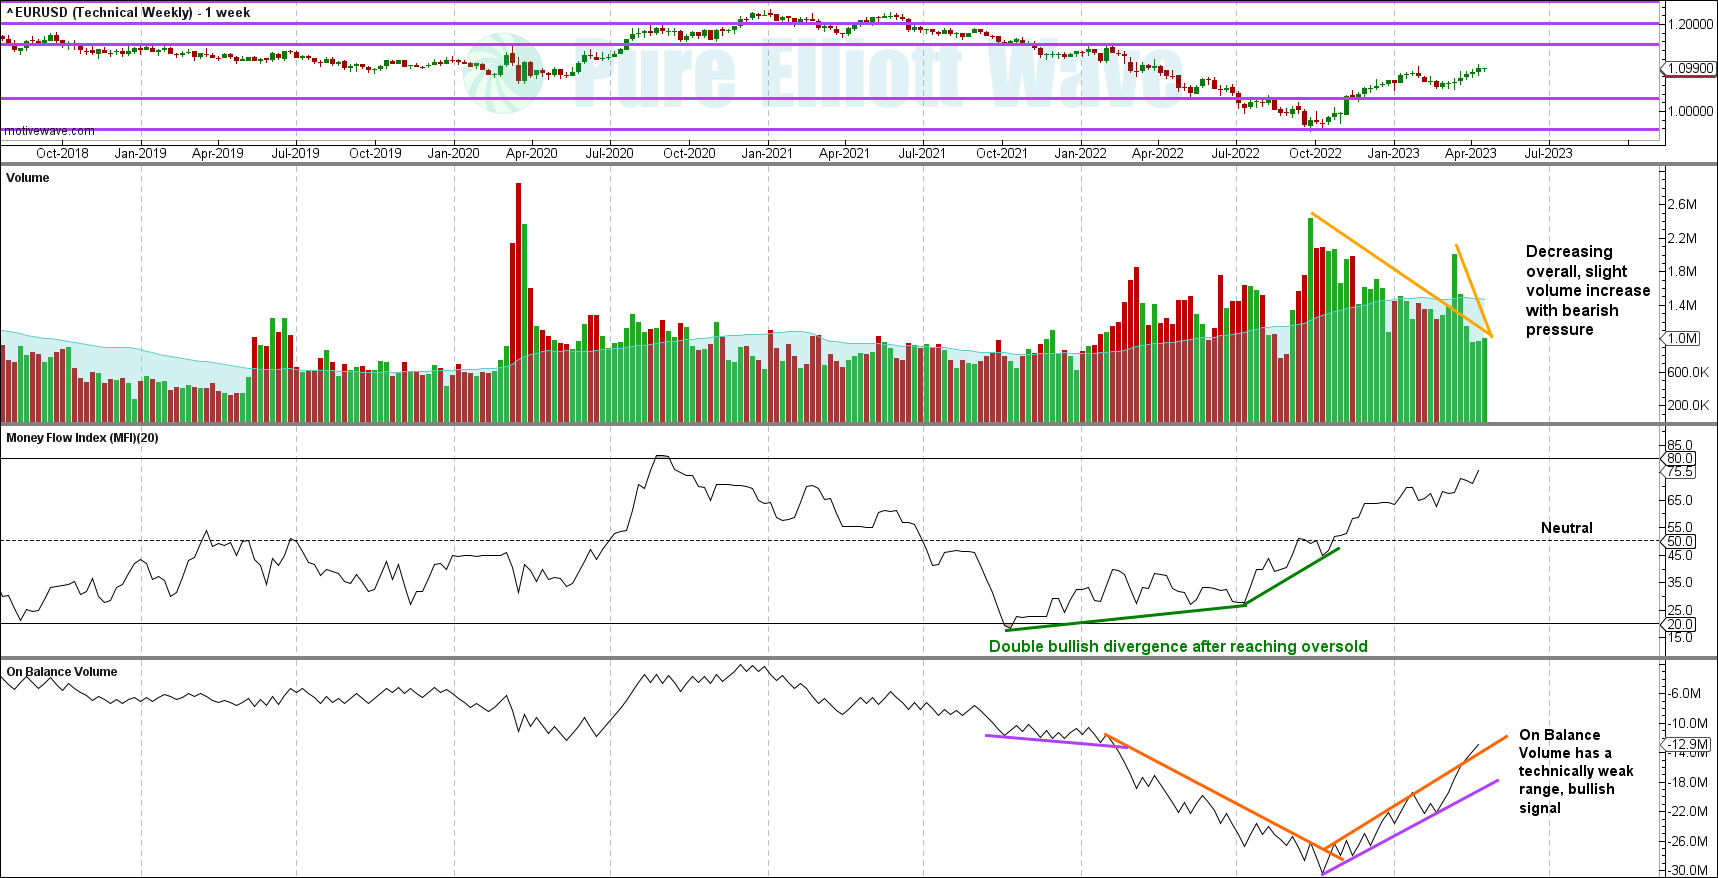
The volume profile is bearish with severely decreasing volume with bullish momentum, which overshadows a weak on balance volume signal. This signal is weak due to the slope of the upwards sloping orange line, and only 2-3 tests of this line before the recent breach.
WEEKLY CHART
Click chart to enlarge.
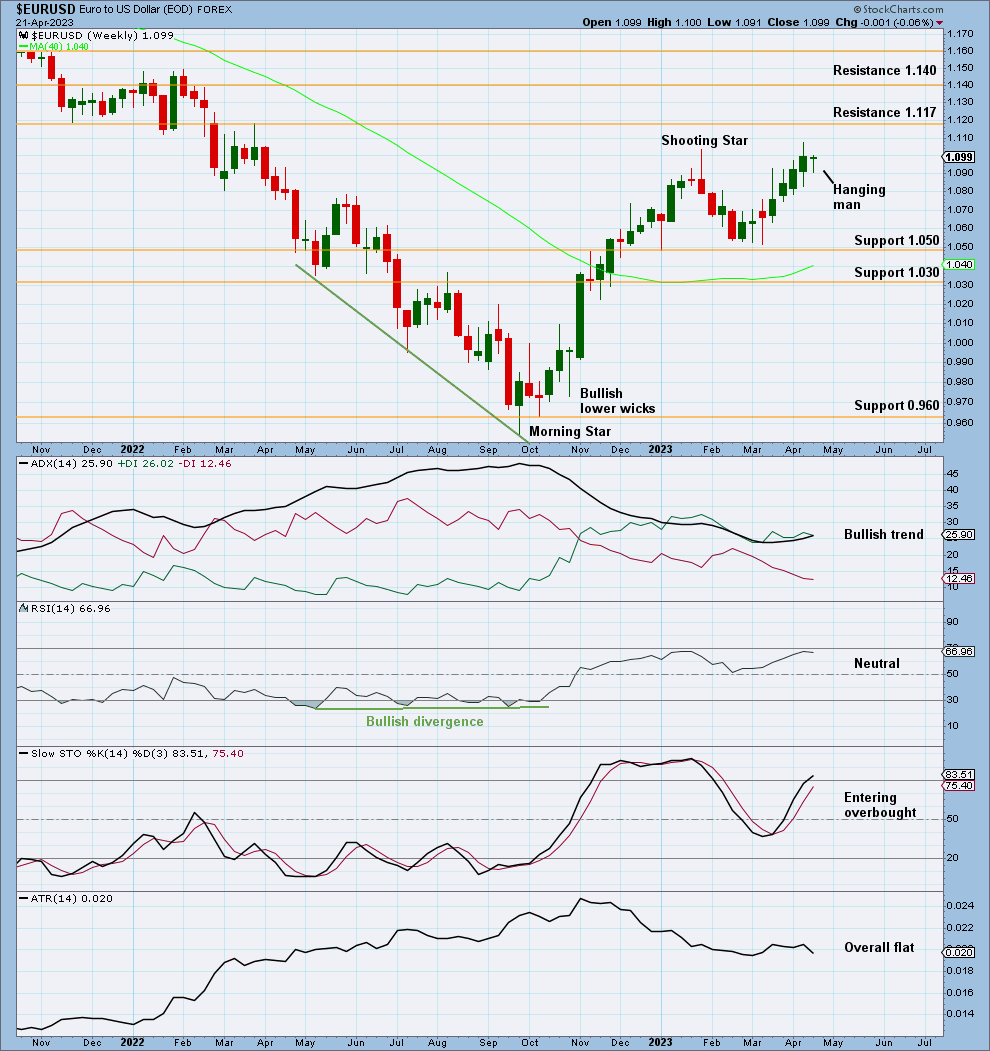
This week’s candle is a Hanging Man, a bearish reversal signal. This supports the main Elliott Wave count.
Next overhead resistance sits at 1.1170.
Although ADX indicates an upwards trend, weak and further declining volume is a major concern for a bullish case.
VOLUME DAILY CHART
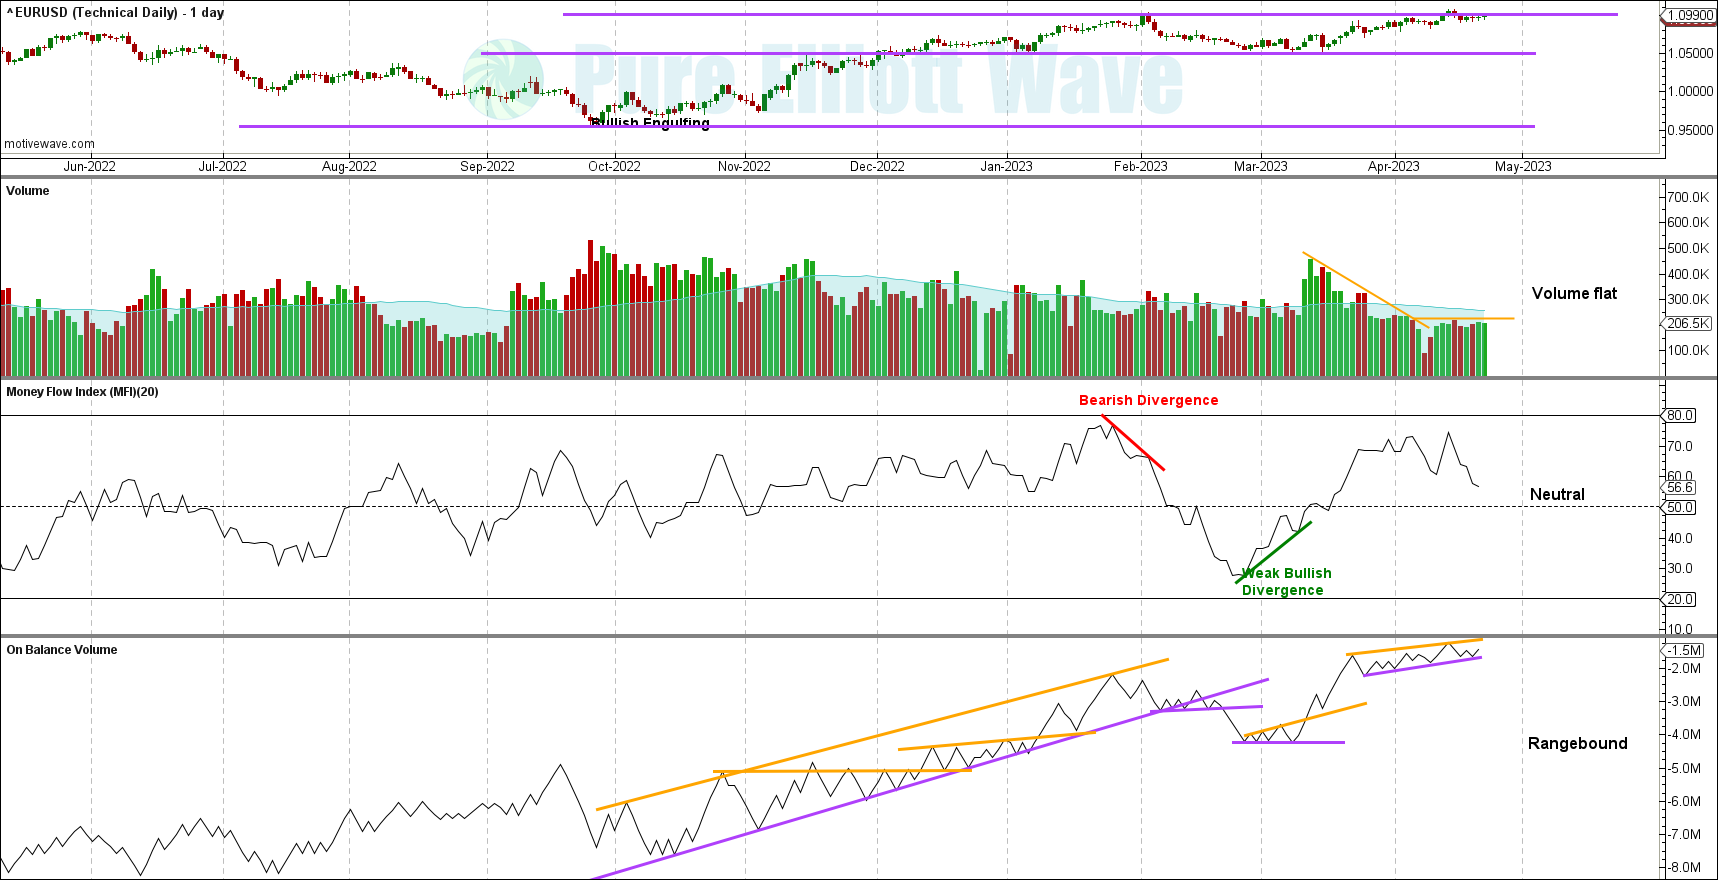
Click chart to enlarge.
Over the past month, volume has dramatically fallen with bullish movement. This is a bearish signal, a pullback is likely to occur. The last week had an overall flat volume.
Although money flow exhibited bullish divergence, this divergence is weak due to the low of the second pivot only being a few pips below the first. The bearish signals from other technicals outweigh this signal.
DAILY CHART
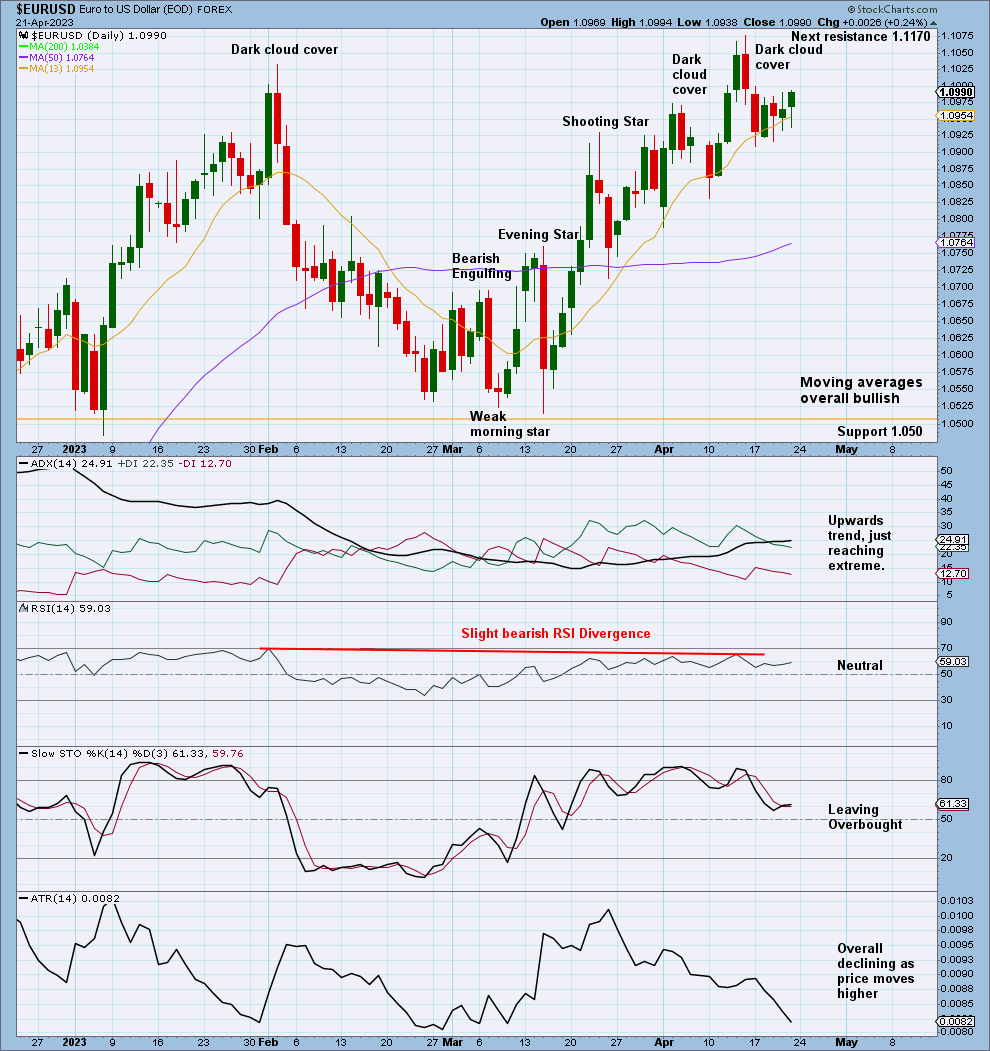
Click chart to enlarge.
Last week’s dark cloud cover was a strong reversal signal, followed by confirming price action. Recent days show a consolidating sideways price movement with no new candlestick patterns.
ADX being extreme supports a possible reversal from the top, as does the slight bearish divergence between price and RSI.
The moving averages are very bullish, all sloping up, with the 13 day above the 50 and the 50 day above the 200.
This chart is bearish, supporting the main Elliott Wave count.
Published @ 06:13 p.m. ET on April 24, 2023.
—
Careful risk management protects your trading account(s).
Follow our two Golden Rules:
1. Always trade with stops.
2. Risk only 1-5% of equity on any one trade.
—
New updates to this analysis are in bold.
—
 Save as PDF