April 28, 2023: EURUSD Elliott Wave and Technical Analysis – Video and Charts
Summary: The bigger picture for Euro expects overall upwards movement for the long term, most likely to not make a new high above 1.60380.
For the short term, a pullback may continue lower to a target zone from 1.02862 to 0.99505. Thereafter, a strong third wave up may begin.
A new alternate, also predicting long-term upwards price movement, expects a short-term pullback in the coming weeks.
Quarterly and monthly charts were last updated here.
WEEKLY CHART
Click chart to enlarge.
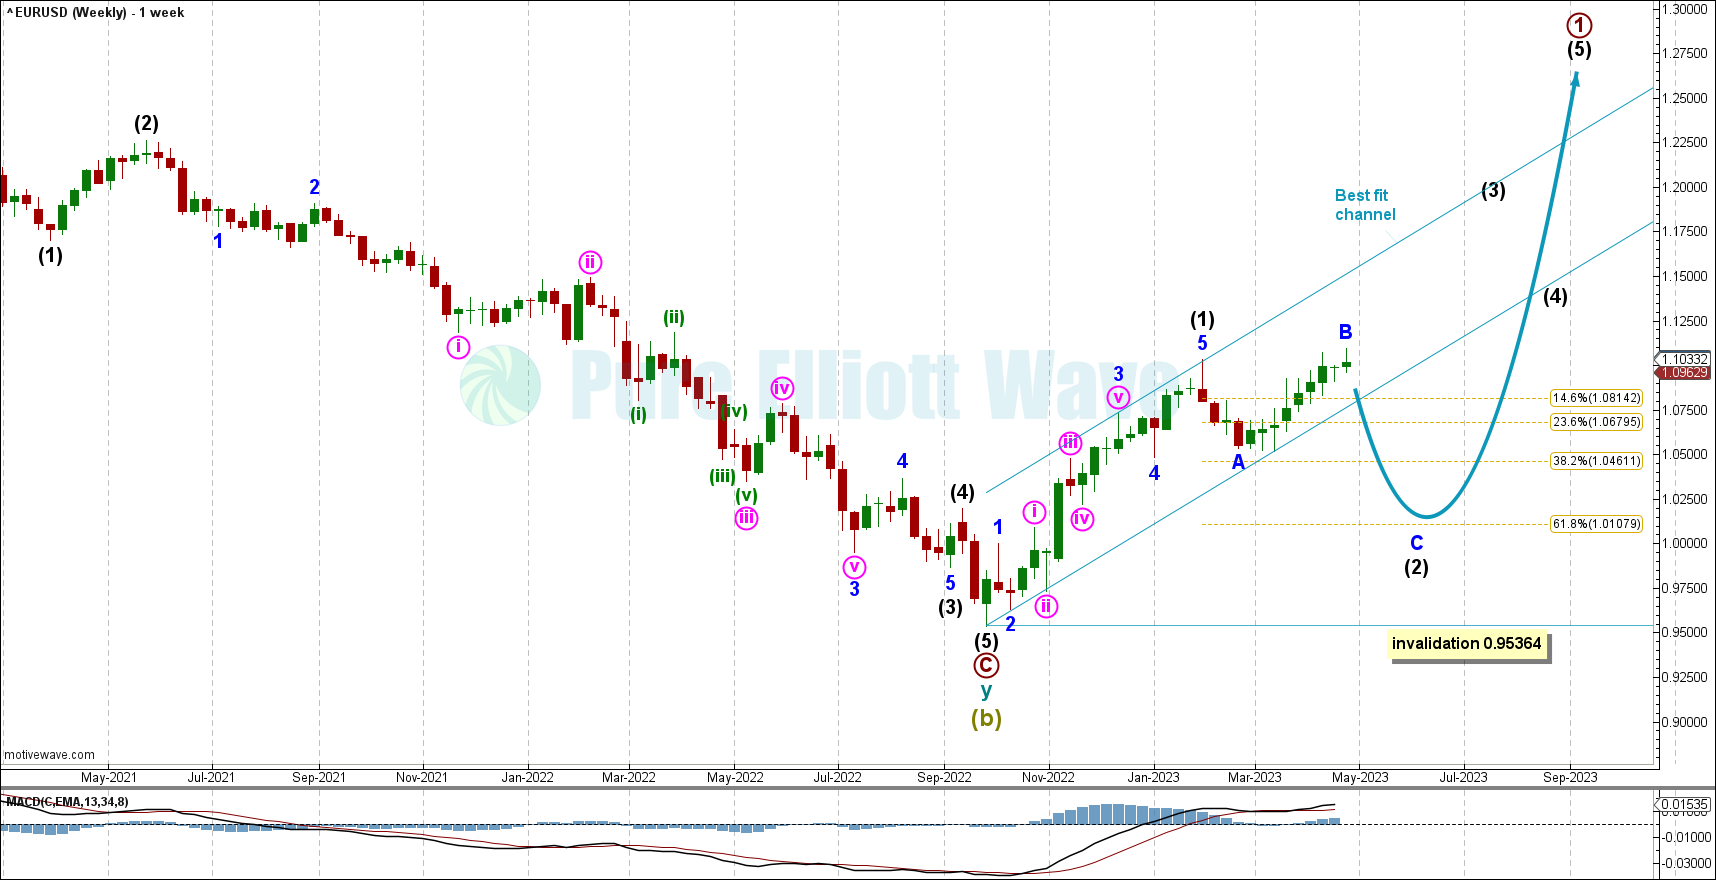
The weekly chart focusses on the end of Super Cycle wave (b) and the start of Super Cycle wave (c).
Within Super Cycle wave (c), cycle wave a must subdivide as a five wave motive structure. Primary wave 1 within cycle wave a would be most likely incomplete.
Within primary wave 1: Intermediate wave (1) may be over at the previous high and now intermediate wave (2) may continuing to find support about the 0.618 Fibonacci ratio of intermediate wave (1) at 1.01079.
Intermediate 2 may be unfolding as an expanded flat with minor B reaching 107% the length of wave A. Expanded flats are common structures. Wave C is expected to unfold to the downside in the coming weeks.
A best fit channel has been drawn to encompass all of the present upwards movement. If price breaks below the best fit channel, then that would provide confidence the trend has changed from up to down.
Intermediate wave (2) may not move beyond the start of intermediate wave (1) below 0.95364.
DAILY CHART
Click chart to enlarge.
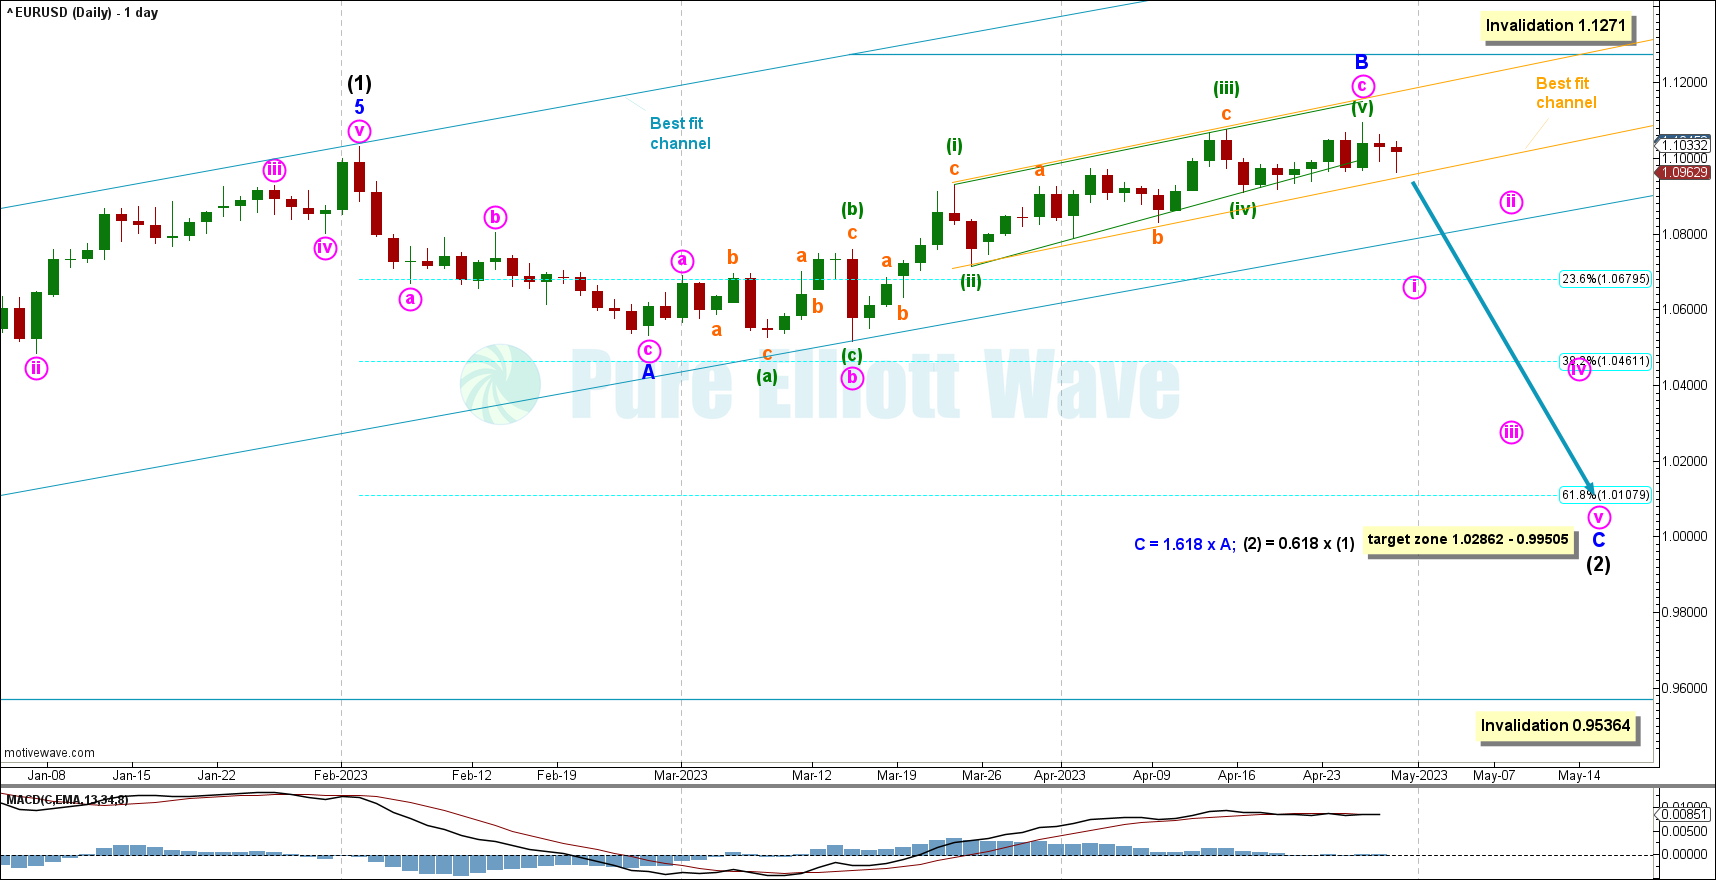
The daily chart focuses on intermediate wave (2).
Last week, the ending diagonal was labeled as complete at the last peak of April 14, 2023, and a breach of that level now expects minor B to be complete.
Minor C must unfold as a motive structure downwards.
Two best fit channels can be seen, in orange and blue. A full candlestick breaking below and not touching either one of these channels will be considered a bearish signal and confidence in a new short-term trend.
The previous week’s invalidation was not breached. Within the zigzag of minor wave B, minute wave c may have completed as an ending contracting diagonal. Within the diagonal, minuette wave (v) is shorter than minuette wave (iii) and minuette wave (iii) is shorter than minuette wave (i). If minuette wave (v) continues any higher, then it may not be longer than minuette wave (iii), so that the rules regarding wave lengths for contracting diagonals are met. Minuette wave (v) may not move above 1.1271.
With minor wave B complete, a target is calculated for minor wave C to reach 1.618 times the length of minor A at 1.02862, giving us a range from 1.02862 to 0.99505. This wave count is very bearish as diagonals often precede sharp movement.
HOURLY CHART
Click chart to enlarge.
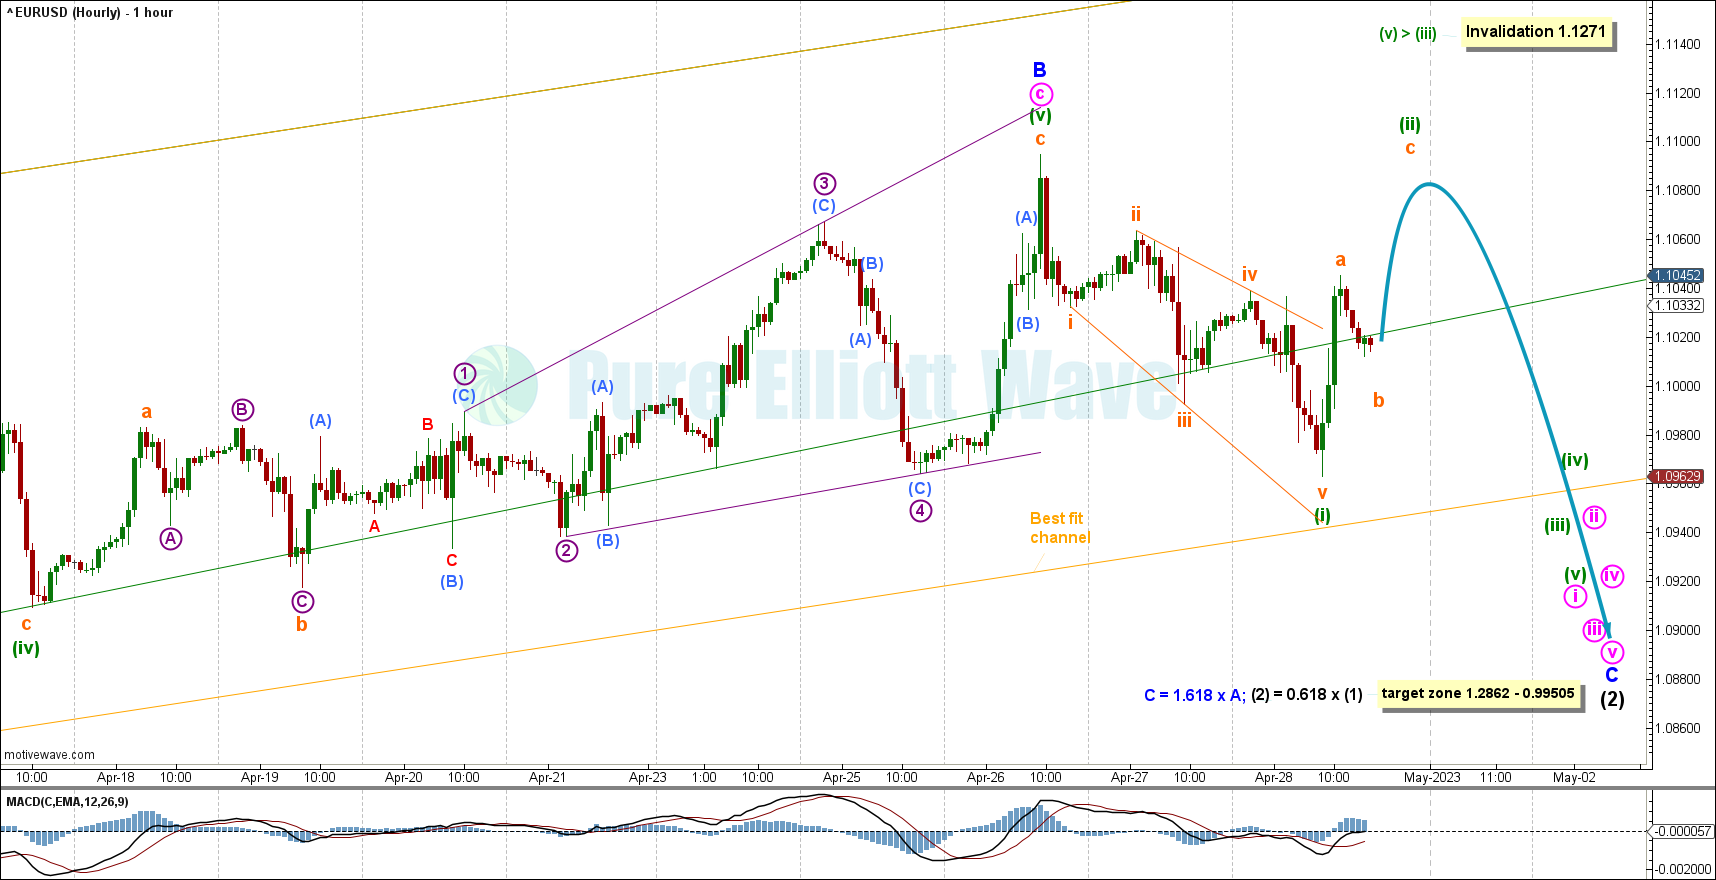
The hourly chart focuses on the end of minor wave B.
A 5 wave expanding diagonal has been labeled as minuette (i) and a subsequent corrective structure nearing completion has been labeled as minuette (ii). Minuette (ii) is in progress potentially as a zigzag, which is common for wave 2 structures. Within minuette (ii): Subminuette wave a may be complete, subminuette wave b may either be complete or may move lower, and if subminuette wave b is now complete, then subminuette wave c may move upwards in the short term next week. Thereafter, downwards price action may follow.
A breach of the orange best fit channel would add confidence in a trend change for the short term from up to down.
Upwards invalidation is .02 away at 1.1271.
For the short term, a downwards trend is expected to begin.
ALTERNATE WEEKLY CHART
Click chart to enlarge.
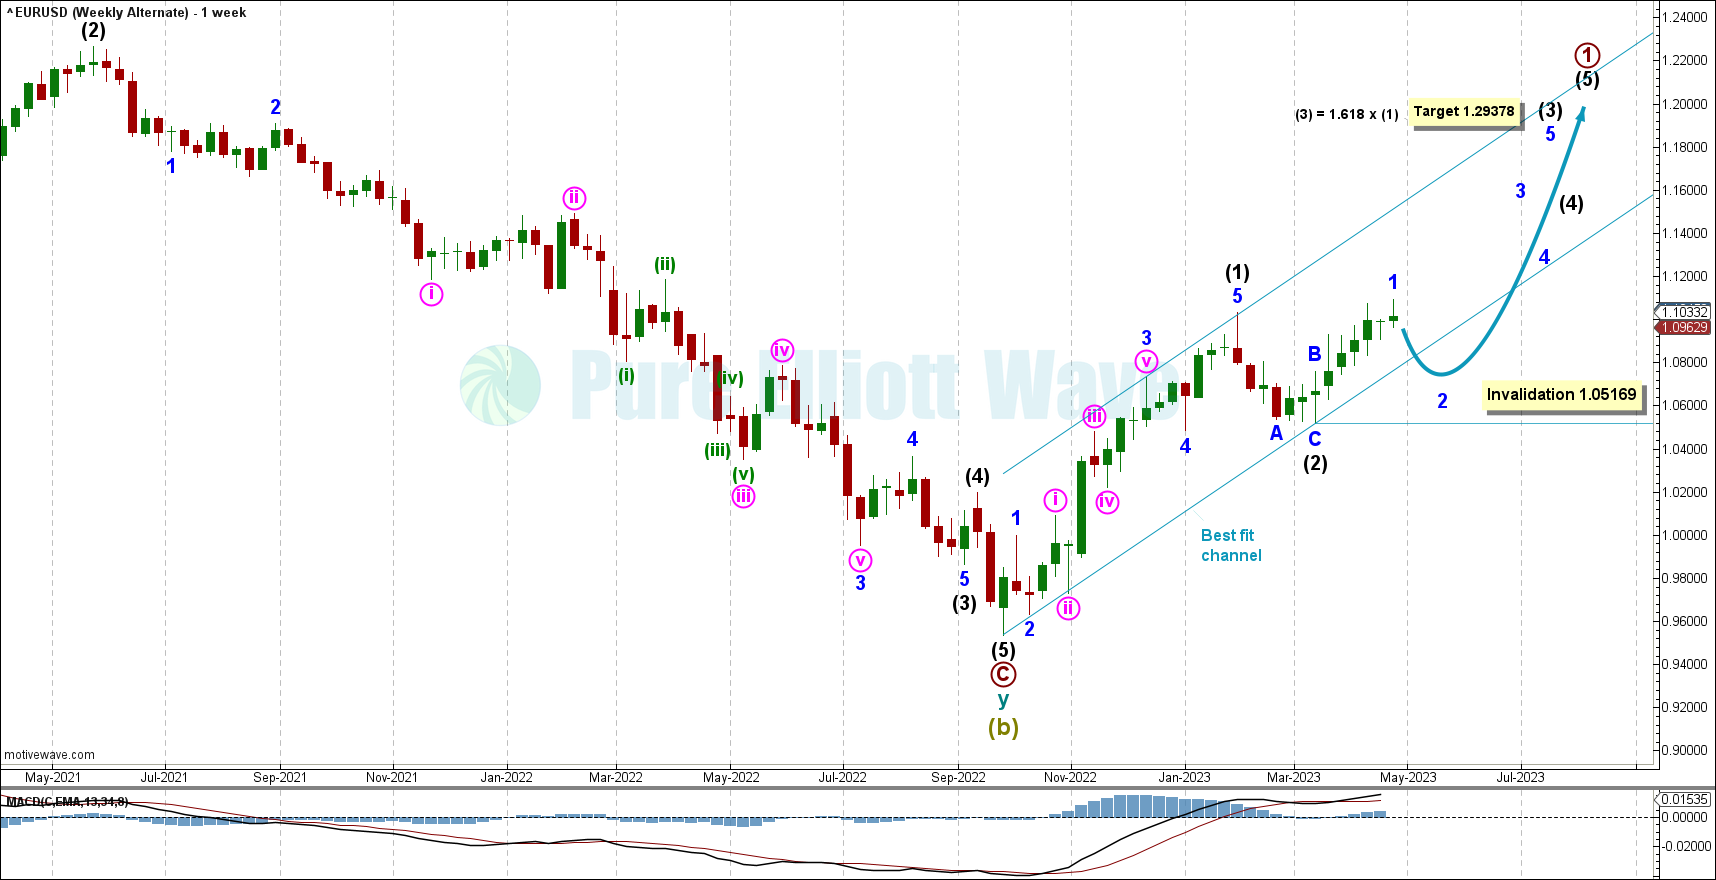
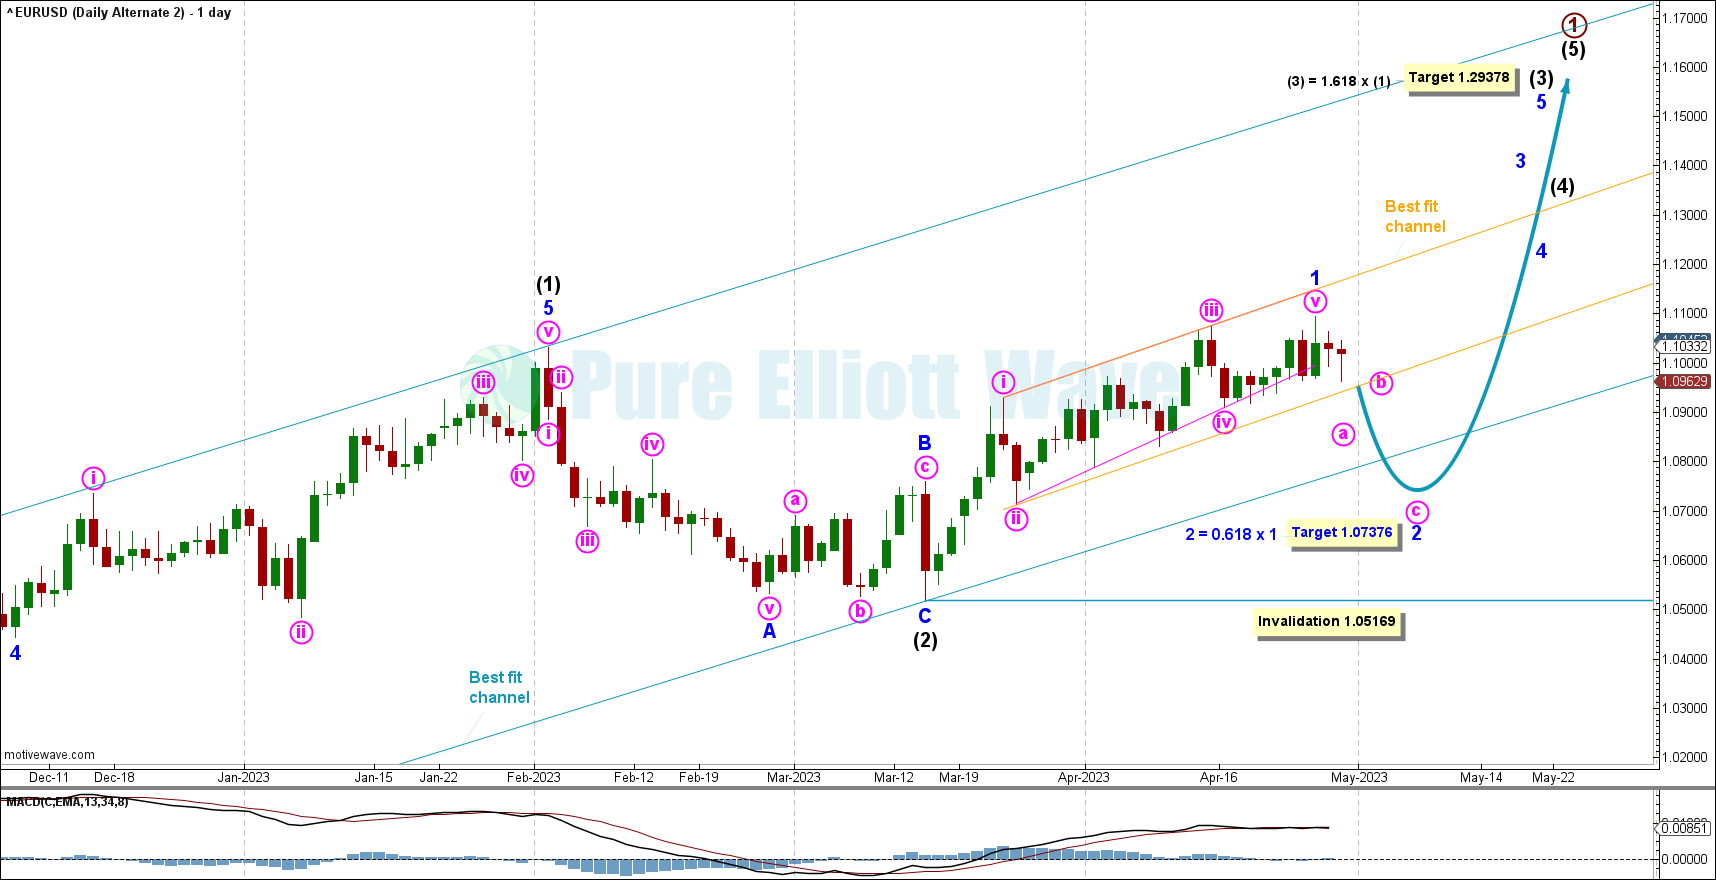
Intermediate (2) may be complete.
This chart expects a shallower pullback in the short term followed by more upwards movement.
Minor wave 1 be complete. Minor wave 2 is expected to begin.
A target is calculated for intermediate (3) to reach 1.618 the length of intermediate (1) at 1.29378.
Minor wave 2 may not move beyond the start of minor wave 1 below 1.05169.
ALTERNATE DAILY CHART
Click chart to enlarge.
Two best fit channels can be seen drawn around recent price movement. For the short term, a breach of the orange channel may be a sign of a trend change.
The upwards movement from March 23, 2023, to present subdivides much easier as a leading contracting diagonal than an extending third wave. Technicals support this view.
This alternate expects a less severe pullback in the coming weeks, but has a lower probability given the brief shallow intermediate (2).
A target has been calculated for minor wave 2 to reach the 0.618 fibonacci retracement of minor 1 at 1.07376.
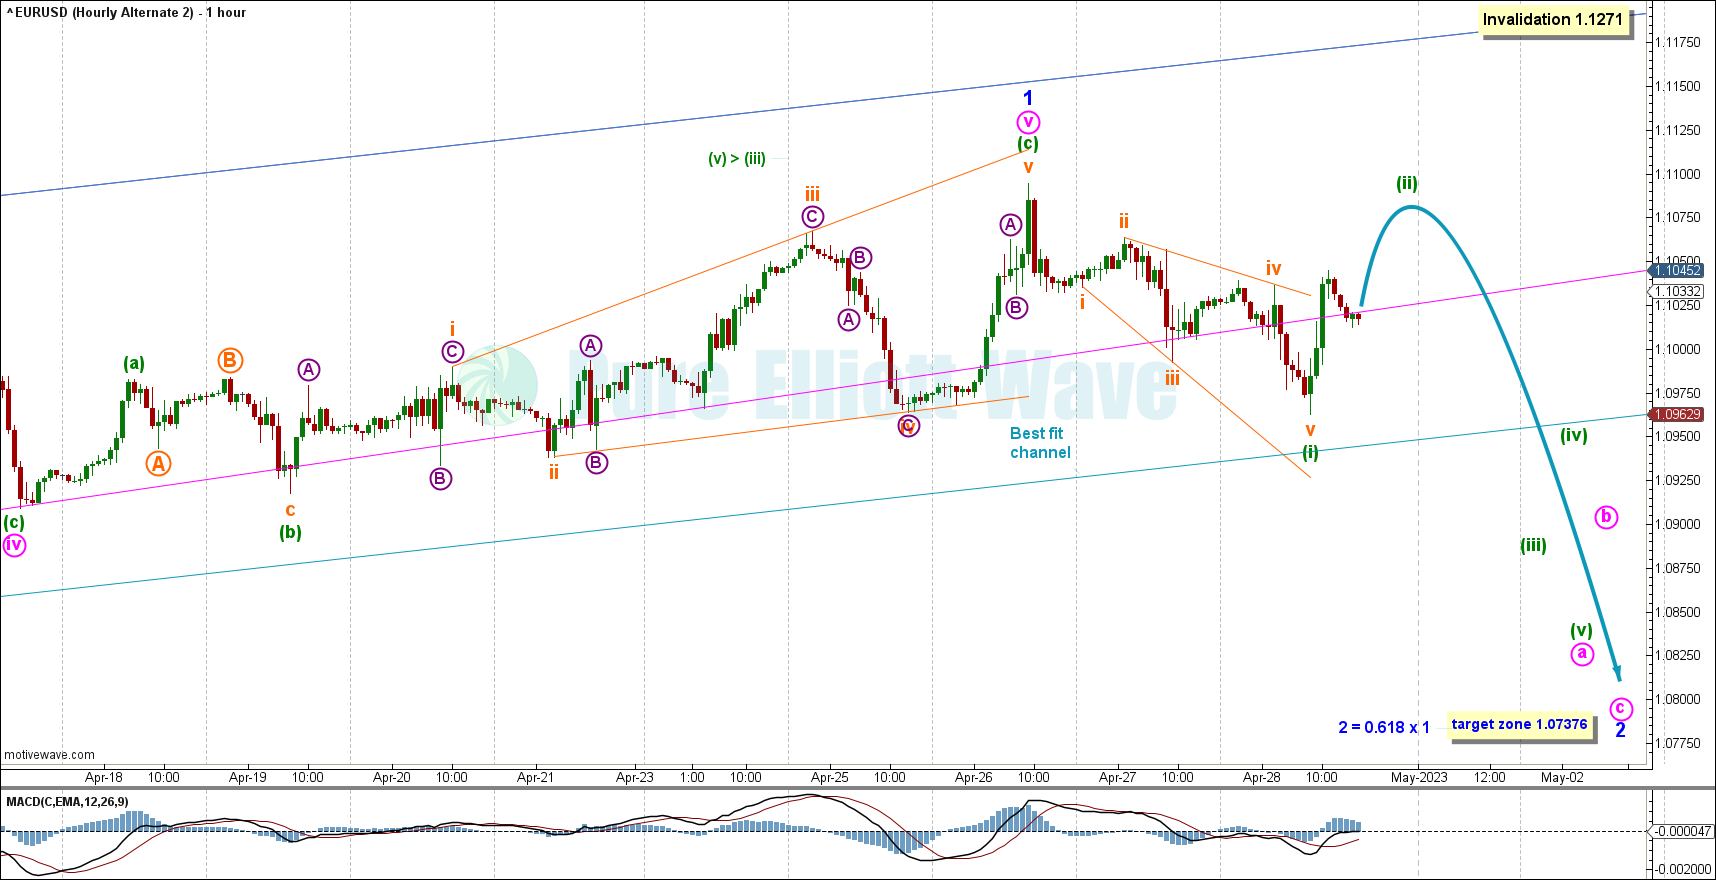
ALTERNATE HOURLY CHART
Click chart to enlarge.
This alternate reflects the same price movement as the main hourly chart, with a less severe correction.
The blue best fit channel contains all price action for the past month, beginning March 26, 2023. A breach of this channel would add confidence that the trend for the short term has changed from up to down.
TECHNICAL ANALYSIS
VOLUME
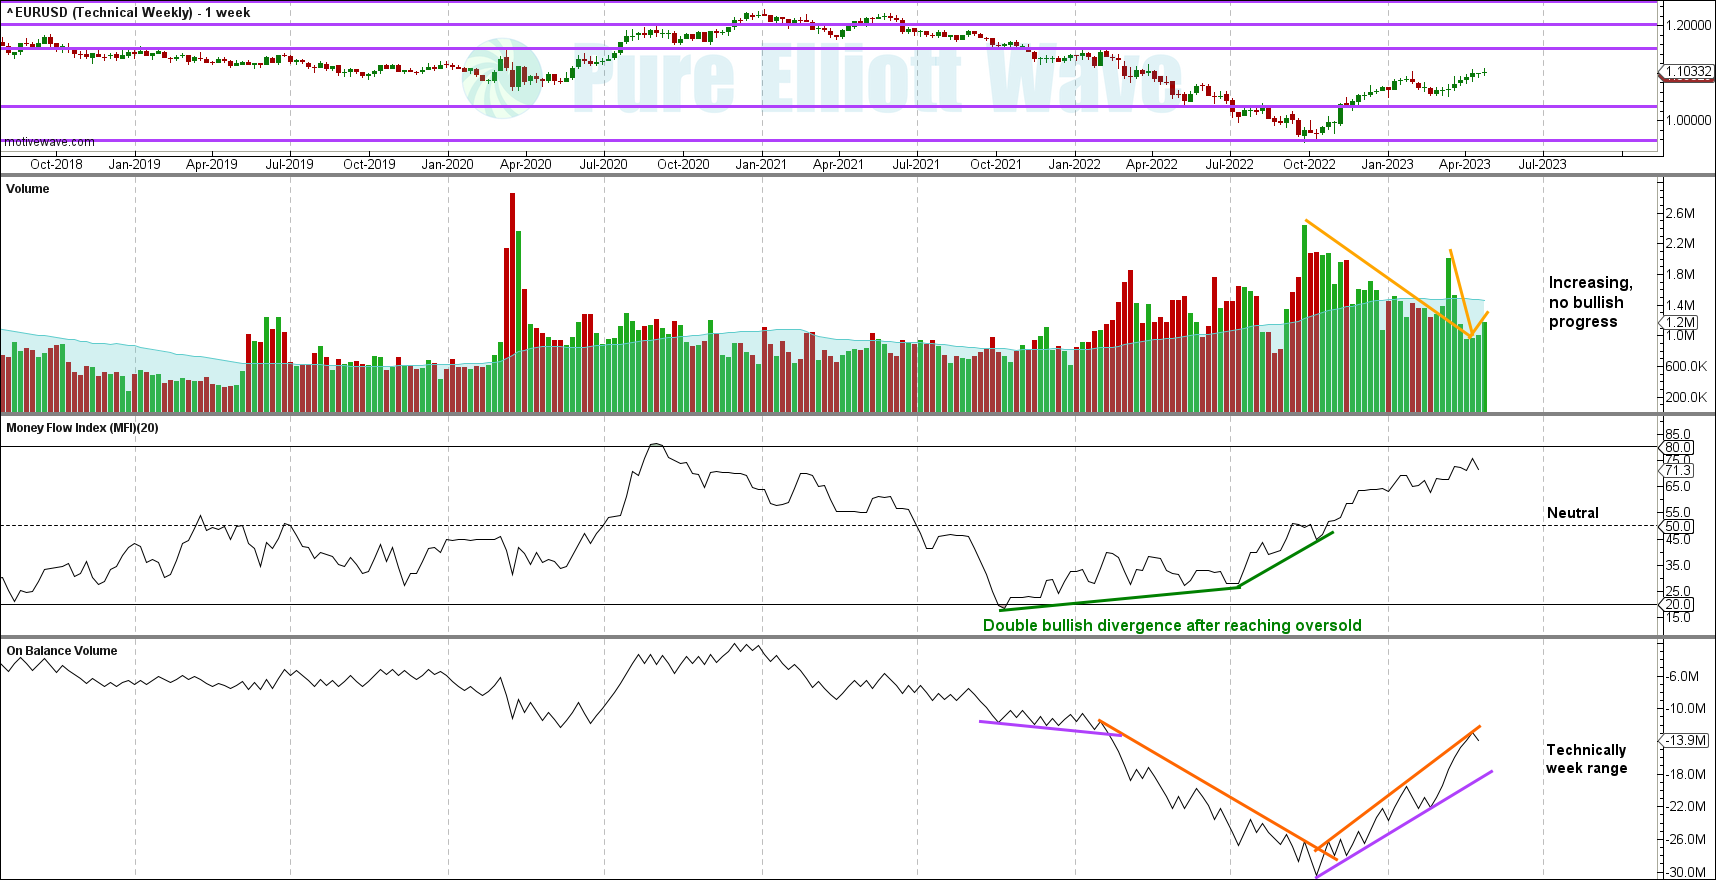
VOLUME WEEKLY CHART
Click chart to enlarge.
The volume appears slightly bullish with overall declining volume, followed this week by a slight increase. More detail can be seen on the daily volume chart.
WEEKLY CHART
Click chart to enlarge.
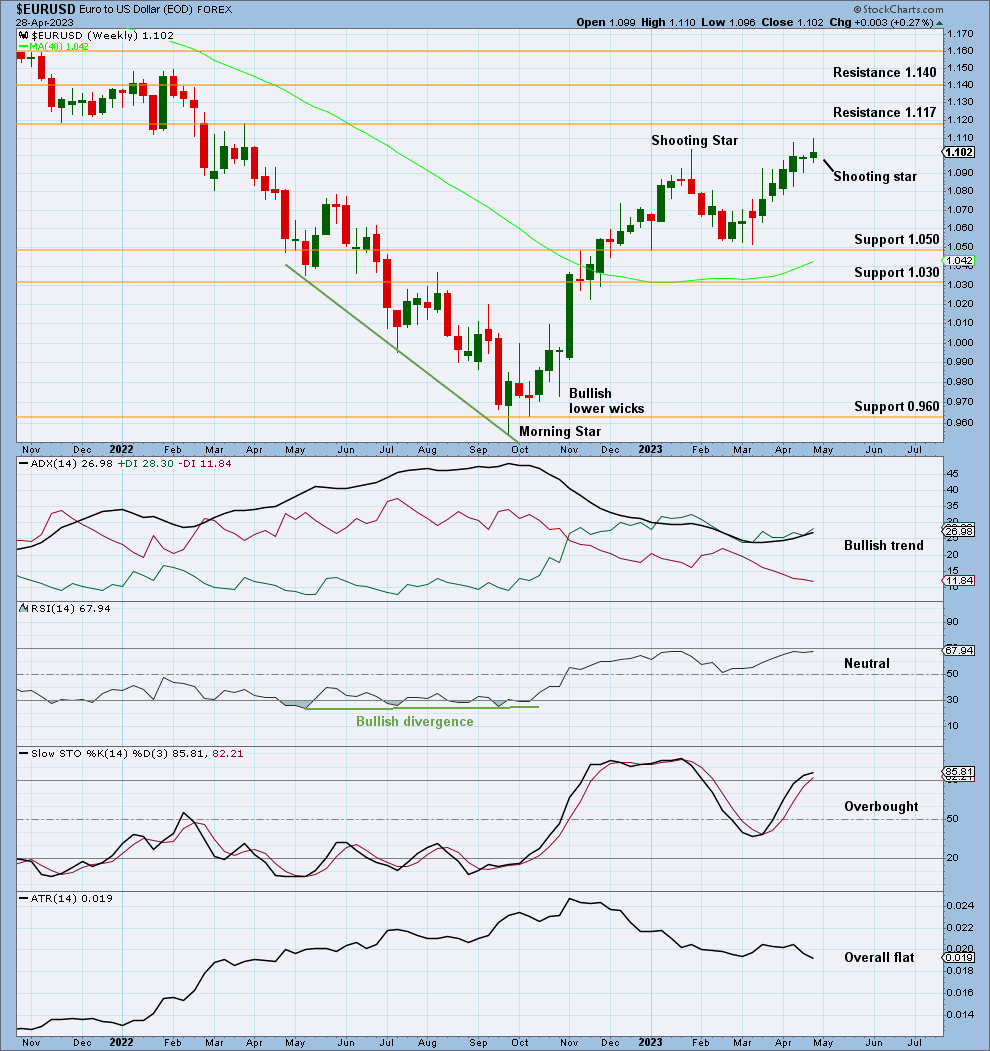
Last week’s hanging man was invalidated as price rose above the hanging man.
This week a shooting star candlestick pattern has appeared, a warning of a potential trend change.
Next overhead resistance sits at 1.1170.
ADX shows the trend could continue further before being extreme. There is still a little room for this trend to continue before RSI reaches overbought.
VOLUME DAILY CHART
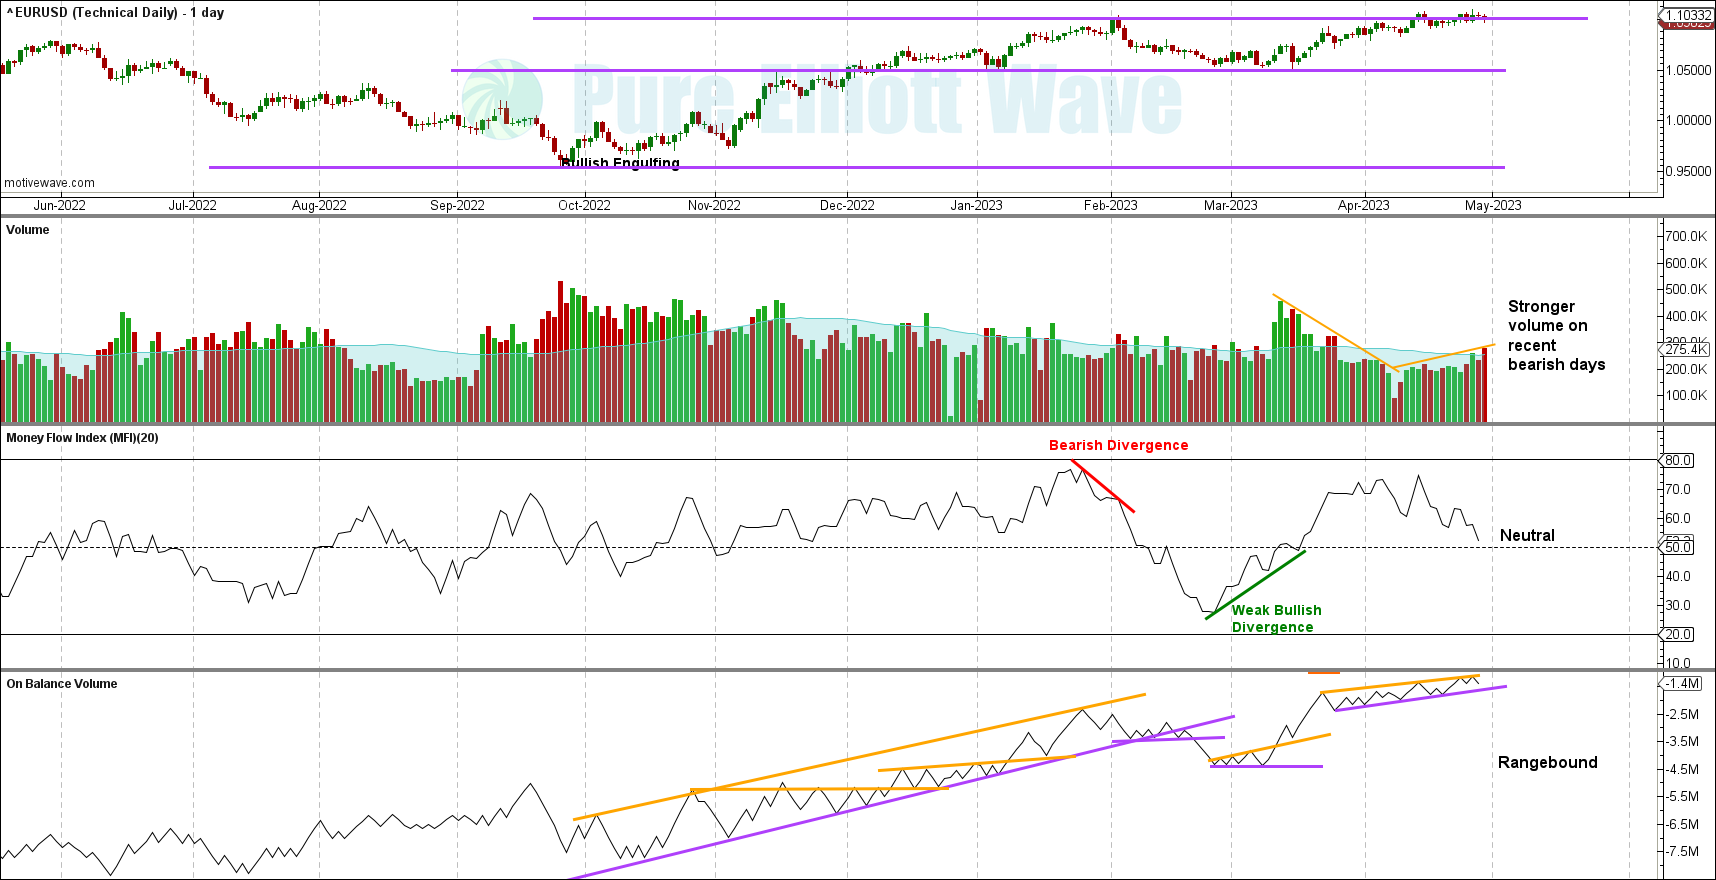
Click chart to enlarge.
Over the past month, volume has dramatically fallen with bullish movement.
The past week shows an increase in volume with sideways movement. The biggest volume appears on the recent bearish candlesticks, a bearish sign.
DAILY CHART
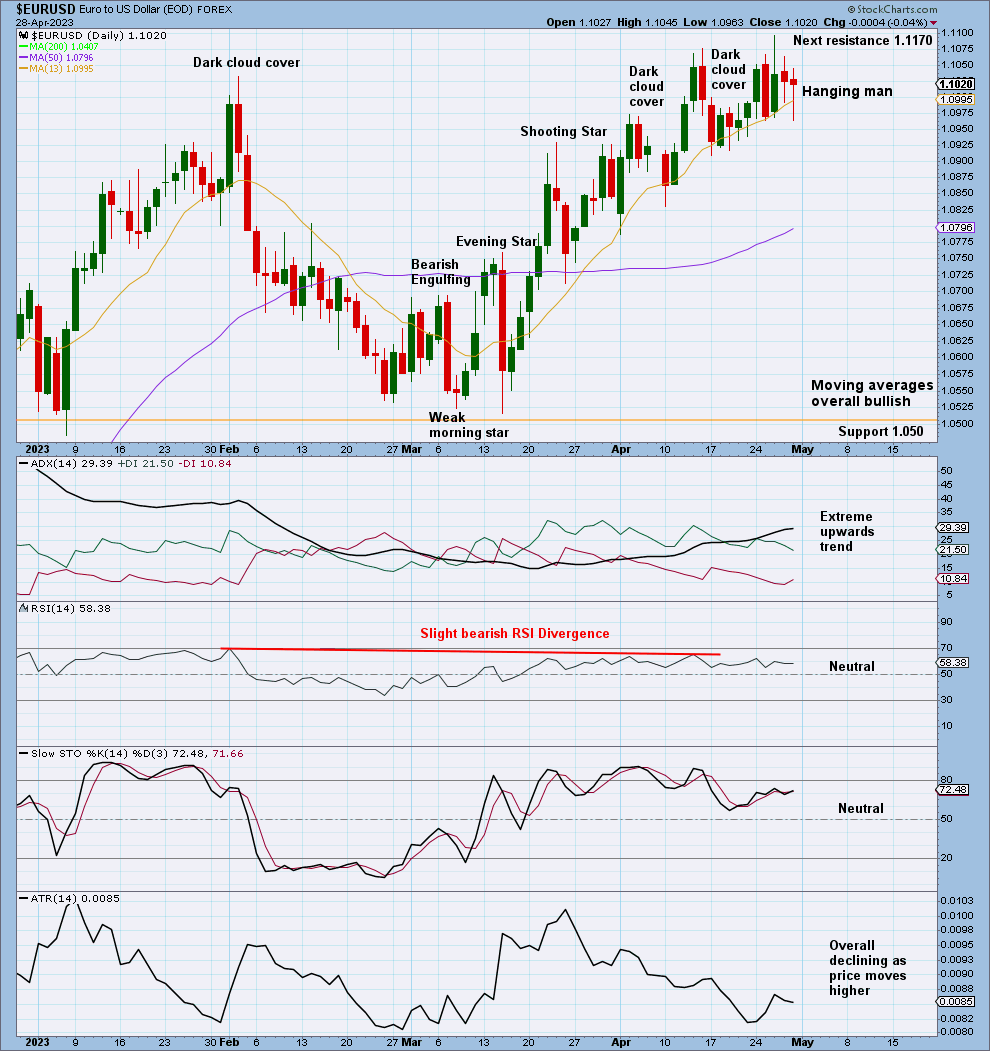
Click chart to enlarge.
Today price closed as a hanging man, a warning of an impending top. Due to bullish implications of the lower wick on a Hanging Man, traders should wait for confirmation of this pattern.
ADX being extreme supports a possible reversal from the top, as does the slight bearish divergence between price and RSI.
The moving averages are very bullish, all sloping up, with the 13 day above the 50 and the 50 day above the 200.
This chart is bearish, supporting the main Elliott Wave count.
Published @ 11:58 a.m. ET on April 30, 2023.
—
Careful risk management protects your trading account(s).
Follow our two Golden Rules:
1. Always trade with stops.
2. Risk only 1-5% of equity on any one trade.
—
New updates to this analysis are in bold.
—
 Save as PDF