May 19, 2023: EURUSD Elliott Wave and Technical Analysis – Video and Charts
Summary: The bigger picture for Euro expects overall upwards movement for the long term, most likely to not make a new high above 1.60380.
For the short term, a pullback may continue lower to a target zone from 1.02862 to 1.01079. Thereafter, a strong third wave up may begin. Recent price action may be confirming this outlook.
An alternate, also predicting long-term upwards price movement, expects the short-term pullback is over. Upwards movement is expected by the alternate.
Quarterly and monthly charts were last updated here.
WEEKLY CHART
Click chart to enlarge.
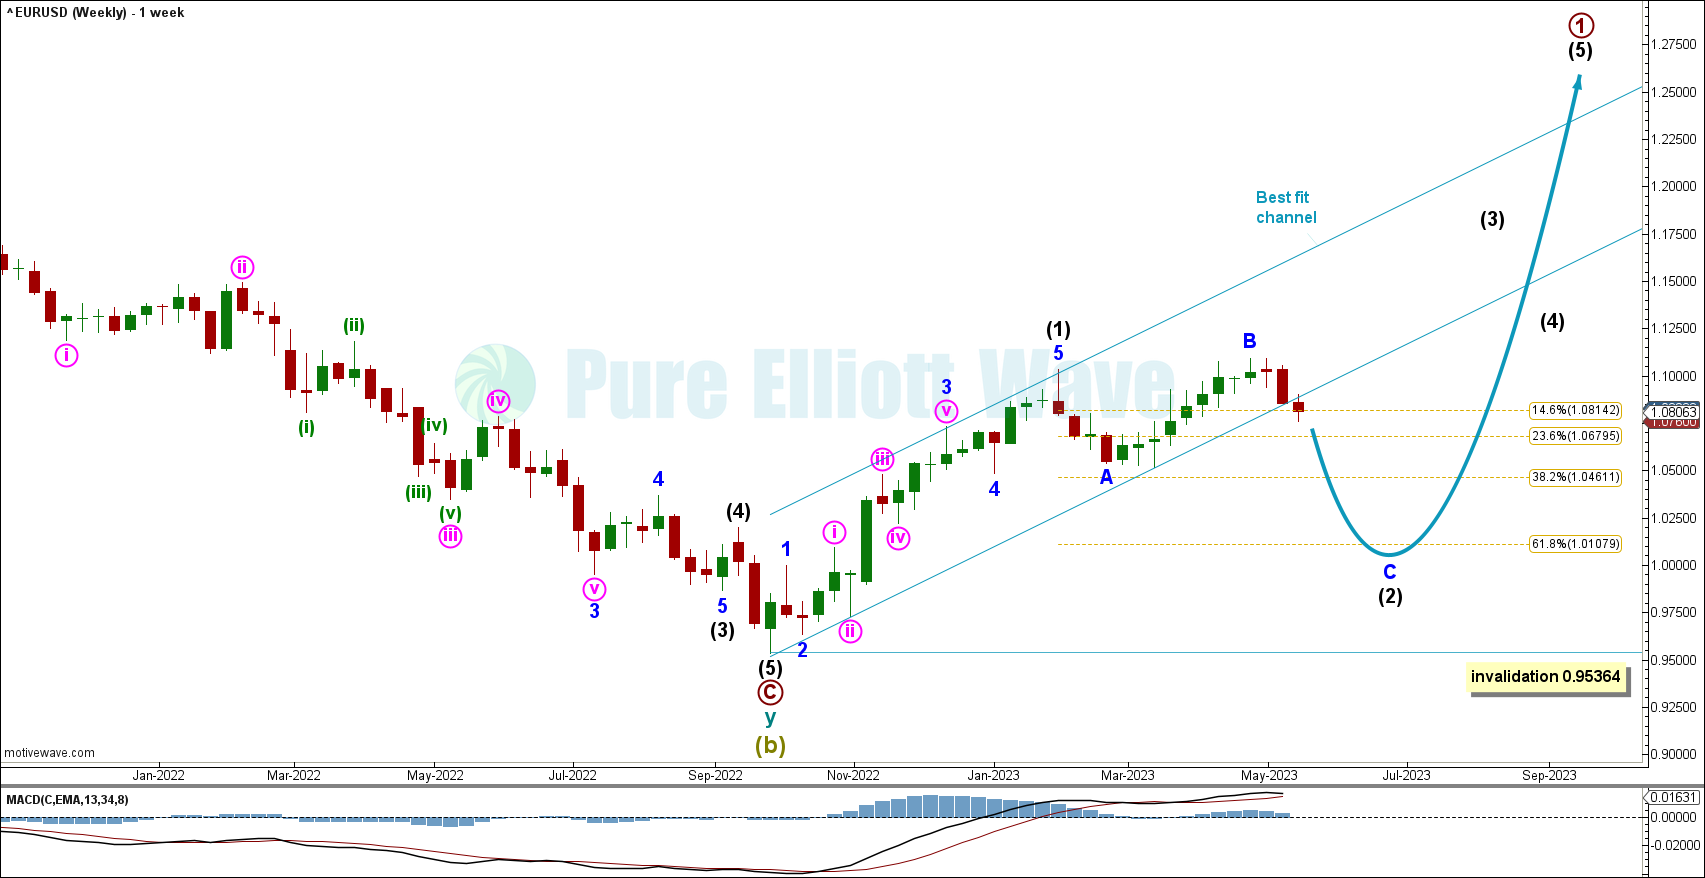
The weekly chart focusses on the end of Super Cycle wave (b) and the start of Super Cycle wave (c).
Within Super Cycle wave (c), cycle wave a must subdivide as a five wave motive structure. Primary wave 1 within cycle wave a is most likely incomplete.
Within primary wave 1: Intermediate wave (1) may be over at the previous high and now intermediate wave (2) may continue to find support about the 0.618 Fibonacci ratio of intermediate wave (1) at 1.01079.
Intermediate 2 may be unfolding as an expanded flat with minor B reaching 113% the length of minor wave A. Expanded flats are common structures. Minor wave C is underway and must subdivide as a motive structure downwards.
A best fit channel has been drawn to encompass all of the present upwards movement. The best fit channel has been broken on the daily chart. A new short-term bear trend is likely.
Intermediate wave (2) may not move beyond the start of intermediate wave (1) below 0.95364.
DAILY CHART
Click chart to enlarge.
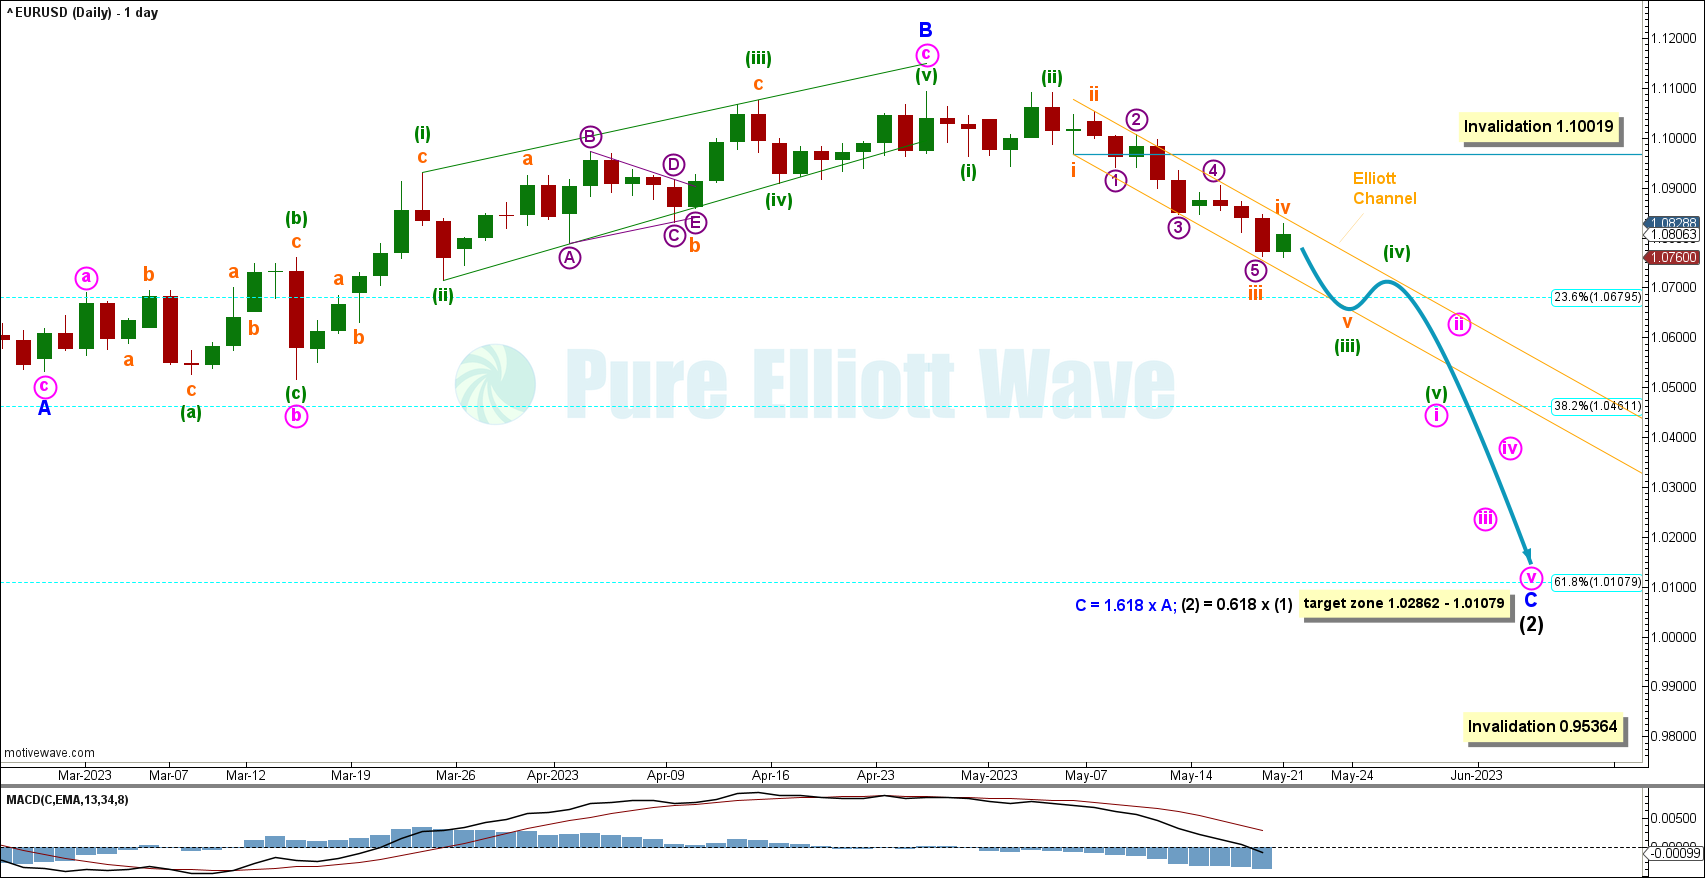
The daily chart focuses on minor waves B and C of intermediate (2).
A small bounce today allowed us to label subminuette wave iv possibly complete along the top of the Elliott channel. Downwards momentum is still expected in the short term to complete minuette wave (iii).
The invalidation level at 1.10019 is utilizing the Elliott Wave rule that within an impulse wave 4 may not enter the price territory of wave 1. Price over this level would shift our focus to the alternate count detailed below.
With minor wave B complete, a target is calculated for minor wave C to reach 1.618 times the length of minor A at 1.02862, giving us a range from 1.02862 to 1.01079. This wave count is very bearish for the short term.
HOURLY CHART
Click chart to enlarge.
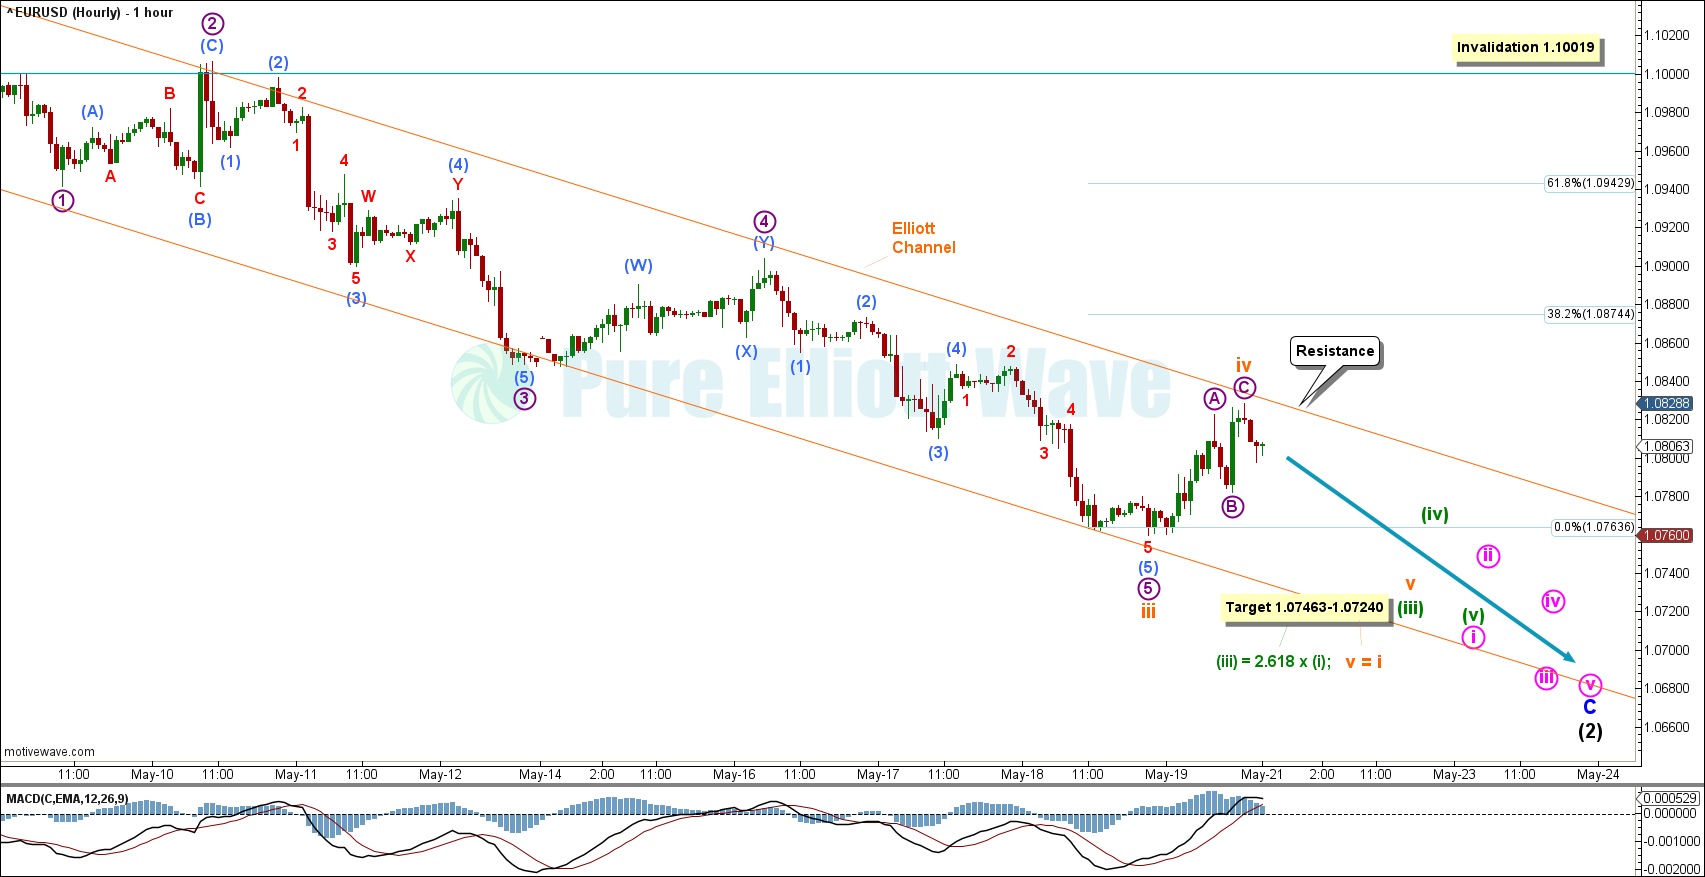
The hourly chart focuses on minuette wave (iii) and (iv) of minor wave C.
A target has been calculated for minuette wave (iii) to reach the 2.618 fibonacci extension of minuette (i) at 1.07463. With subminuette waves iii and iv complete, another target has been calculated for subminuette wave v to reach equality in length with subminuette wave i at 1.07240. This gives us a target range between 1.07463-1.07240 for the next wave down to reach support.
Recent price movement has remained inside the orange Elliott channel. Subminuette wave iii may be complete.
Subminuette wave iv may have met resistance along the upper edge of the channel. Subminuette wave iv may not move into subminuette wave i price territory above 1.10019.
More downwards movement is expected for the very short term, then another bounce or consolidation for minuette wave (iv).
ALTERNATE WEEKLY CHART
Click chart to enlarge.
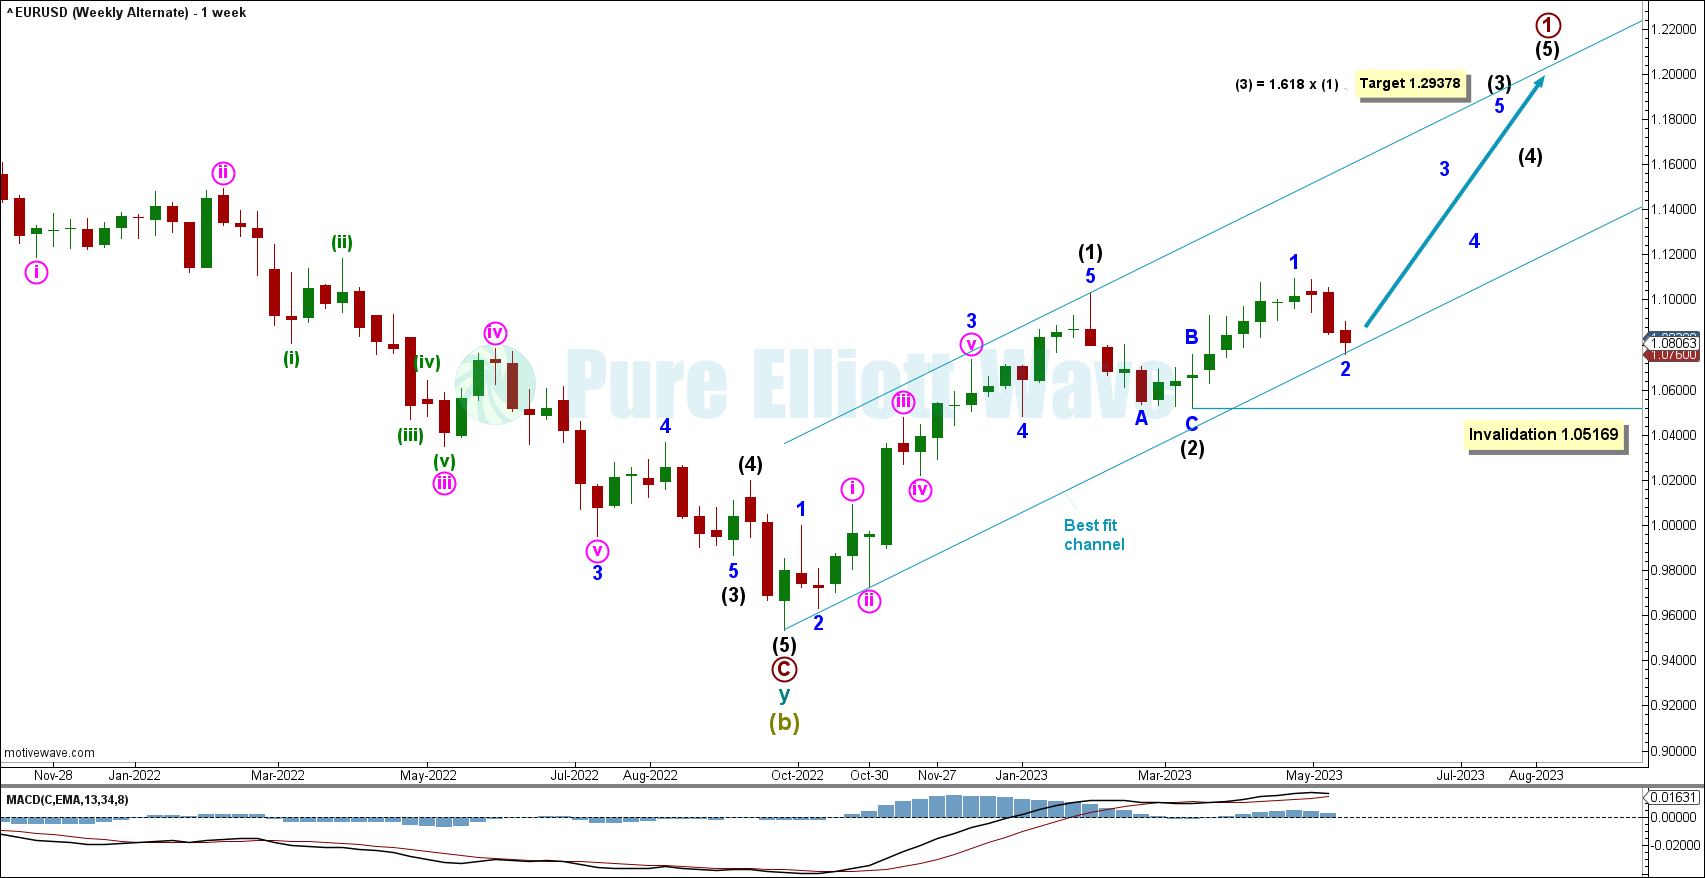
This alternate reflects the possibility of intermediate wave (2) as complete.
This chart expects a shallower pullback in the short term followed by more upwards movement.
The best fit channel has been re-drawn to show minute wave 2 may be over on this week’s candlestick.
A target is calculated for intermediate wave (3) to reach 1.618 the length of intermediate wave (1) at 1.29378.
Minor wave 2 may not move beyond the start of minor wave 1 below 1.05169.
ALTERNATE DAILY CHART
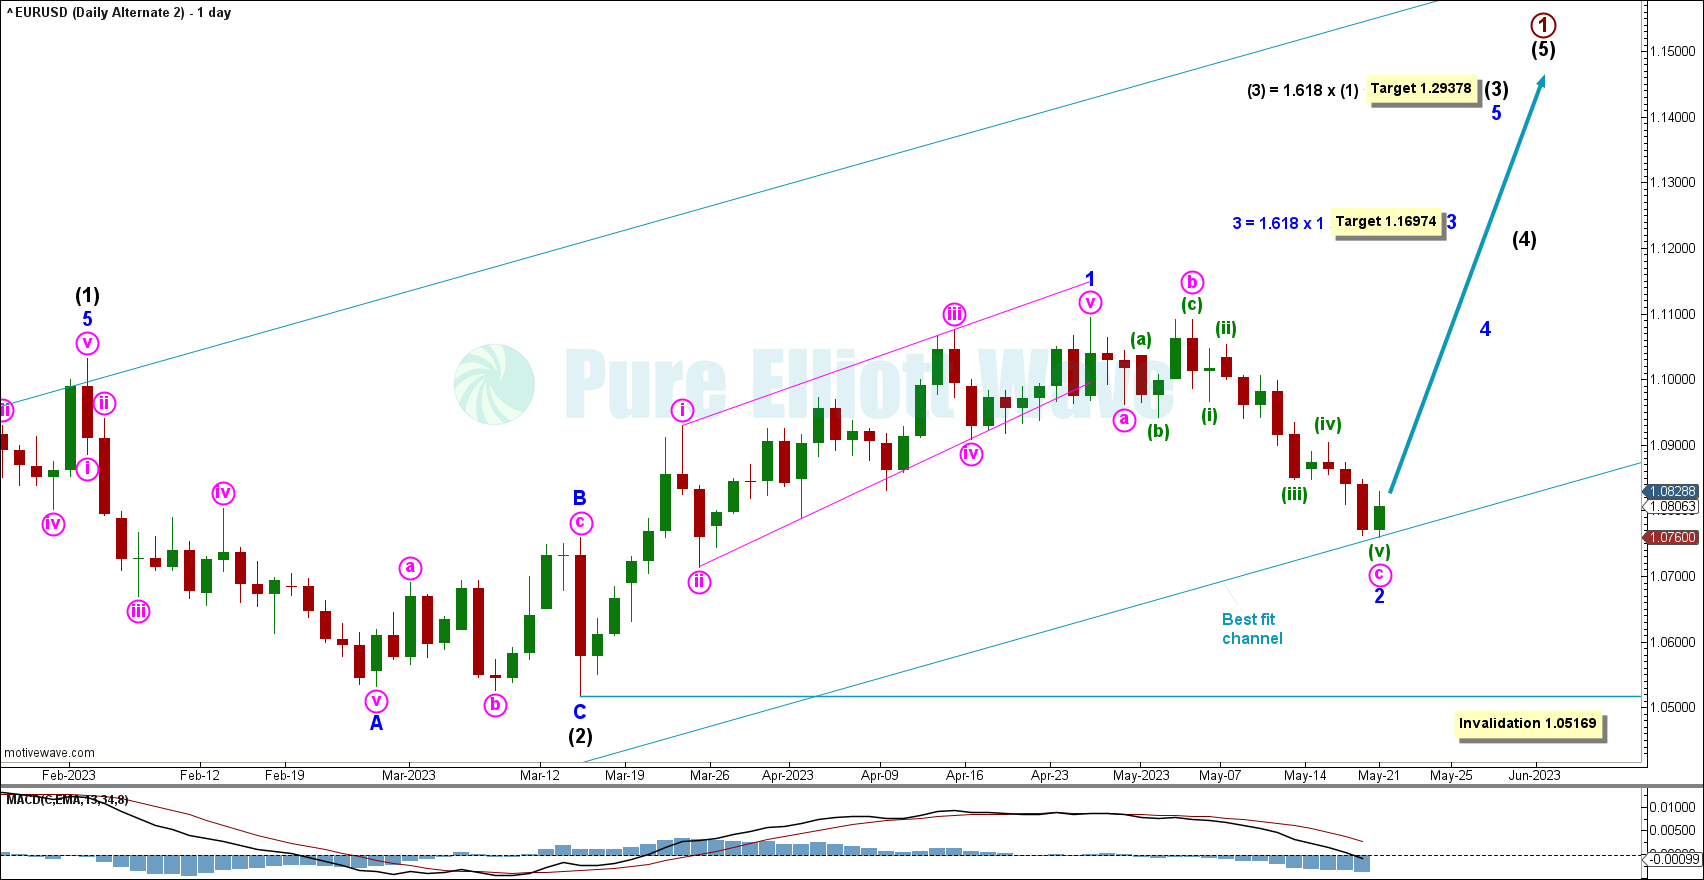
Click chart to enlarge.
This daily alternate wave count shows the possibility of upwards movement.
This alternate expects a less severe is now over, but has a lower probability given the brief shallow intermediate (2).
A clean five wave structure downwards for minute wave c may indicate minor wave 2 is complete. A target has been calculated for minor wave 3 to reach the 1.618 extension of minor wave 1 at 1.16974. There is no upwards invalidation for this alternate. Downwards invalidation sits below at the start of minor wave 1 at 1.05169.
ALTERNATE HOURLY CHART
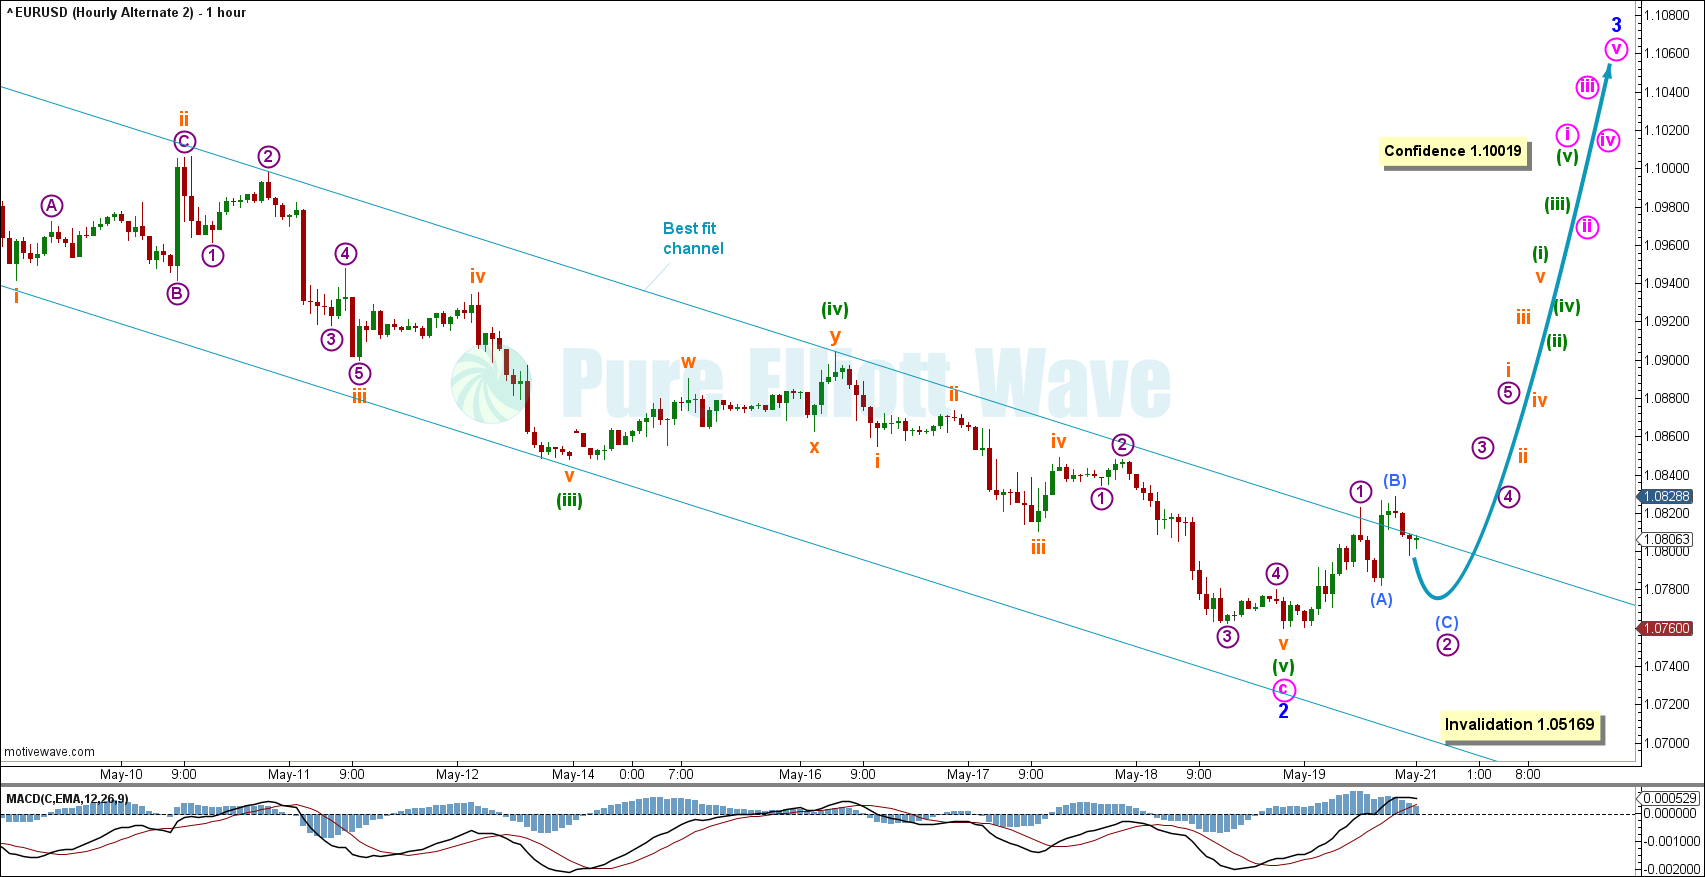
Click chart to enlarge.
This alternate reflects the short-term possibility that minor wave 3 may be in its very early stages.
If the blue best fit channel is broken and price remains above it, then this could be a sign the short-term bear trend is over.
The confidence level at 1.10019 is the level at which the main wave count is invalidated.
This count is very bullish, as 3rd waves often contain the most bullish price action. Especially since minor wave 1 was a diagonal (note that often times third waves extend after wave one diagonals).
TECHNICAL ANALYSIS
WEEKLY VOLUME
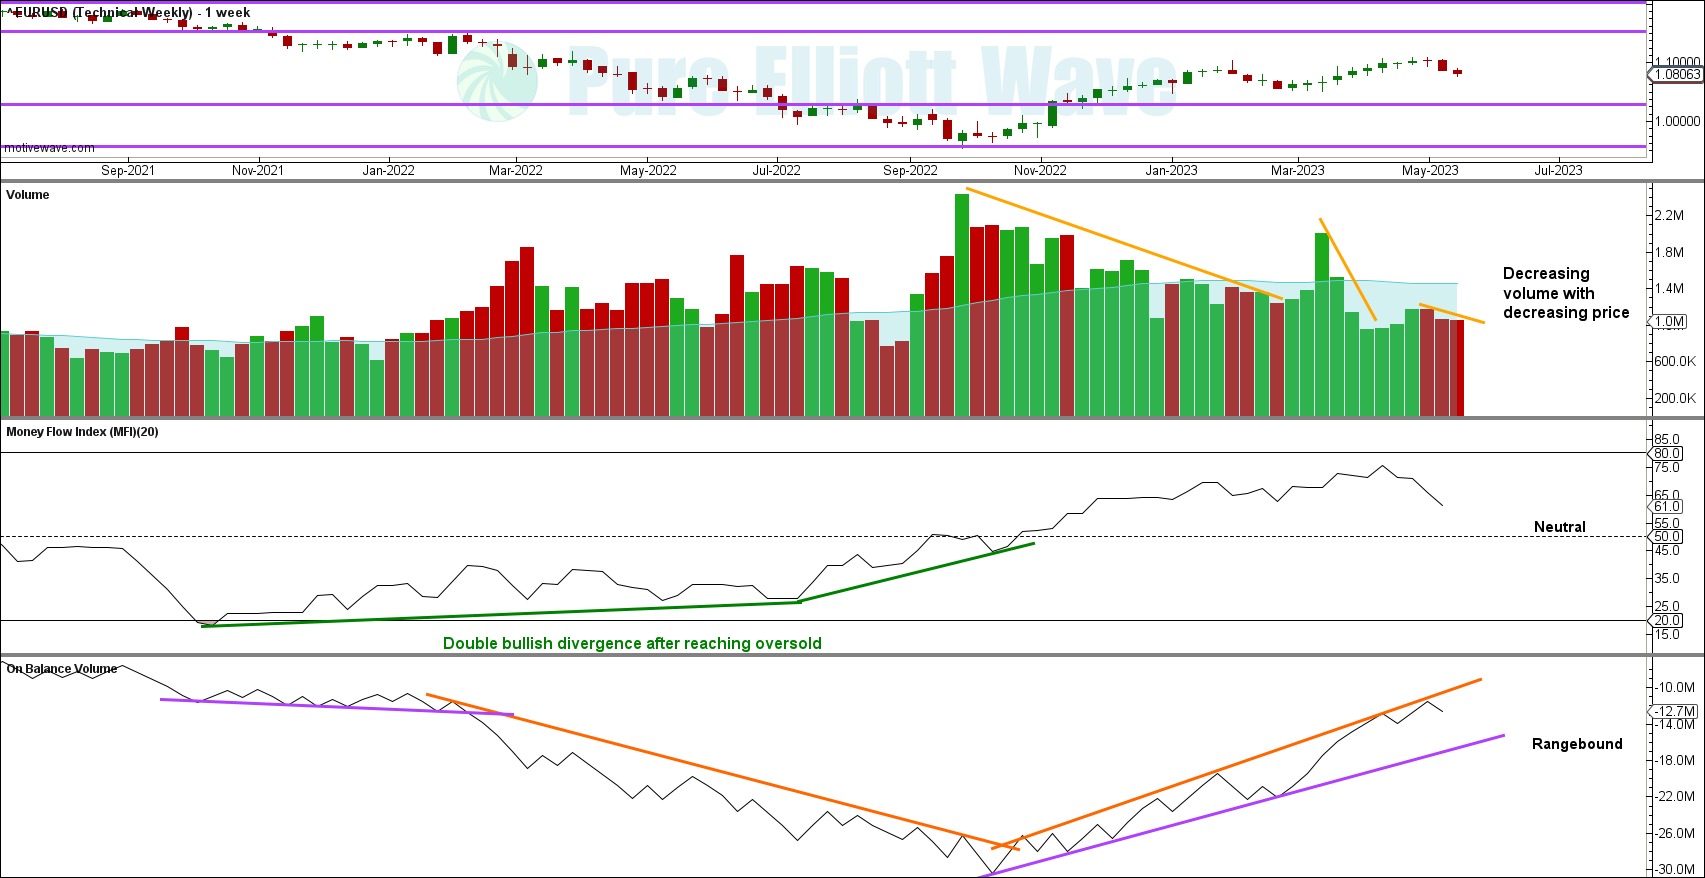
Click chart to enlarge.
Volume still decreases with a new possible trend change. This is normal for the EURUSD coming off of tops. However, this displays technical weakness for the new bear trend.
WEEKLY TECHNICALS
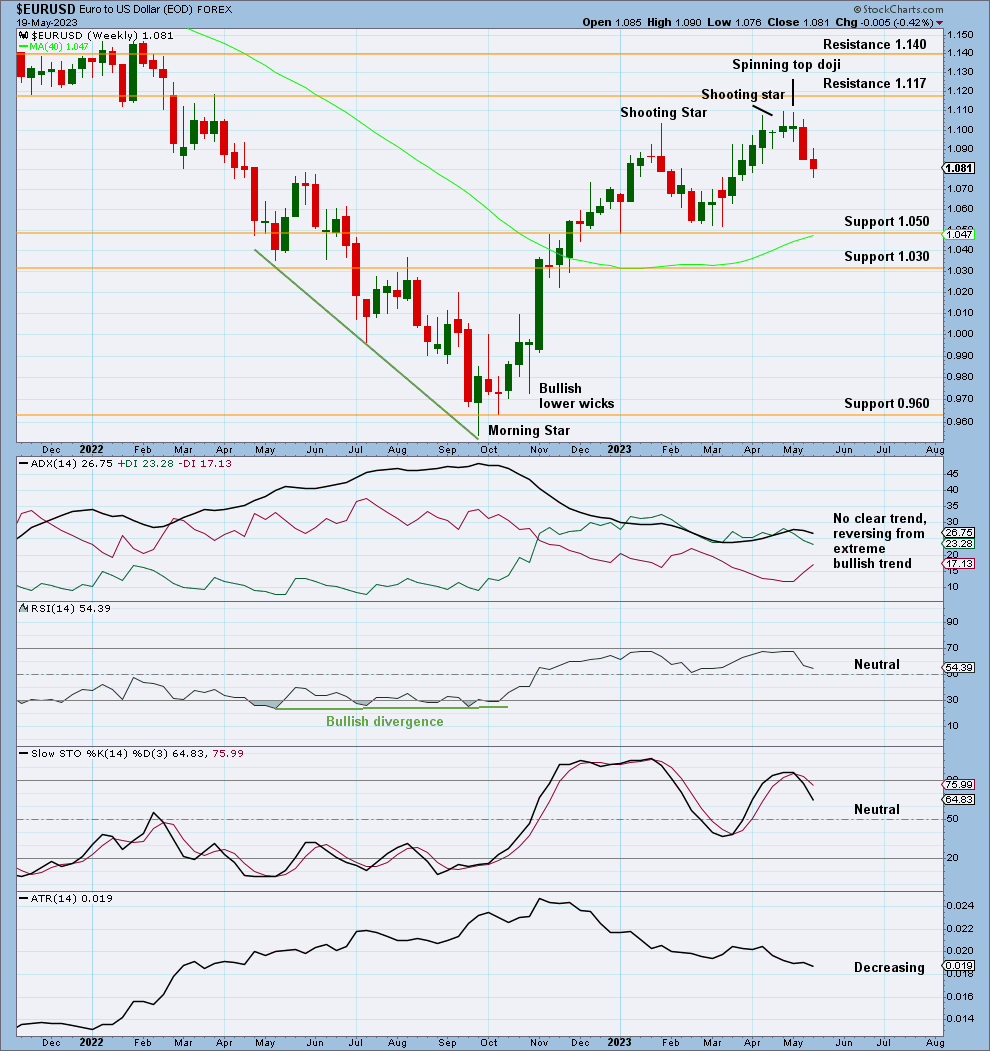
Click chart to enlarge.
This week’s candle is a smaller range bearish candle.
Next overhead resistance sits at 1.1170. Support below at 1.050.
ADX shows there is no longer a bullish trend. Price may continue lower until Stochastics reaches oversold, or support is hit around 1.050.
This chart is bearish, but with ATR declining volatility may be limited.
DAILY VOLUME
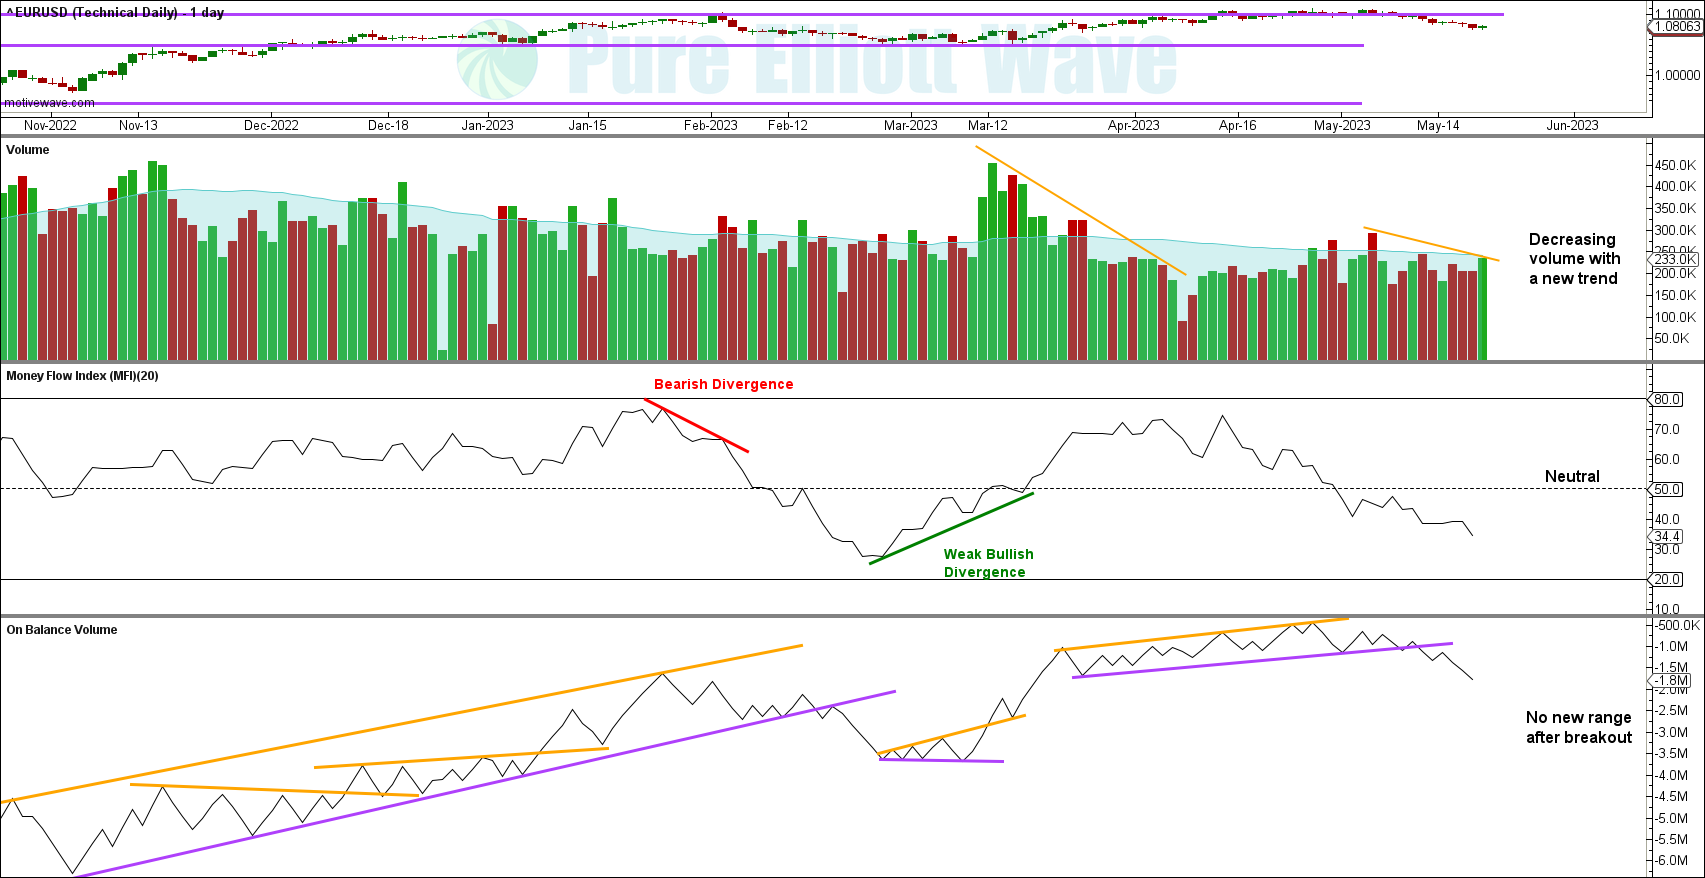
Click chart to enlarge.
A small increase in volume is seen today, but with price remaining in the short-term bear best fit channel upside movement could be limited.
The past week shows a decrease in volume with bearish price action. This is normal for tops on the EURUSD when studying past price/volume action. However, it should be noted downwards movement could be limited based on volume and ATR decreasing.
There was a strong bearish signal from On Balance Volume. The signal is strong due to the slope being reasonably flat and the line tested 4-6 times and held for a reasonably long amount of time.
DAILY TECHNICALS
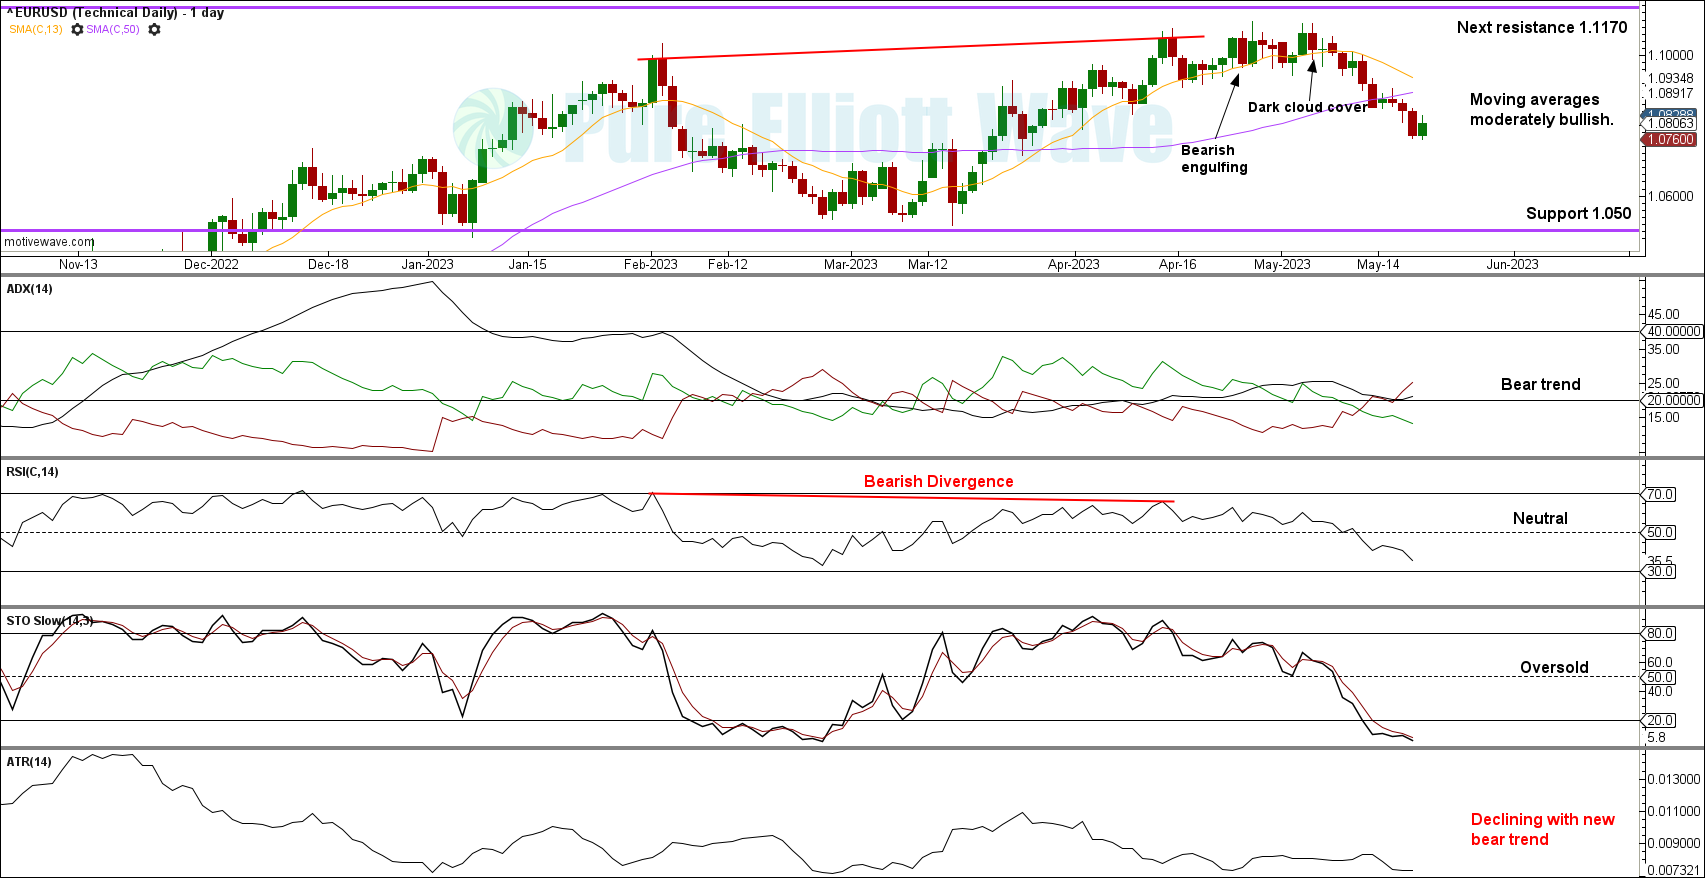
Click chart to enlarge.
ADX indicates a bearish trend, not yet extreme. The trend could continue downwards.
The moving averages are moderately bullish, all sloping up, with the 13 day now sloping down.
This chart is bearish for the medium term. Overall decreasing ATR suggests volatility could be limited downwards. Technicals still agree with the main Elliott Wave count.
Published @ 09:34 p.m. ET.
—
Careful risk management protects your trading account(s).
Follow our two Golden Rules:
1. Always trade with stops.
2. Risk only 1-5% of equity on any one trade.
—
New updates to this analysis are in bold.
—
 Save as PDF