July 13, 2023: DXY U.S. Dollar Index Elliott Wave and Technical Analysis – Charts and Video
Summary: The bigger picture for the Dollar expects overall downwards movement for the long term, most likely to not make a new low below 70.69.
For the short term, a strong third wave down may have begun. Price is expected to find resistance around the 96.68 area next.
Technicals support a long-term top during September 2022. A long-term trend shift may be in effect for years to come.
The quarterly chart was last updated here.
MONTHLY
Click chart to enlarge.
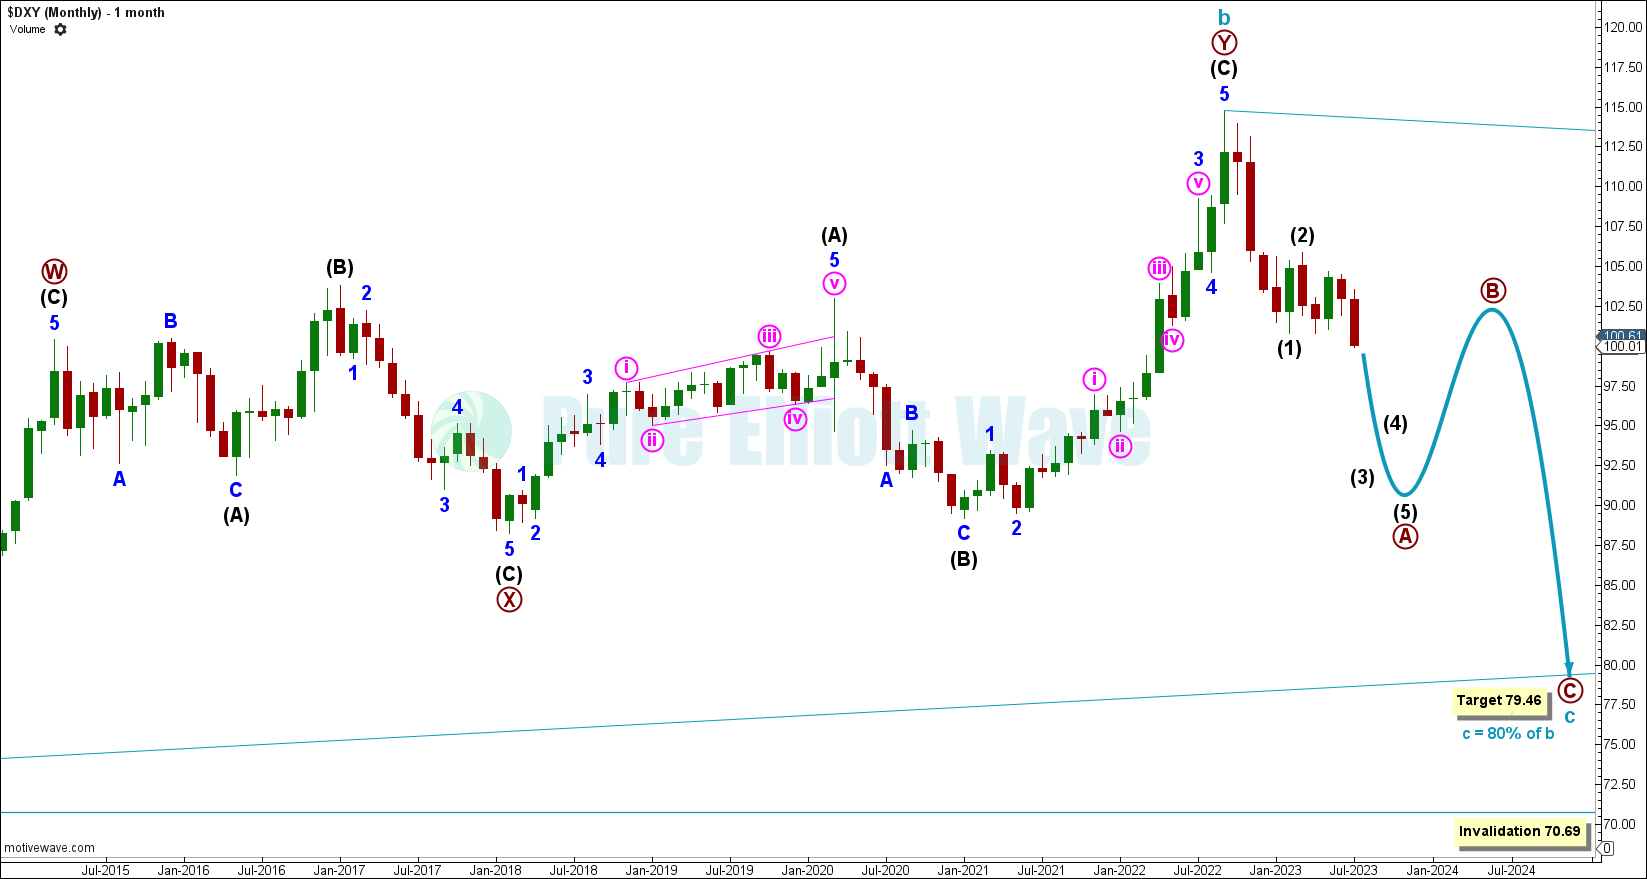
The monthly chart focuses on cycle wave b and the start of cycle wave c.
Cycle wave b may be complete, with a top in september 2022. Within a contracting triangle, all waves must subdivide as zigzags or multiple zigzags with only one subwave being a multiple. Within the primary A-B-C zigzag for cycle wave c, intermediate waves (1) and (2) of primary wave A may be complete.
The bear market is expected to resume downwards.
WEEKLY CHART
Click chart to enlarge.
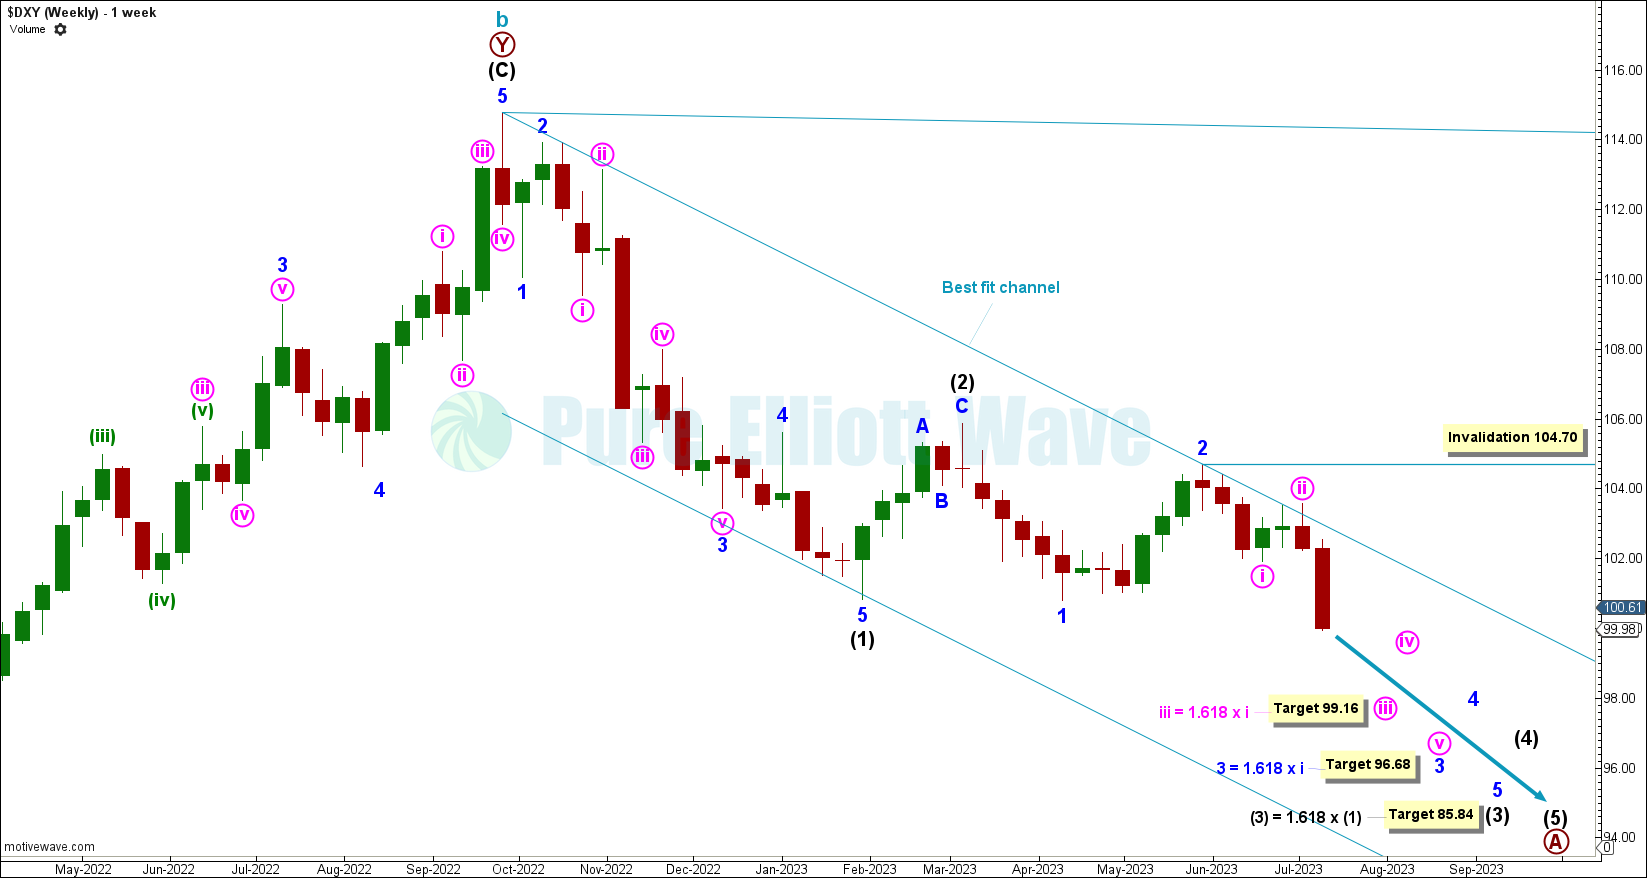
The weekly chart focuses on the end of cycle wave b, and gives more detail on primary wave A.
Intermediate wave (1) may be complete as a very clean impulse. Impulses indicate the main direction of the trend one degree larger, so this supports the major trend reversal from the top in September 2022.
With price breaking downwards, intermediate wave (2) may be complete as a brief zigzag correction. With Intermediate wave (2) possibly complete, a series of 1-2 waves are possibly complete at minor and minute degree extending inside intermediate wave (3).
A target is calculated for minute wave iii to reach the 1.618 extension of minute wave i at 99.16.
A target is calculated for minor wave 3 to reach the 1.618 extension of minor wave 1 at 96.68.
A target is calculated for intermediate wave (3) to reach the 1.618 extension of intermediate wave (1) at 85.84.
Invalidation for the motive structure downwards sits above at 104.70 where minute wave ii may not move beyond the start of minute wave i. The best fit channel may also act as a guide for bullish bounces to find resistance.
Price may continue sharply downwards. However, if more overlapping waves are observed a diagonal may be unfolding. The invalidation at 104.70 factors in the diagonal idea.
DAILY CHART
Click chart to enlarge.
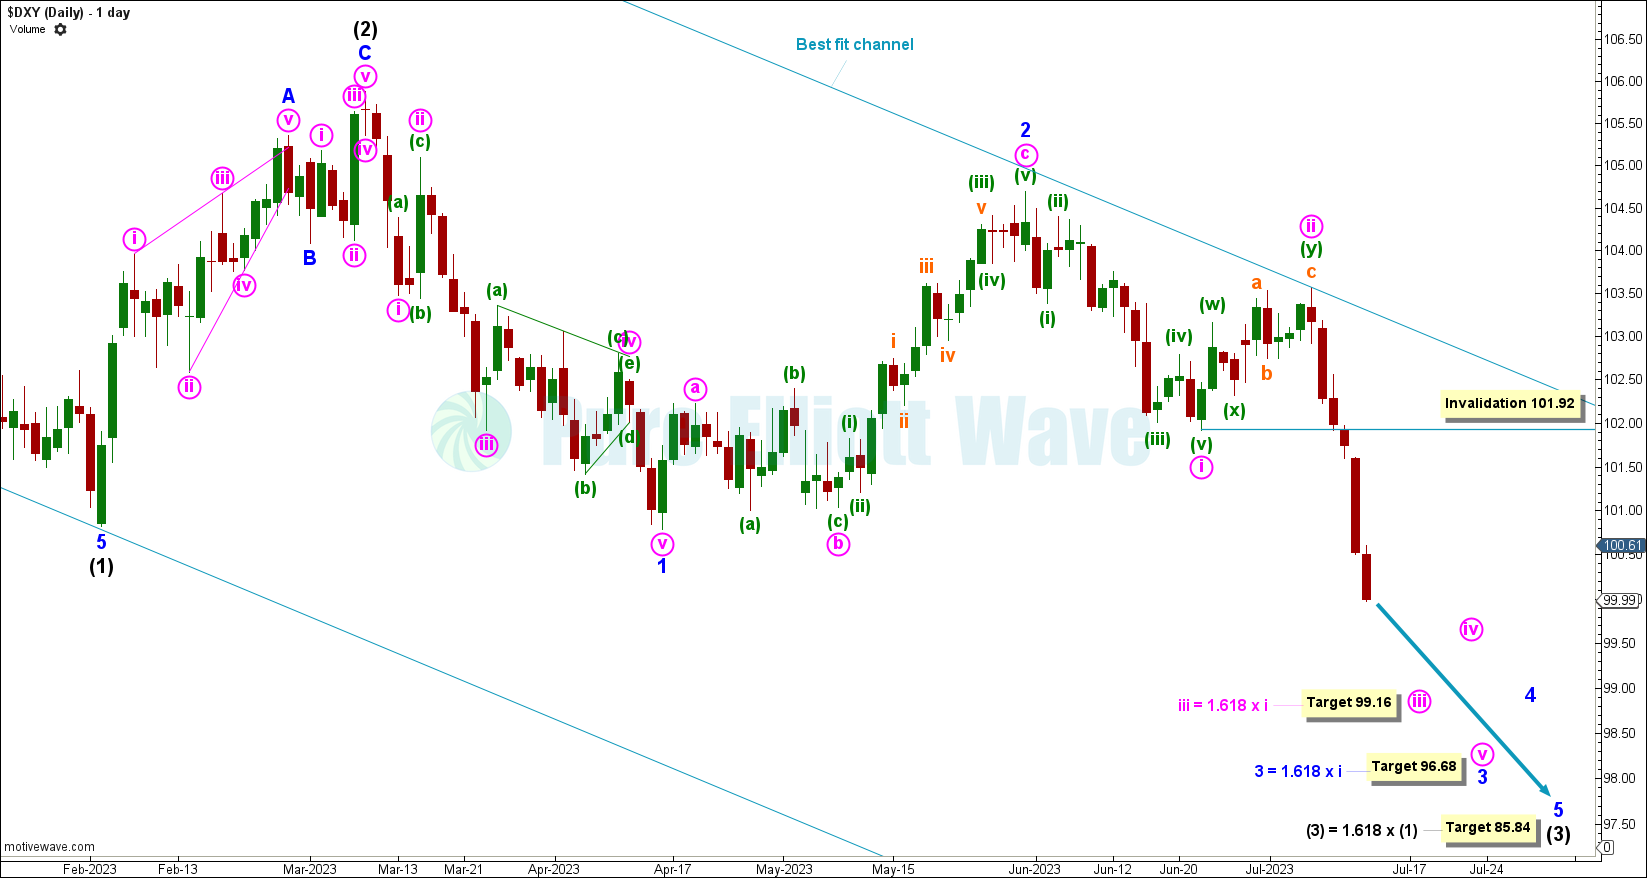
Price is now moving swiftly downwards. Technicals support a top in June 2023 with multiple Evening Stars.
This chart focuses on the end of intermediate wave (1), intermediate wave (2), and intermediate wave (3) now extending downwards. Third waves are often the sharpest movement of price; we are potentially seeing that now.
Within intermediate wave (3): Minor waves 1 and 2 may be complete and minor wave 3 may extending downwards now.
Within minor wave 3: Minute waves i and ii may be complete and minute wave iii is moving downwards now. A target is calculated for minute wave iii to reach the 1.618 extension of minute wave i at 99.16. However, with this being a possible third wave down, price could exceed that.
The invalidation given assumes we are in a third wave. If this is the third wave, then minute wave iv may not enter the price territory of minute wave i above 101.92. A longer-term invalidation can be seen on the weekly chart for the motive wave downwards above 104.70.
This wave count expects a medium-term bear trend is in full force.
TECHNICAL ANALYSIS
MONTHLY CHART
Click chart to enlarge.
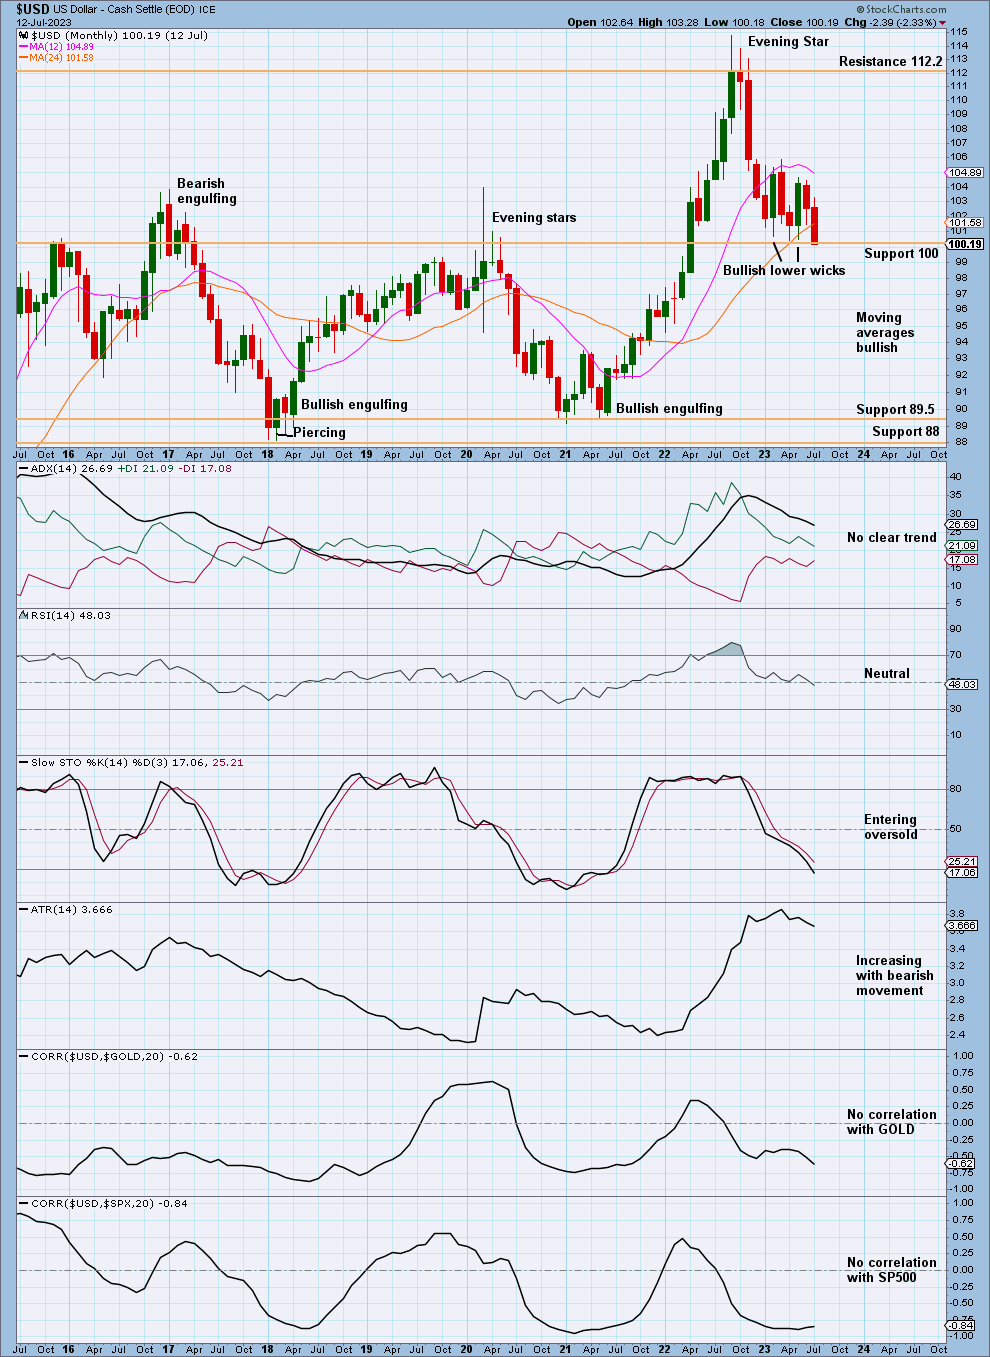
On the monthly chart, support is being tested around 100, but this July candlestick is not even half way complete.
Stochastics is entering oversold with price at support and no clear trend on ADX. Price movement could be limited to the downside.
WEEKLY CHART
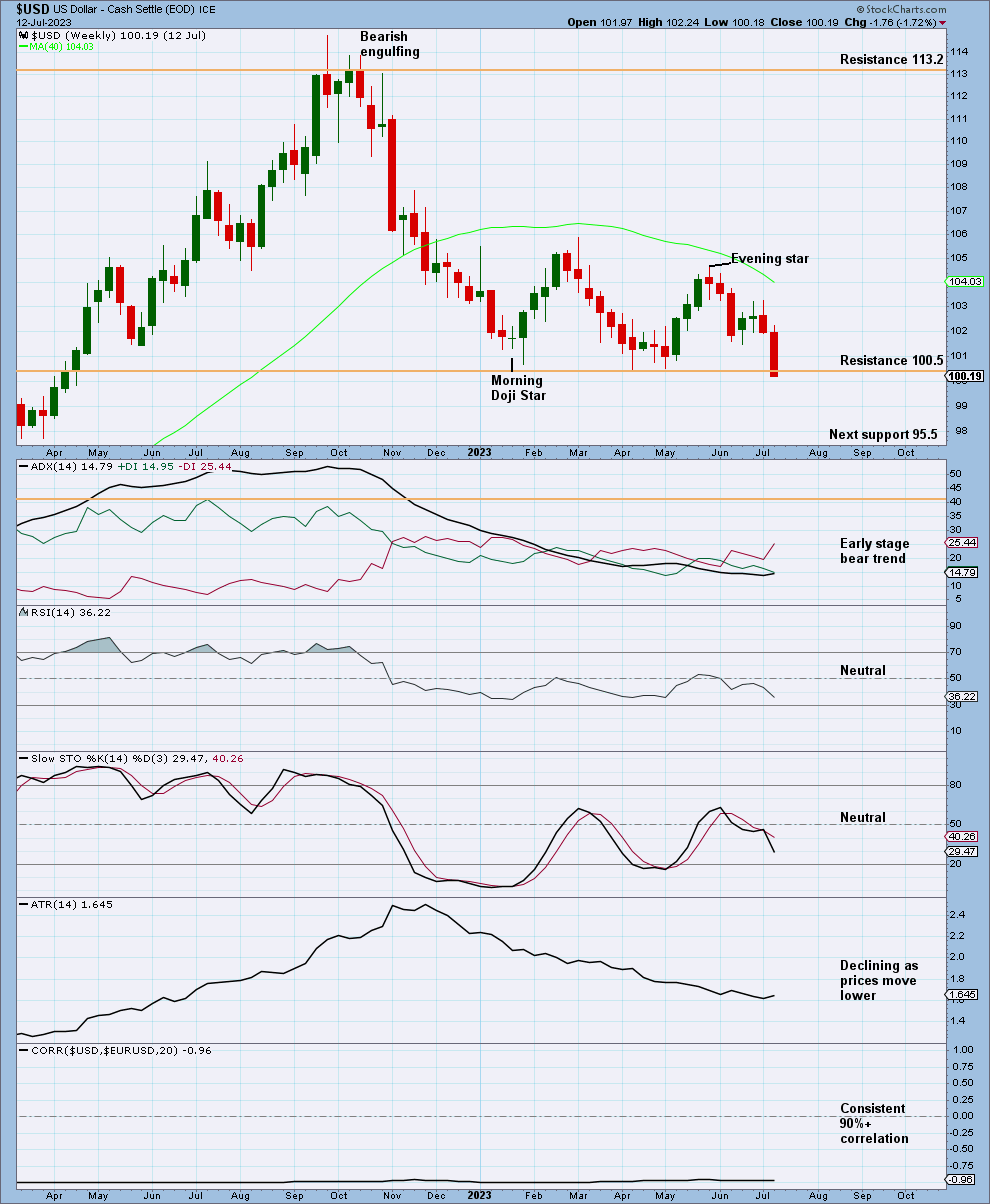
Click chart to enlarge.
The weekly chart shows the 200 day moving average sloping down and price trading below.
Recent strong bearish candlesticks add support to the Elliott wave count.
Price is now testing resistance at 100.5, but has not clearly broken it yet.
ADX shows a new bear trend with much further to go.
RSI has room to move downwards until it reaches oversold.
Correlation between the EURUSD and DXY is consistently below -0.9, showing a statistically reliable inverse relationship.
DAILY CHART
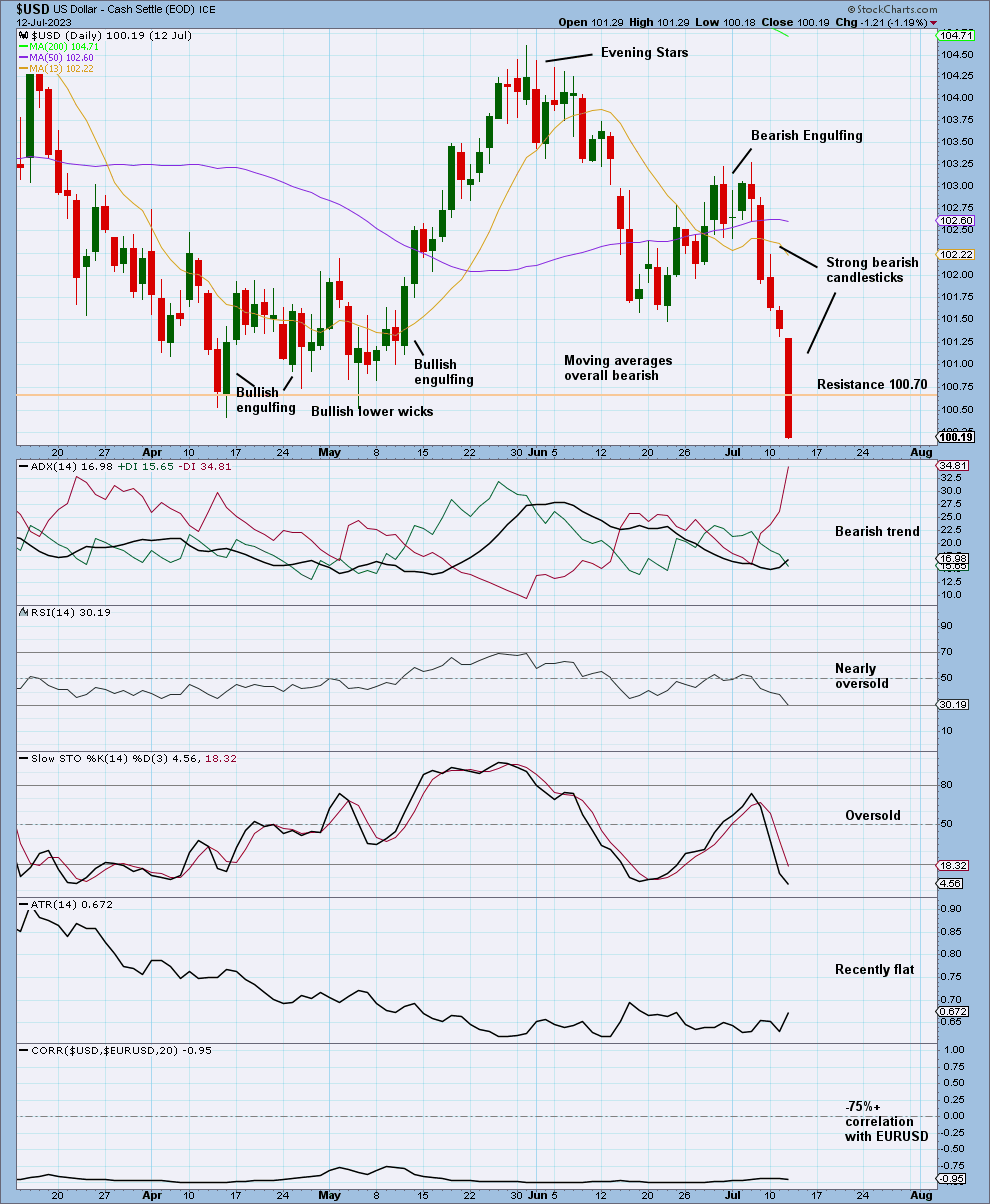
Click chart to enlarge.
A series of Evening Stars (which may more correctly be named Tower Tops) in late May and early June add support for a prolonged top there. Additionally, there was a Bearish Engulfing candlestick in late June giving us ample warning of this move.
A new bearish trend is in force with ADX, but RSI is nearly oversold.
Price may continue downwards until RSI is deeply oversold, ADX is extreme, or support is reached around 95 (see weekly chart). This correlates well with the Elliott wave count.
Published @ 06:15 p.m. ET.
—
Careful risk management protects your trading account(s).
Follow our two Golden Rules:
1. Always trade with stops.
2. Risk only 1-5% of equity on any one trade.
—
New updates to this analysis are in bold.
—
 Save as PDF