August 1, 2023: DXY U.S. Dollar Index Elliott Wave and Technical Analysis – Charts and Video
Summary: The bigger picture for the Dollar expects overall downwards movement for the long term, most likely to not make a new low below 70.69.
For the short term, a strong third wave down may have begun. Price is expected to find resistance around the 96.68 area next.
Technicals support a long-term top during September 2022. A long-term trend shift may be in effect for years to come.
With the bullish look of July’s candle, we offer an alternate Elliott wave count that expects bullish price movement over the medium term.
The quarterly chart was last updated here.
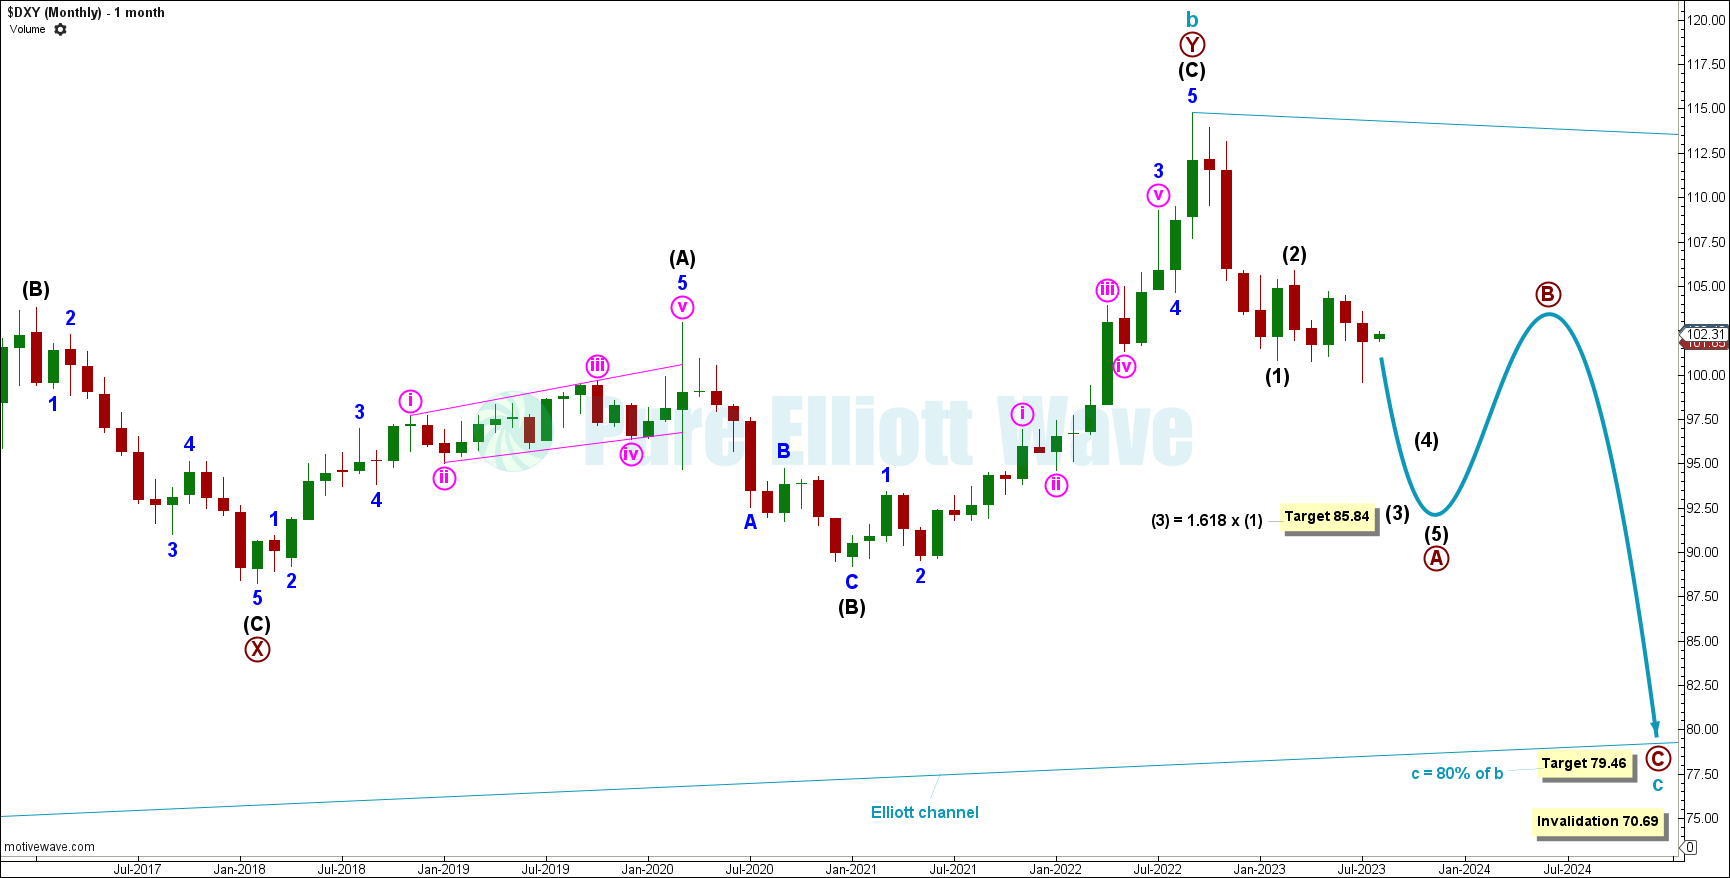
MONTHLY
Click chart to enlarge.
The monthly chart focuses on cycle wave b and the start of cycle wave c.
Cycle wave b may be complete, with a top in September 2022. Within a contracting triangle, all waves must subdivide as zigzags or multiple zigzags with only one subwave being a multiple. Within the primary A-B-C zigzag for cycle wave c, intermediate waves (1) and (2) of primary wave A may be complete.
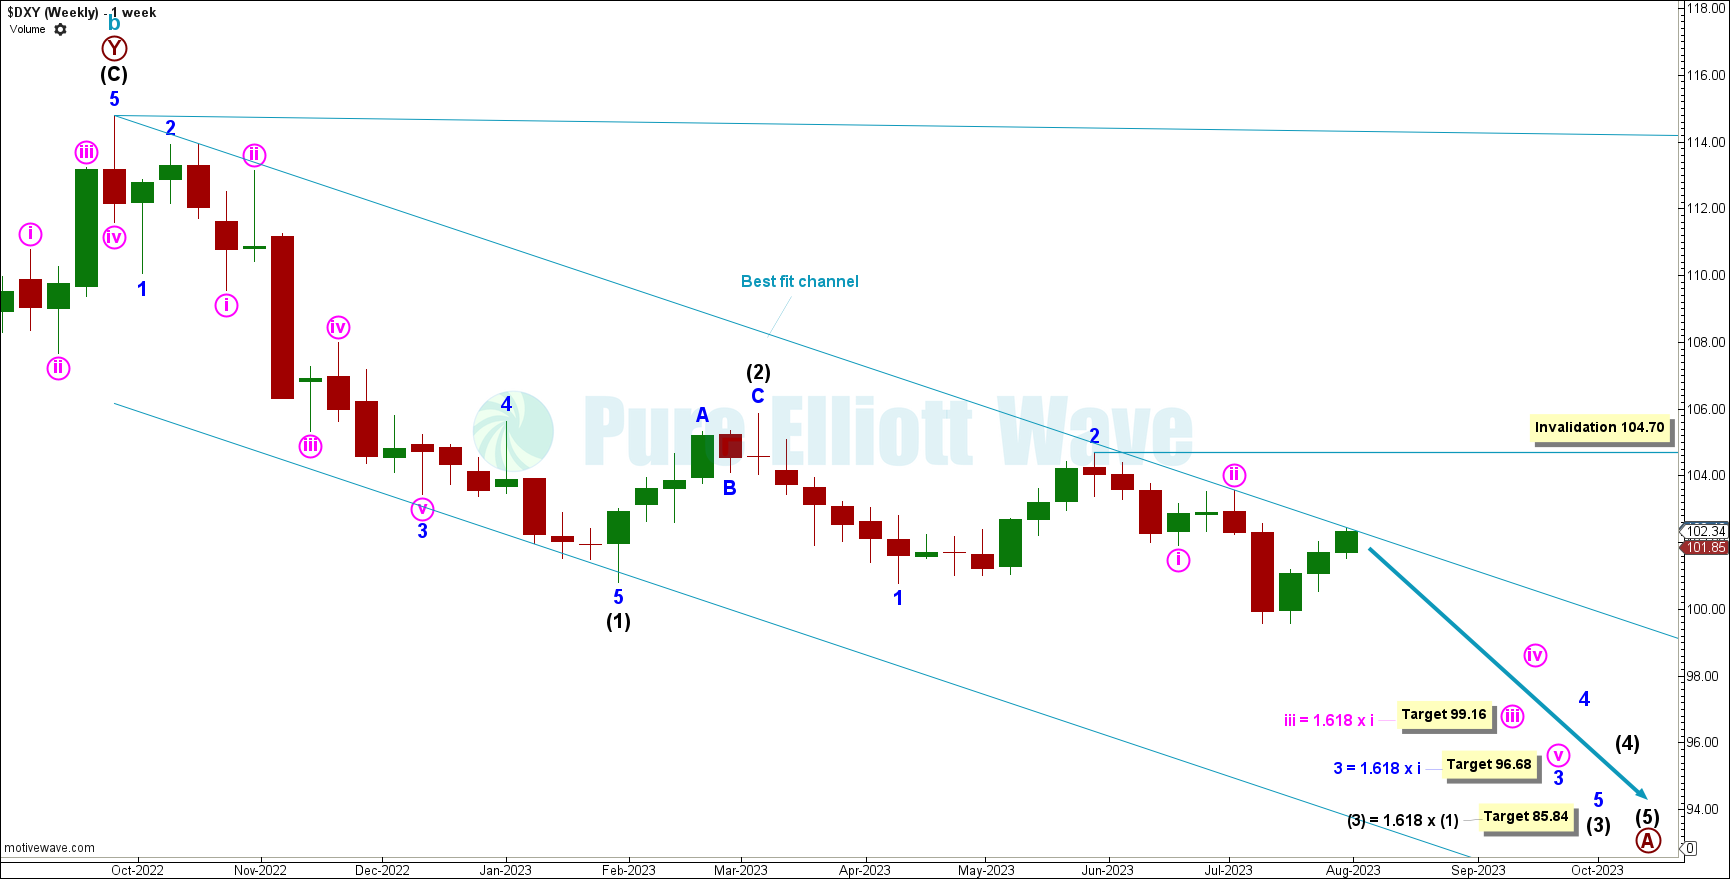
WEEKLY CHART
Click chart to enlarge.
The weekly chart focuses on the end of cycle wave b, and gives more detail on primary wave A.
Intermediate wave (1) may be complete as a very clean impulse. Impulses indicate the main direction of the trend one degree larger, so this supports the major trend reversal from the top in September 2022.
With price breaking downwards, intermediate wave (2) may be complete as a brief zigzag correction. With Intermediate wave (2) possibly complete, a series of 1-2 waves are possibly complete at minor and minute degree extending inside intermediate wave (3).
A target is calculated for minute wave iii to reach the 1.618 extension of minute wave i at 99.16.
A target is calculated for minor wave 3 to reach the 1.618 extension of minor wave 1 at 96.68.
A target is calculated for intermediate wave (3) to reach the 1.618 extension of intermediate wave (1) at 85.84.
Invalidation for the motive structure downwards sits above at 104.70 where minute wave ii may not move beyond the start of minute wave i. The best fit channel may also act as a guide for bullish bounces to find resistance.
The invalidation above would be a total shift to the bullish alternate Elliott wave count. A break of the best fit channel would shift the alternate Elliott wave count to the main Elliott wave count.
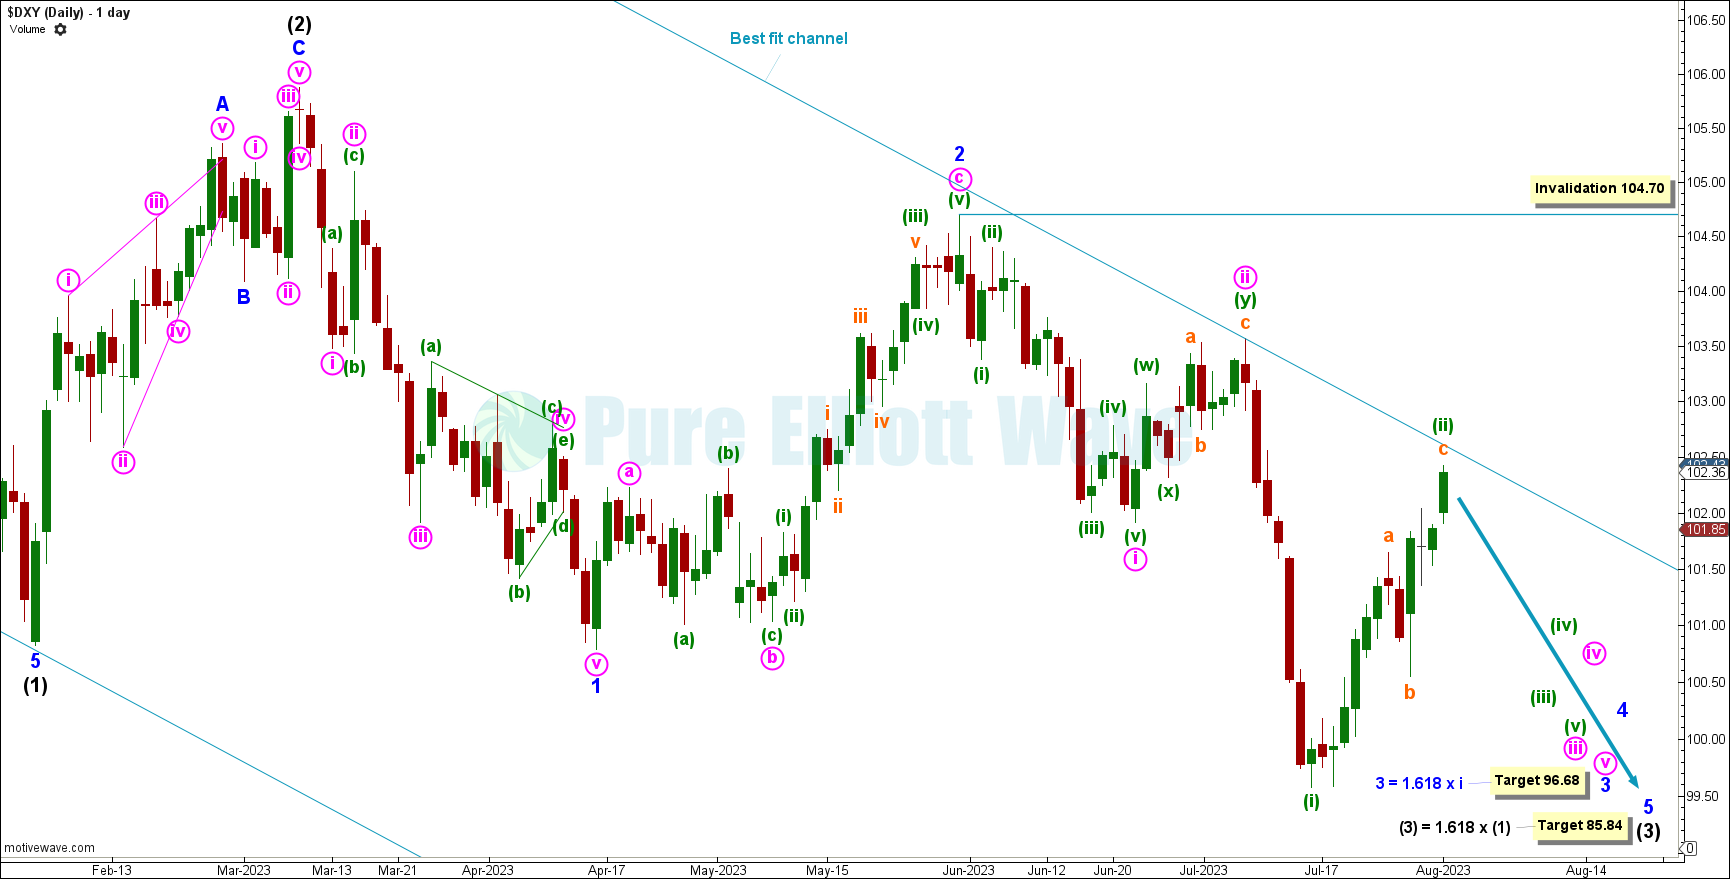
DAILY CHART
Click chart to enlarge.
This chart focuses on intermediate wave (2) and intermediate wave (3) now extending downwards. Third waves are often the sharpest movement of price. There was a sharp move down for minuette wave (i) followed by a swift move up for minuette wave (ii). These could be another first and second waves, at minuette degree, after the first and second waves at minute degree.
Within intermediate wave (3): Minor waves 1 and 2 may be complete and minor wave 3 may extending downwards now.
Within minor wave 3: Minute waves i and ii may be complete and minute wave iii may be extending now.
A target is calculated for minute wave iii to reach the 1.618 extension of minute wave i at 99.16. However, with this being a possible third wave down, price could exceed that.
Invalidation at 104.70 is where minor wave 3 moves beyond the start of minor wave 1. This invalidation helps account for a leading expanding diagonal
This wave count expects a medium-term bear trend is in full force.
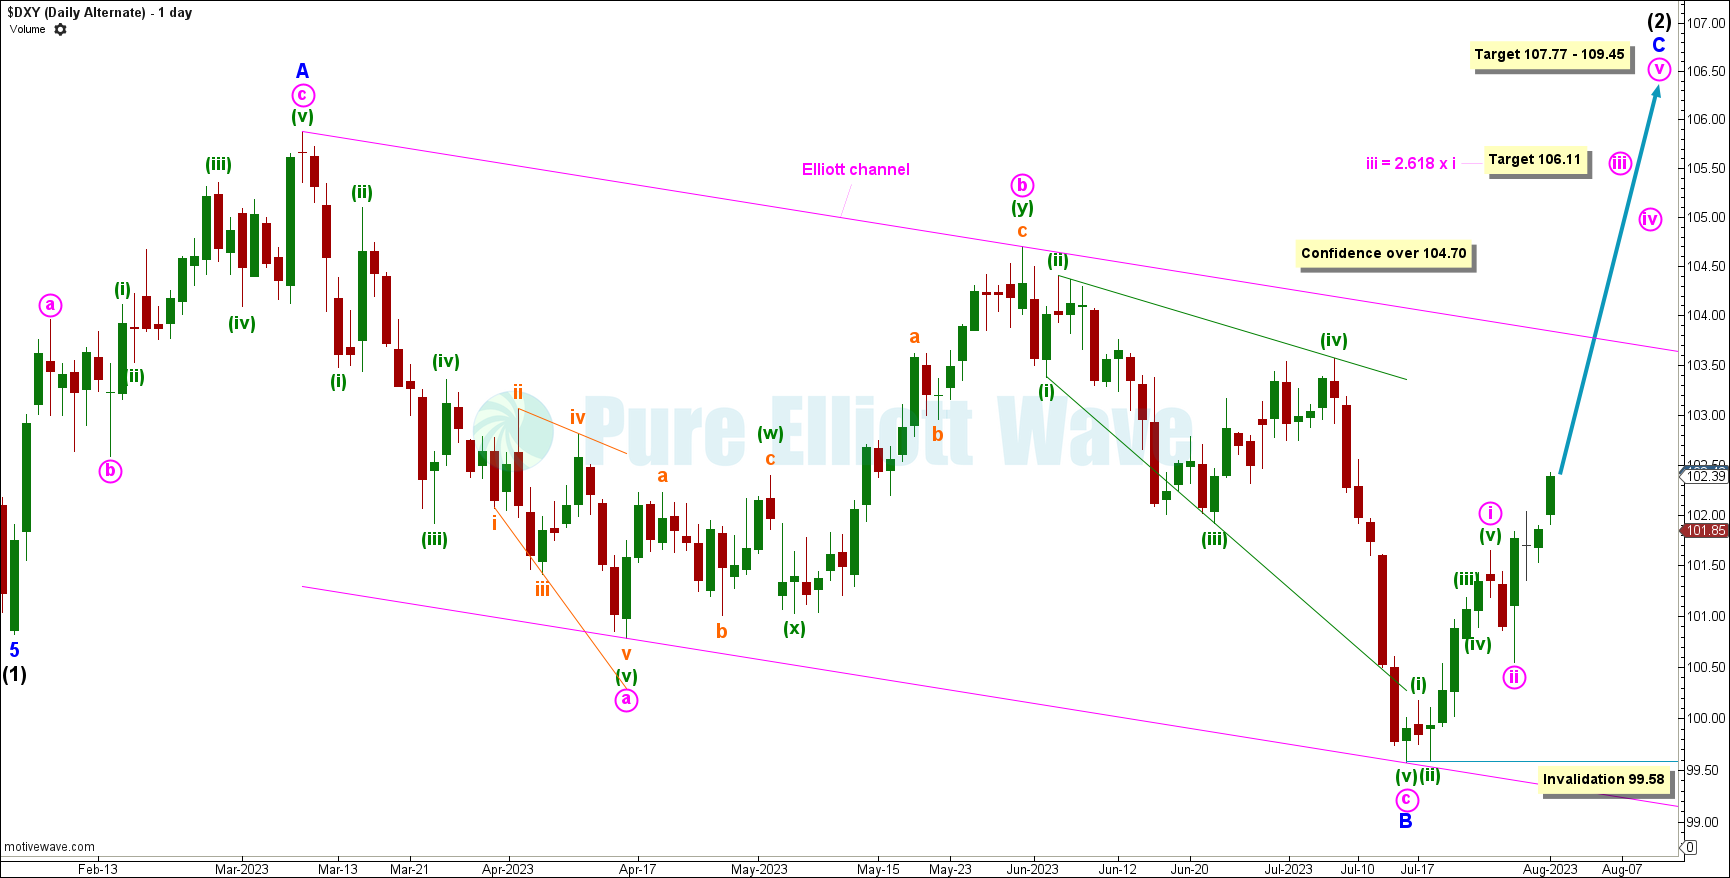
ALTERNATE WAVE COUNT
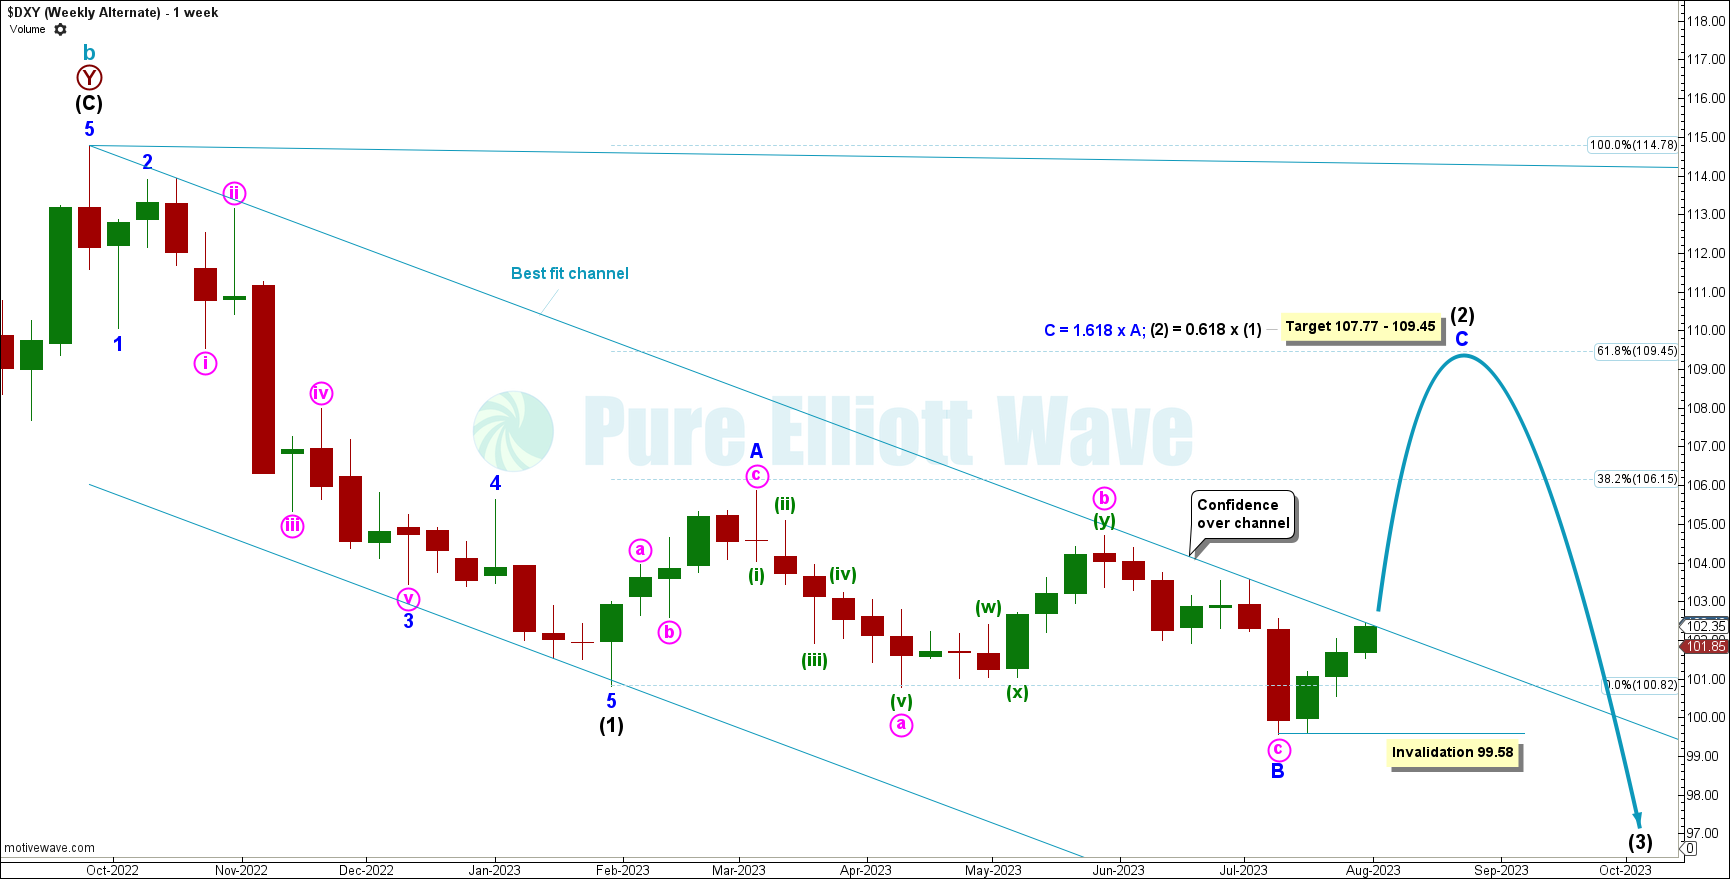
WEEKLY CHART
Click chart to enlarge.
This alternate weekly chart focuses on intermediate wave (1) and intermediate wave (2), which is underway as a expanded flat.
This wave count is very bullish for the short term. The targets above are where minor wave C reaches equality with minor wave A at 107.77, and where intermediate wave (2) reaches the 0.618 retracement at 109.45. This gives us a target zone of 107.77-109.45.
In an expanded flat, minor wave C must subdivide as a 5 wave motive structure. Invalidation for that structure is where minute wave ii moves beyond the start of minute wave i below 99.58.
DAILY CHART
Click chart to enlarge.
Looking closer inside intermediate wave (2), we can see minor waves A and B complete and minor wave C possibly moving upwards now.
The Elliott channel provided support with remarkable accuracy at the bottom edge for the end of minute wave c of minor wave B. That strengthens this wave count. Confidence would be added on a break of this Elliott channel upwards.
Within minor wave C, a target is calculated for minute wave iii to reach the 2.618 extension of minute wave i at 106.11.
The confidence point over 104.70 is where the main bearish wave count is invalidated.
TECHNICAL ANALYSIS
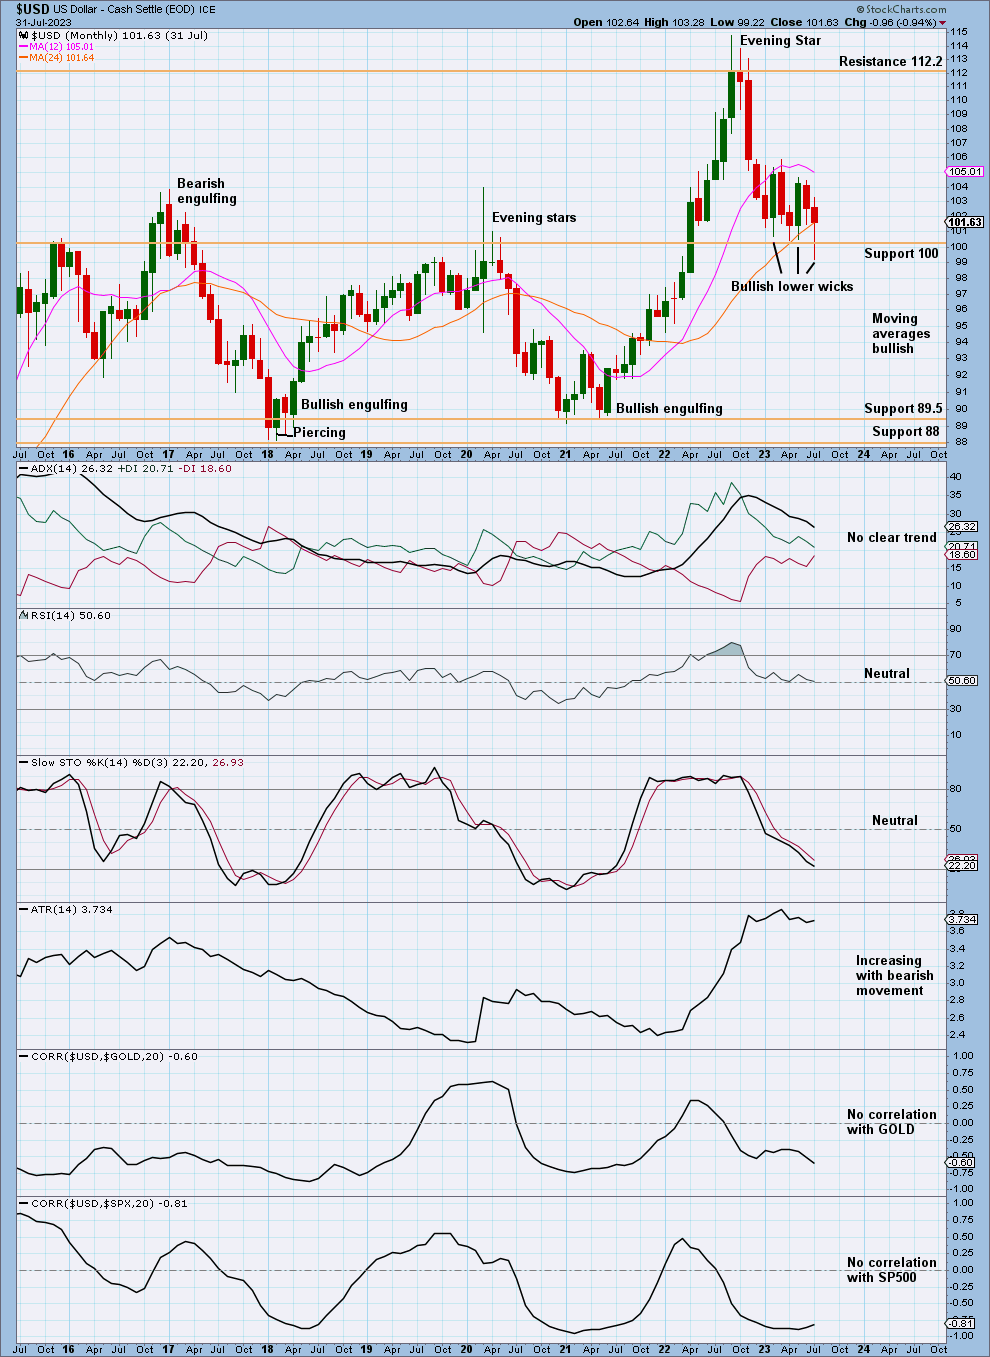
MONTHLY CHART
Click chart to enlarge.
On the monthly chart, support was tested in July but the candle closed strongly upwards, a bullish look.
Stochastics is neutral.
ADX shows no clear trend.
There is room for the trend to fall lower.
WEEKLY CHART
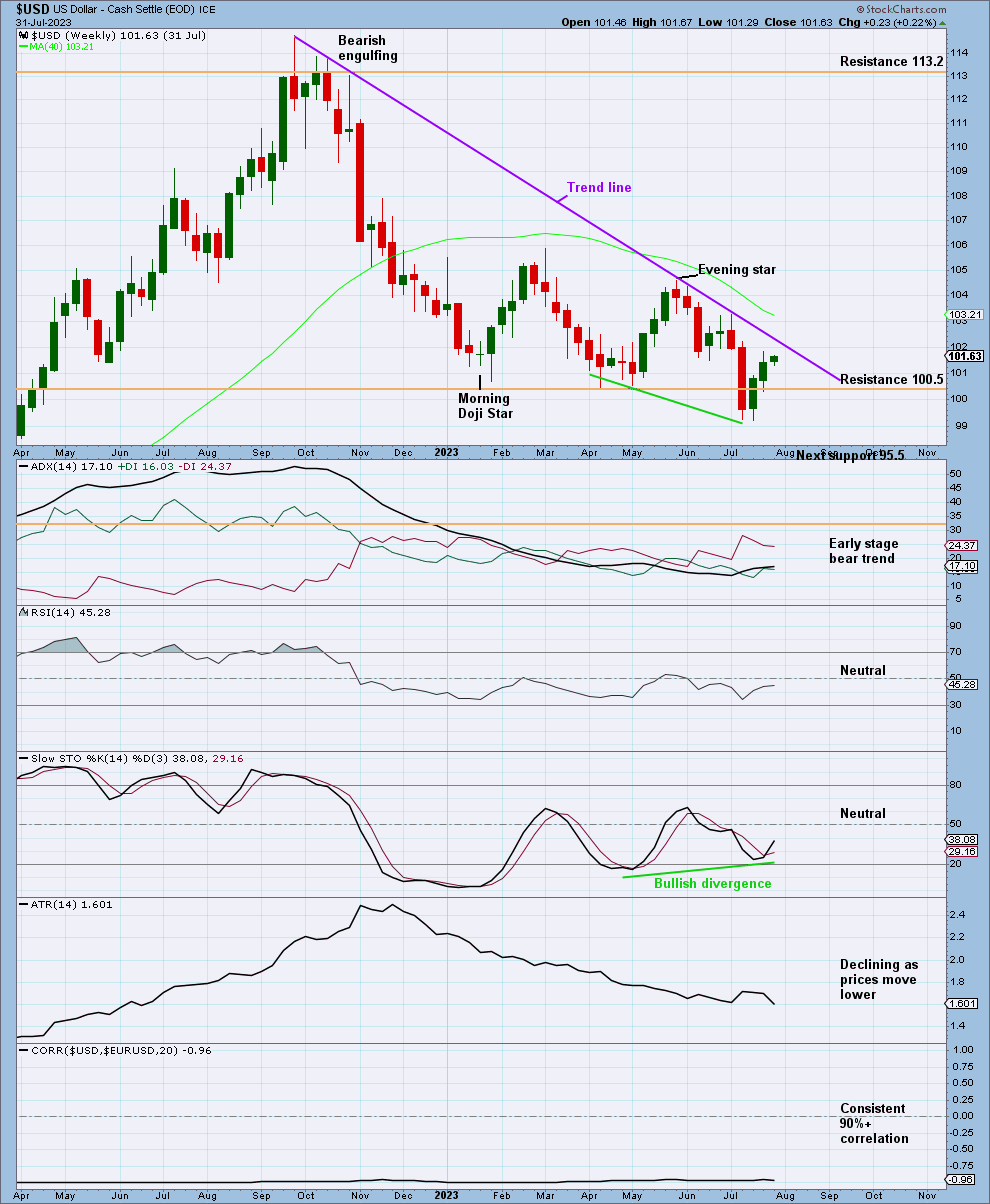
Click chart to enlarge.
The weekly chart shows the 200 day moving average still sloping down and price trading below.
The trend line above is very technically significant with 5 tests.
Some bullish divergence between Stochastics and price is a bullish sign. However, this divergence is not as strong as divergency with RSI.
Correlation between the EURUSD and DXY is consistently below -0.9, showing a statistically reliable inverse relationship.
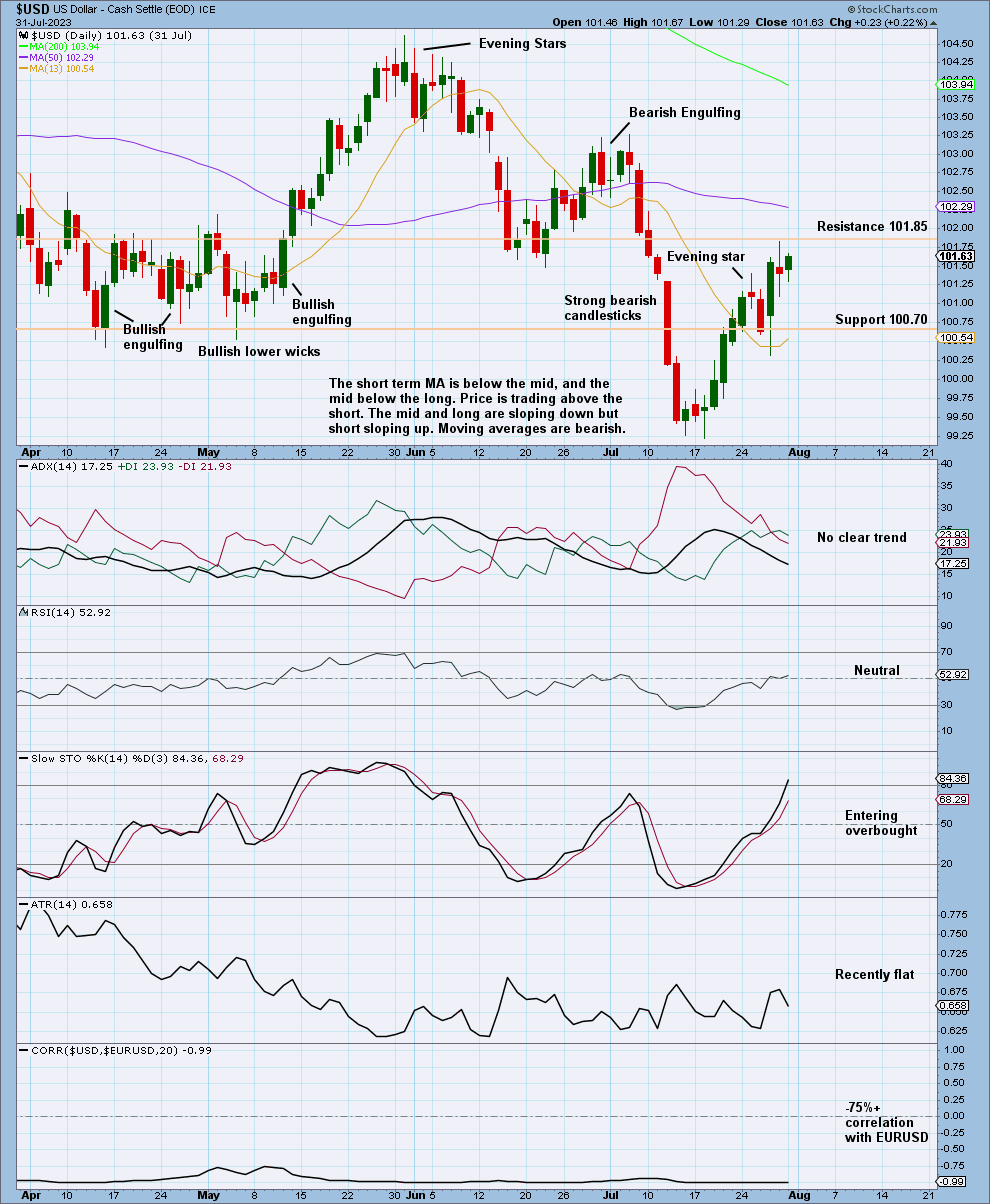
DAILY CHART
Click chart to enlarge.
Price sits between two short-term support and resistance areas. A break of either one could indicate the next price movement.
Strong bullish and bearish candlesticks in each direction is keeping ADX flat.
With ADX showing no clear trend and resistance overhead at 101.85 and Stochastics overbought, a potential pivot soon to the downside is indicated. That correlates with the trend line just above (on the weekly chart).
Overall, this chart looks bearish unless the best fit channel/trend line/resistance around 101.85 are broken upwards. At that point, we will shift to be bullish wave count for the medium term.
Published @ 07:54 p.m. ET.
—
Careful risk management protects your trading account(s).
Follow our two Golden Rules:
1. Always trade with stops.
2. Risk only 1-5% of equity on any one trade.
—
New updates to this analysis are in bold.
—
 Save as PDF