December 28, 2023: DXY U.S. Dollar Index Elliott Wave and Technical Analysis – Charts and Video
Summary: The bigger picture for the Dollar expects overall downwards movement for the long term, most likely to not make a new low below 70.69.
For the short term, a strong third wave down may have begun. Price is expected to find support around the 96.68 area.
Technicals support a long-term top during September 2022. A long-term trend shift may be in effect for years to come.
With the bullish look of July’s candle, we offer an alternate Elliott wave count that expects bullish price movement over the medium term.
The quarterly chart was last updated here.
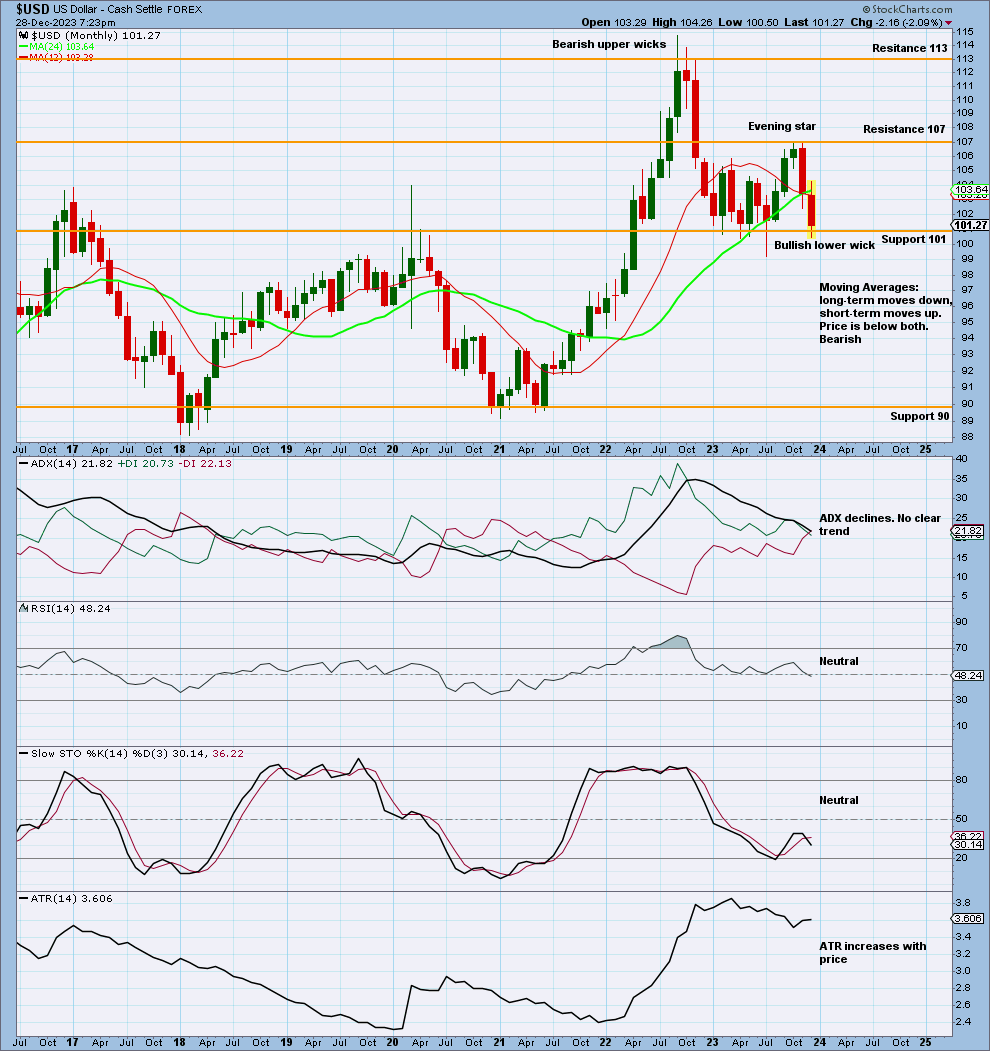
MONTHLY
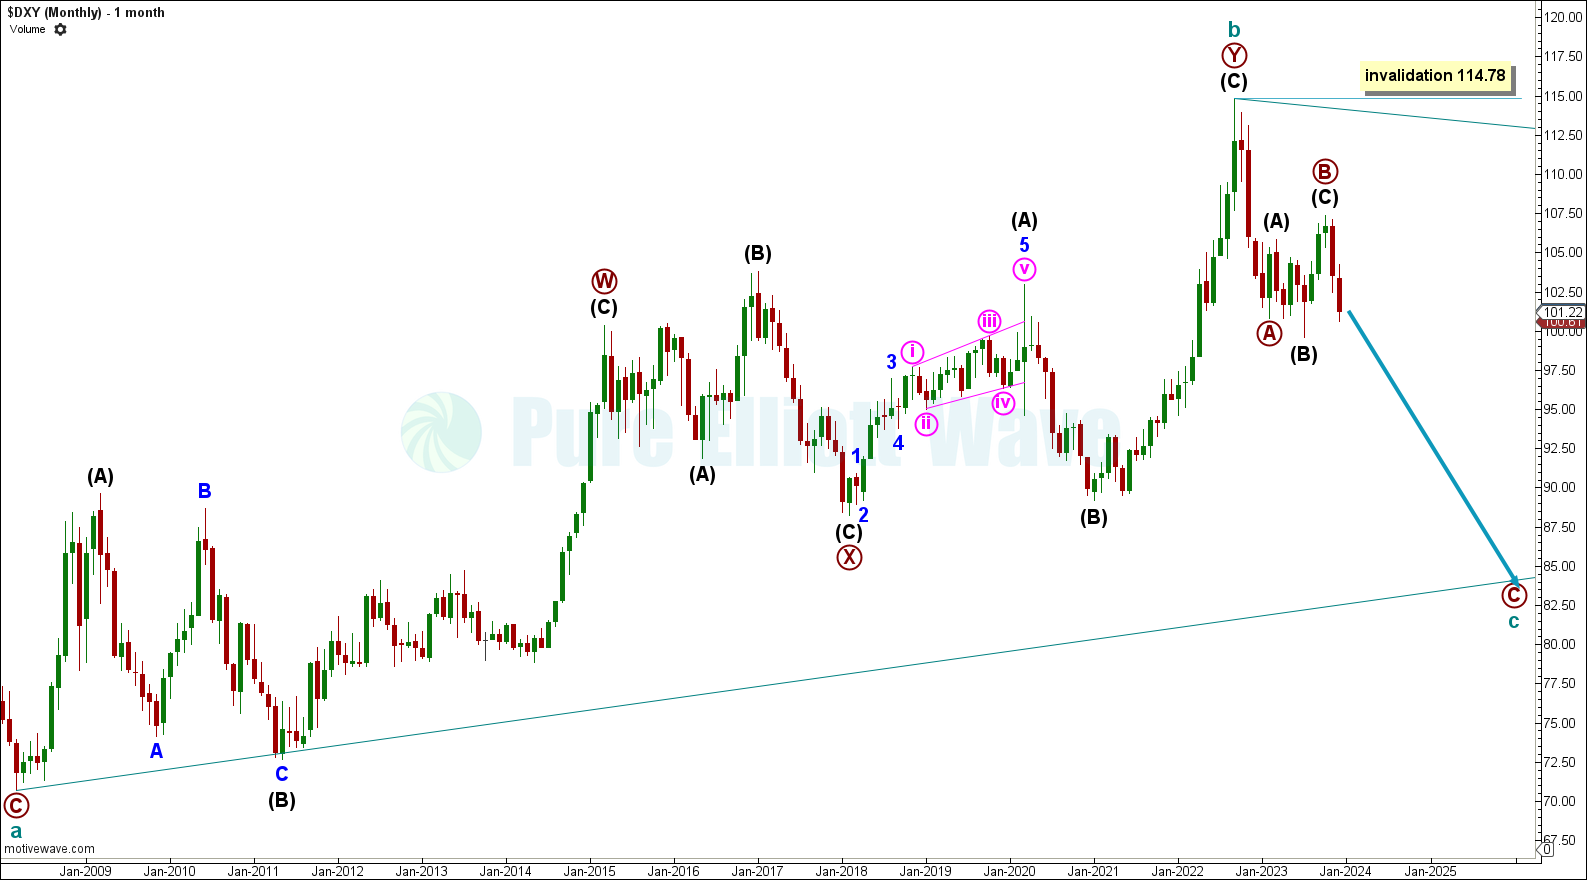
Click chart to enlarge.
The larger structure for this Elliott Wave count is a huge contracting or barrier triangle.
The monthly chart focuses on cycle wave b and the start of cycle wave c.
Cycle wave b may be complete, with a top in September 2022. Within a triangle, all waves must subdivide as zigzags or multiple zigzags with only one subwave being a multiple. Within the primary A-B-C zigzag for cycle wave c, primary waves A and B are labelled complete.
Within cycle wave c, primary wave B cannot move above the start of primary wave A at 114.78. If price moves above this point, then cycle wave b will be labelled incomplete.
WEEKLY CHART
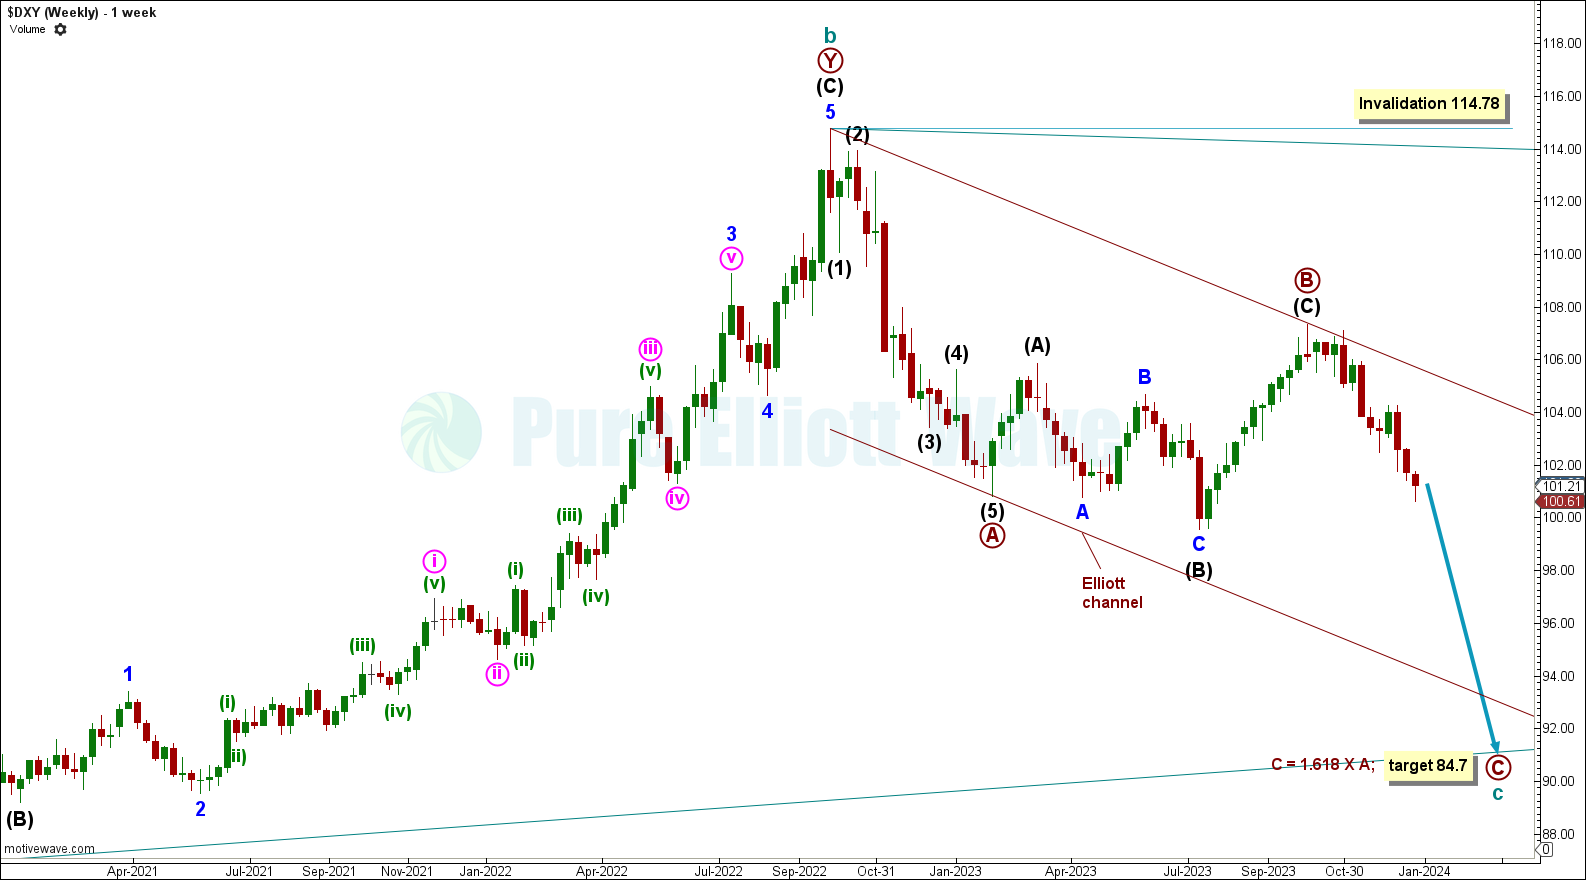
Click chart to enlarge.
The weekly chart focuses on the end of cycle wave b, and gives more detail on the start of cycle wave c.
An Elliott channel is drawn around cycle wave c using Elliott’s first technique. Draw a line from the start of primary wave A to the end of primary wave B, with a parallel copy placed at the end of primary wave A. The end of primary wave C and cycle wave c may find support at the lower edge of this channel.
Eventually, a break above the Elliott channel would add confidence to cycle wave c being complete and cycle wave d to pull price higher.
Primary wave C has a target calculated at 84.7, the 1.618 Fibonacci ratio of primary wave A.
DAILY CHART
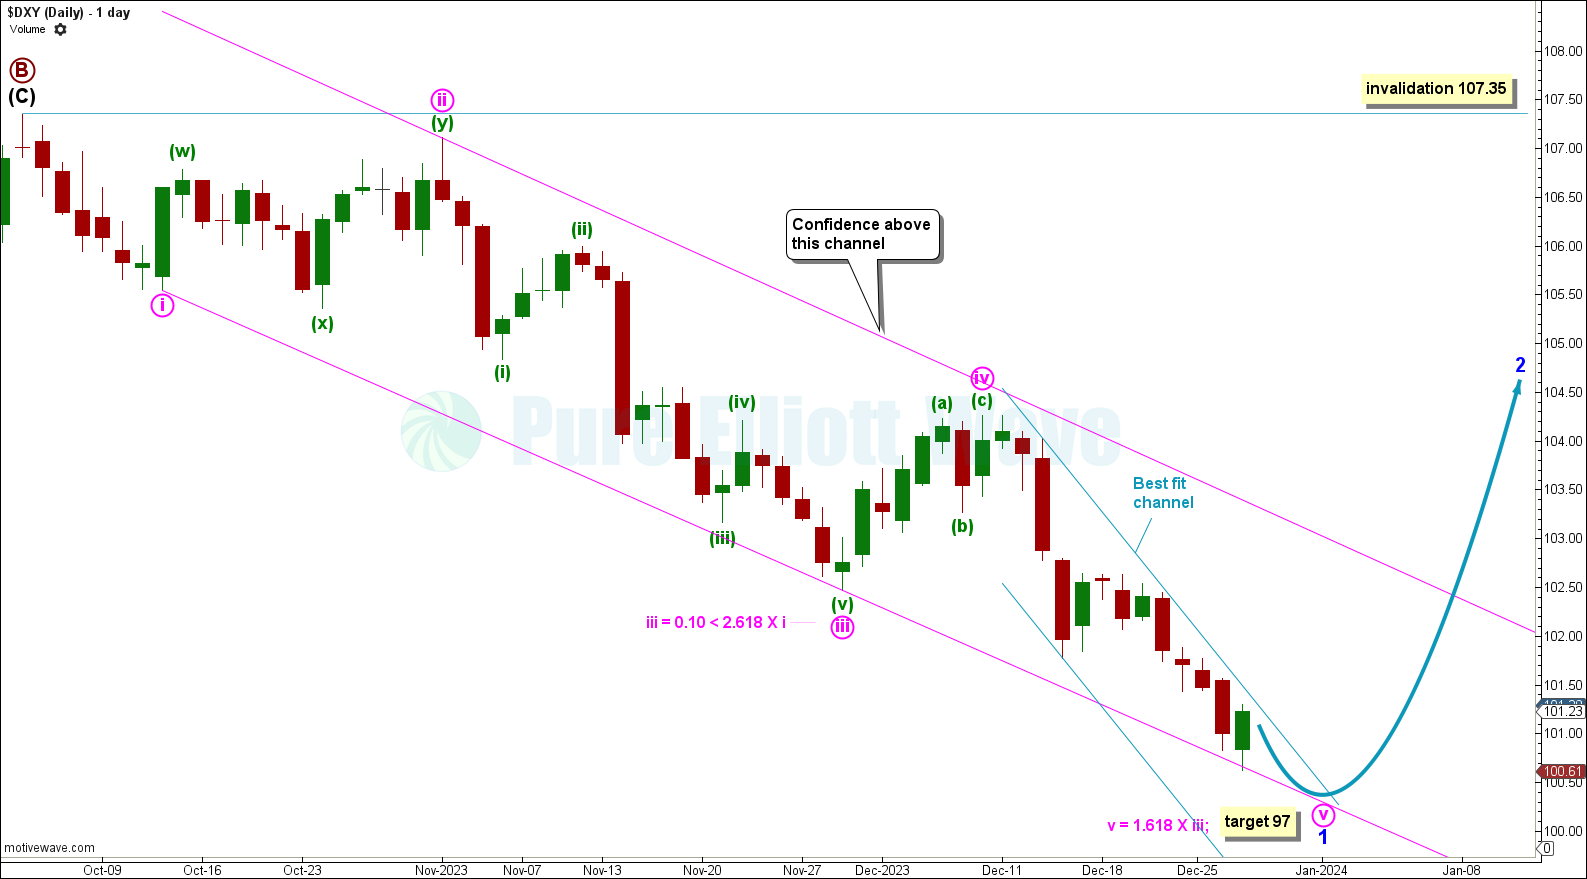
Click chart to enlarge.
This chart shows more detail for the downwards movement labelled minor wave 1 within intermediate wave (1) of primary wave C.
Within minor wave 1, minute wave v now pulls price lower. One of our maxims here at Pure Elliott Wave is to always assume the trend remains the same until proven otherwise. With this approach, we avoid calling trend changes too early. Currently, the trend is down; we should assume it remains so until proven otherwise.
Minute wave v has a target calculated to reach 97, the 1.618 FIbonacci ratio of minute wave iii. If this target is reached and price continues to move down, a lower target may be used.
An Elliott channel is drawn around minor wave 1 using Elliott’s first technique. Draw a line from the end of minute wave i to the end of minute wave iii, with a parallel copy placed at the end of minute wave ii. Minute wave v may be finding support at the lower edge of this channel.
Additionally, a best fit channel is drawn around minute wave v. A break above the channel with a full green candlestick above and not touching it will add confidence to minor wave 1 being complete and minor wave 2 to pull price higher. A breach of this narrow blue channel is our “proven otherwise” indication of a trend change.
ALTERNATE WAVE COUNT
MONTHLY CHART
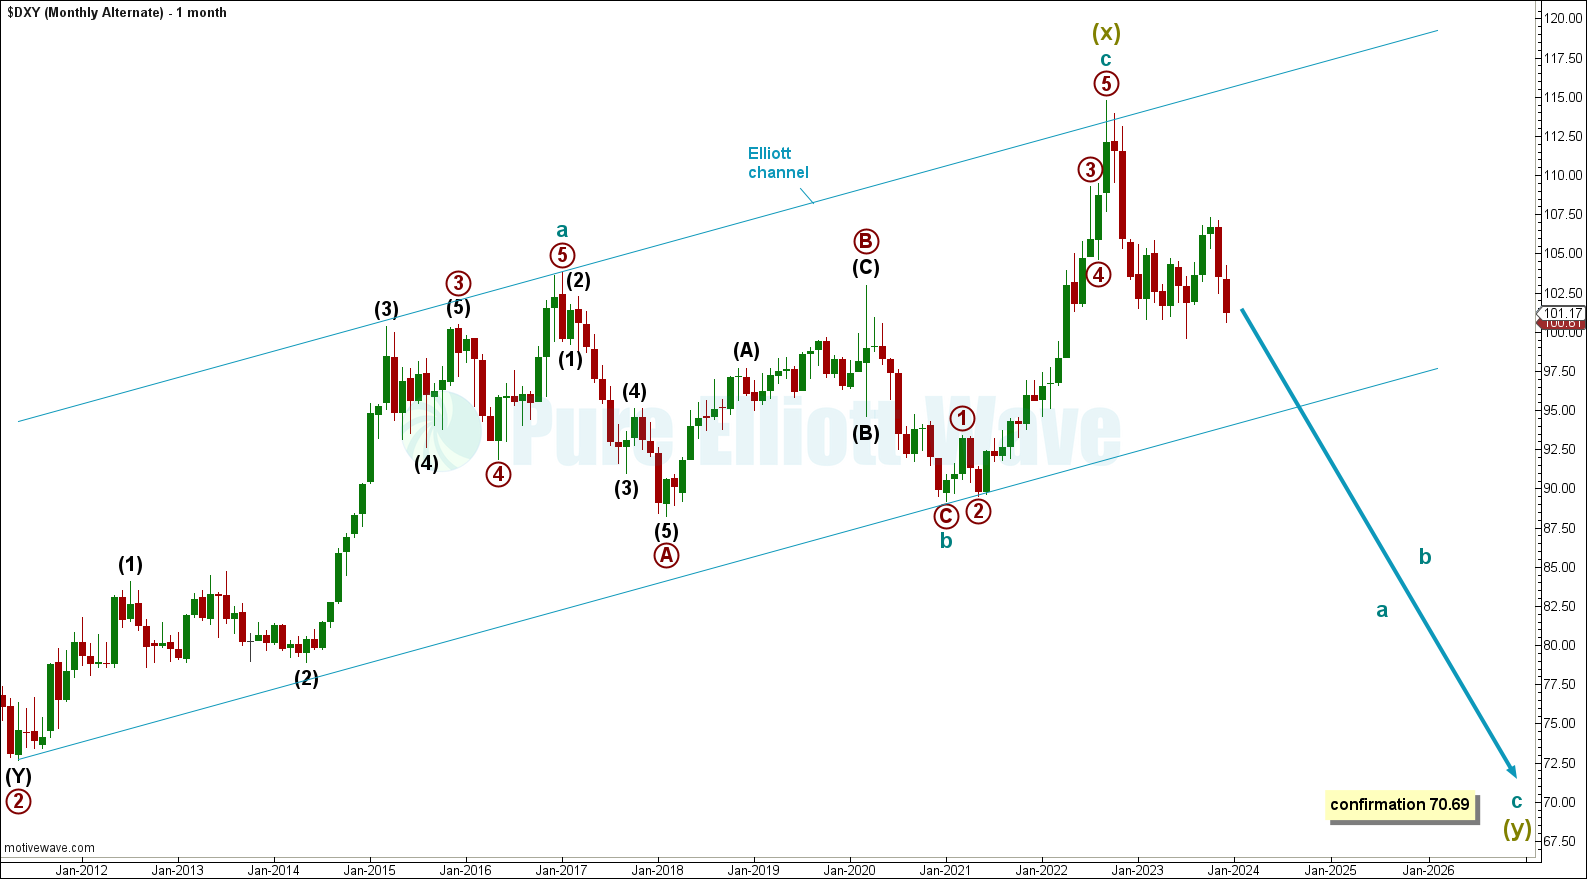
Click chart to enlarge.
This alternate sees price moving down for cycle wave a within supercycle wave (y) within either a double zigzag or double combination.
A point below 70.69 will add confidence to this wave count. This is because it is the end of cycle wave a on the main monthly chart. A low below that would see cycle wave c moving beyond as an expanding triangle, which is very uncommon.
An Elliott channel is drawn around supercycle wave (x) using Elliott’s first technique. Draw a line from the beginning of cycle wave a to the end of cycle wave b, with a parallel copy on the end of cycle wave a. A break below this channel would add confidence to supercycle wave (x) being complete at the September 2022 high.
TECHNICAL ANALYSIS
MONTHLY CHART
Click chart to enlarge.
Price is within a large area of consolidation bound by resistance about 107 and support about 101.
ADX currently declines, showing no clear trend.
Stochastics is neutral, having failed to enter oversold where price found support.
Price may continue lower, towards support at 90.
WEEKLY CHART
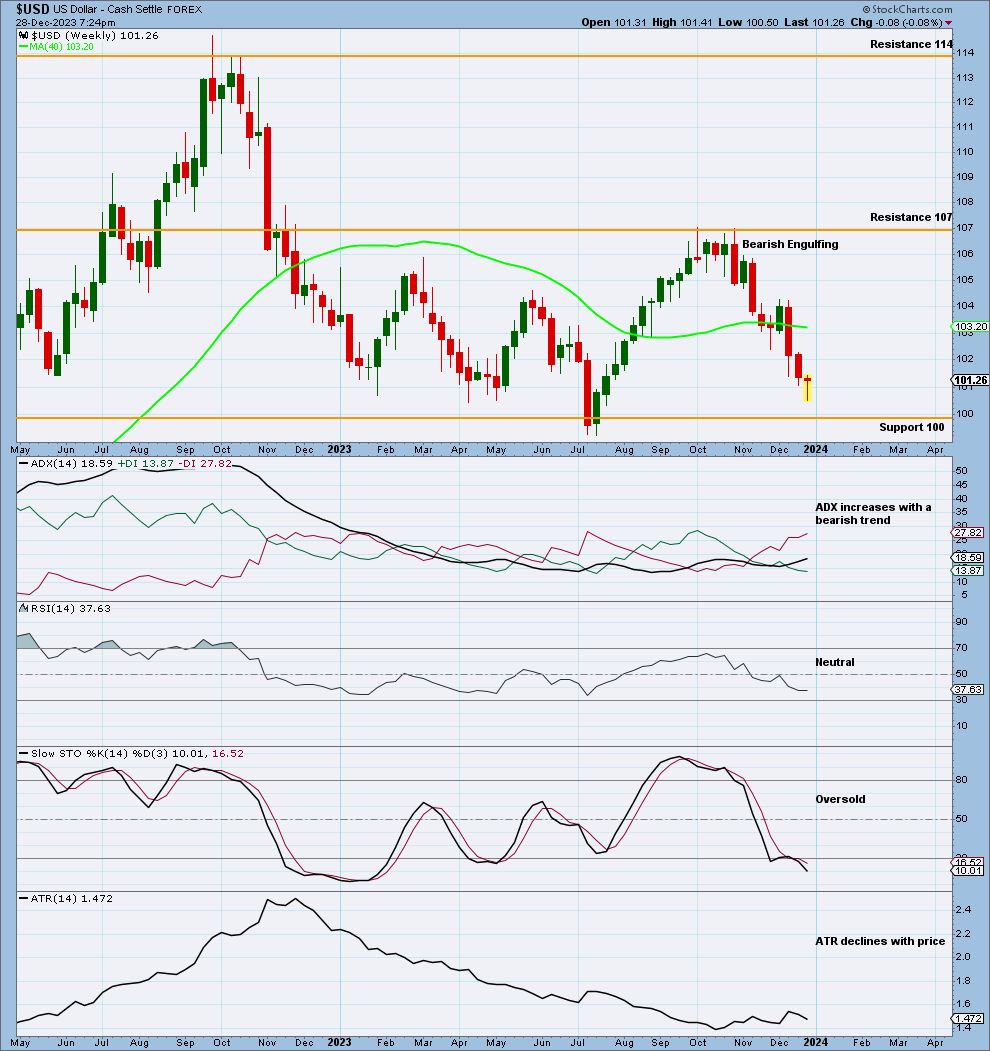
Click chart to enlarge.
Price declines after finding resistance at 107.
ADX increases with a bearish trend. As ADX increases from a low point, it gives a strong signal. However, the ADX line is above the +DX line, so it is not as strong a signal as it can be.
DAILY CHART
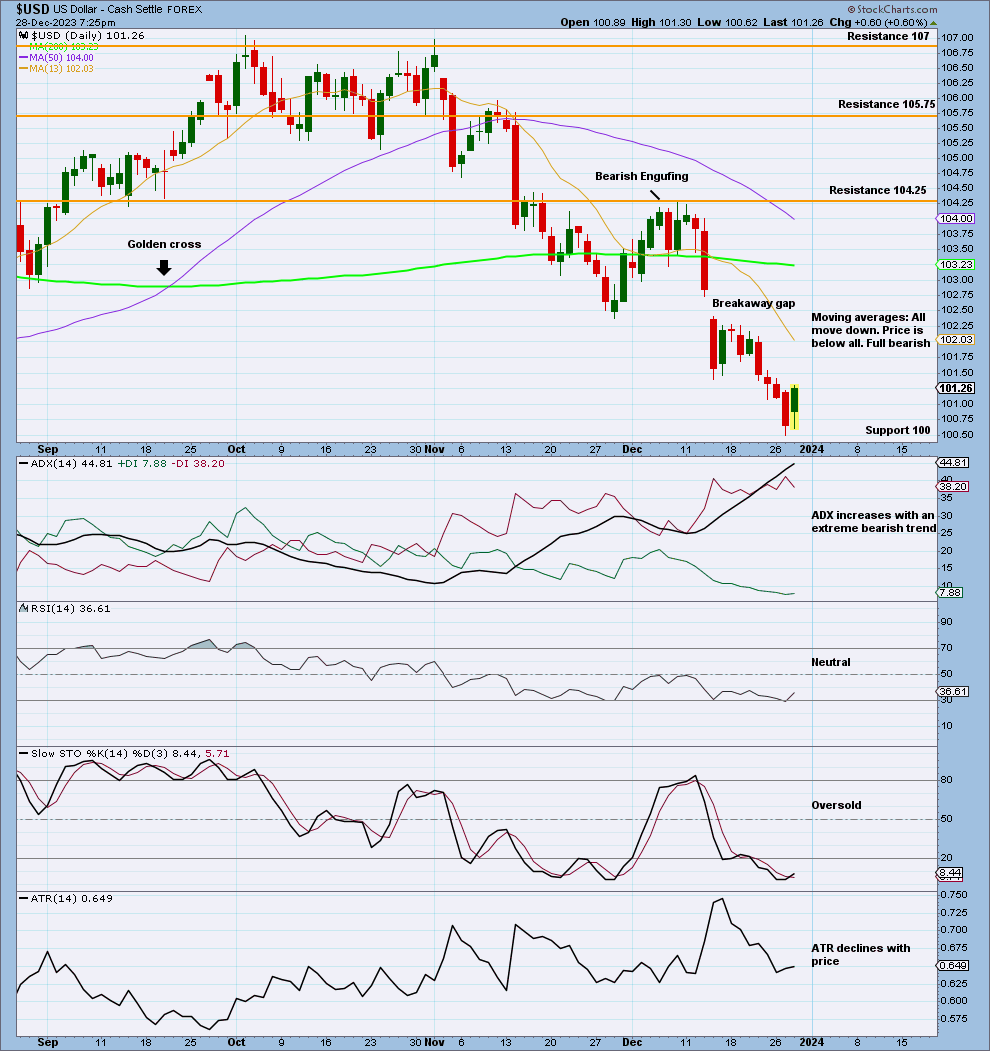
Click chart to enlarge.
Price declines, finding support at 100.
The bearish trend reached extreme where price found support. While the trend is indicated as extreme, RSI has not reached oversold and there is no bullish divergence to indicate weakness.
A corrective movement may occur soon to relieve extreme conditions.
Published @ 07:48 p.m. ET.
—
Careful risk management protects your trading account(s).
Follow our two Golden Rules:
1. Always trade with stops.
2. Risk only 1-5% of equity on any one trade.
—
New updates to this analysis are in bold.
—
 Save as PDF