March 7, 2024: SILVER Elliott Wave and Technical Analysis – Video and Charts
Summary: Last analysis of Silver on February 1, 2024, expected upwards movement.
Silver continues to move higher as both Elliott Wave counts expect.
The long-term target is at 31.12.
Monthly charts are updated here.
BULLISH ELLIOTT WAVE COUNT
WEEKLY CHART
Click chart to enlarge.
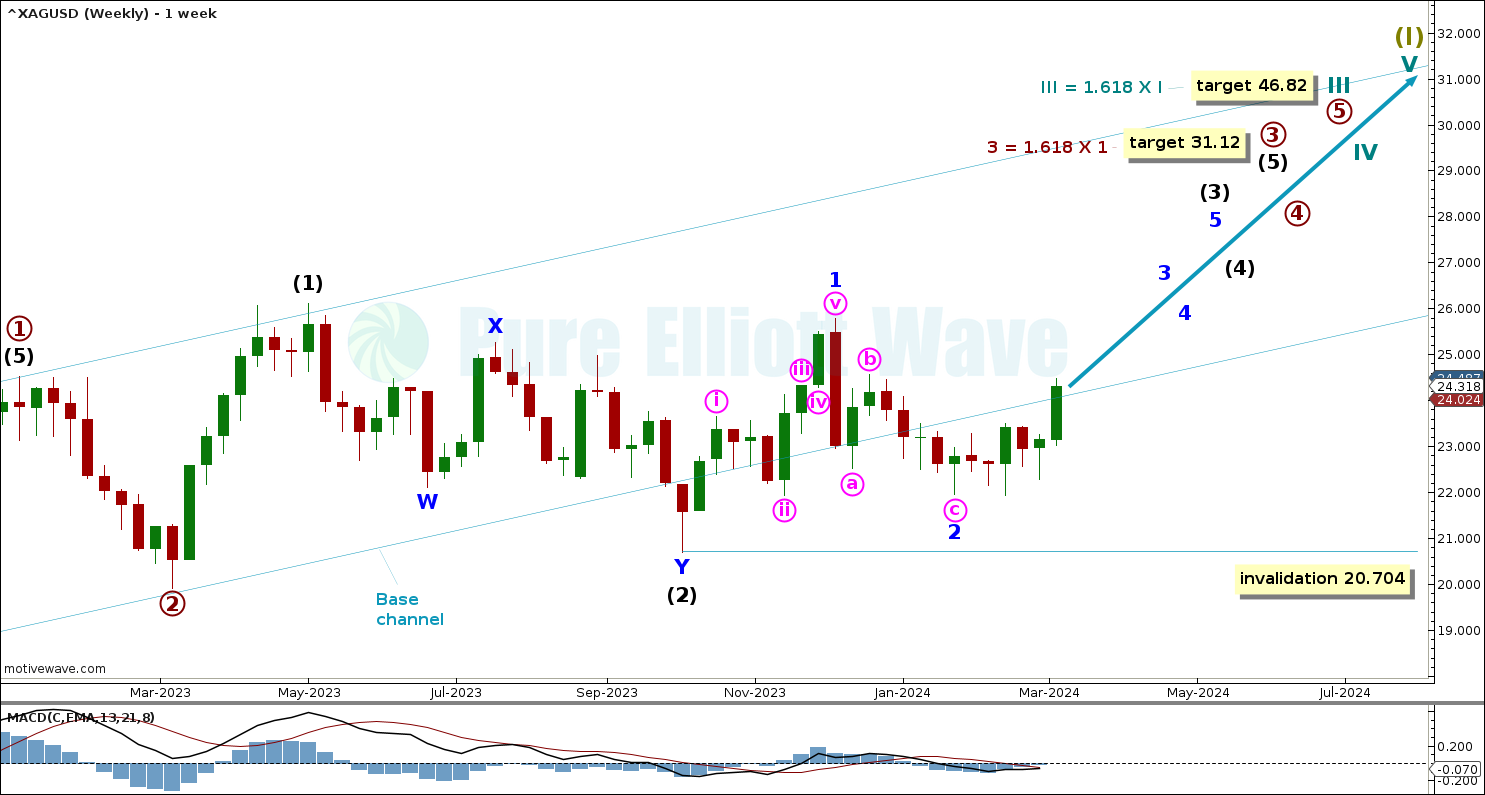
Within the trend of Supercycle wave (I), cycle wave III overall pulls price higher with overlapping first and second waves.
Multiple third waves are expected at minor, intermediate, primary, and cycle degrees. Third waves at these degrees should be obvious and come with increasing range and momentum (however, they may start slow as they build momentum).
If minor wave 2 continues lower, then it cannot move below the start of minor wave 1 at 20.704.
Draw a base channel about primary waves 1 and 2. Draw the first trend line from the start of primary wave 1 to the end of primary wave 2, then place a parallel copy at the end of primary wave 1. Price has moved below the channel for the end of minor wave 2 and is now returning back within the channel. Silver is expected to move upwards for primary wave 3, breaking above the lower edge of the channel first and then eventually moving above the upper edge of the channel.
Cycle wave III is expected to continue to move Silver higher. The target is calculated at 46.82, the 1.618 Fibonacci ratio of cycle wave I.
Primary wave 3 has a target calculated at 31.12, the 1.618 Fibonacci ratio of primary wave 1.
DAILY CHART
Click chart to enlarge.
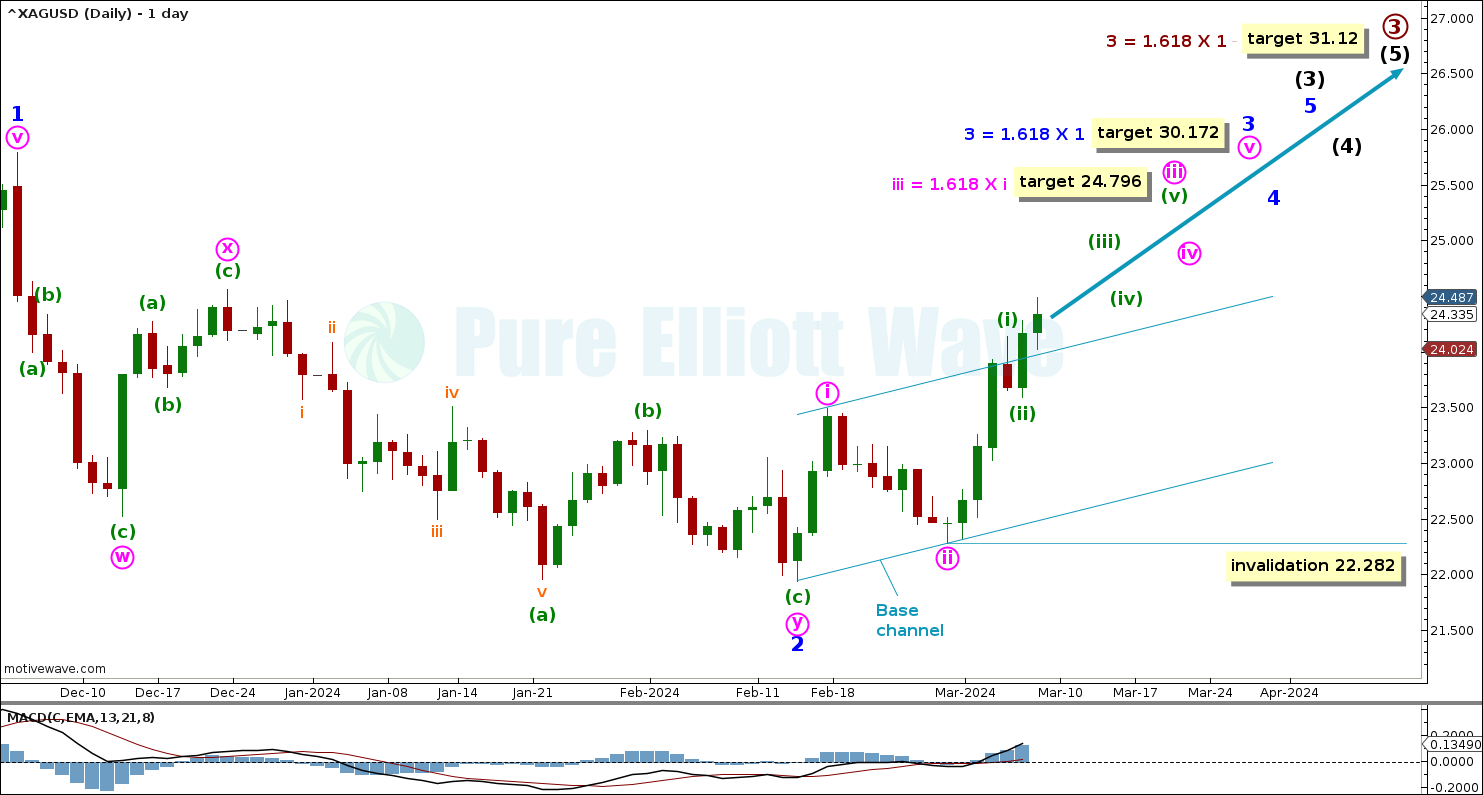
Silver moves higher with overlapping first and second waves, at minute and minuette degrees.
Minor wave 3 moves Silver higher. A target is calculated at 30.172, the 1.618 Fibonacci ratio of minor wave 1.
Minute wave iii has a target calculated at 24.796, the 1.618 Fibonacci ratio of minute wave i.
A base channel is drawn around minute wave i and ii. Draw a line from the beginning of minute wave i to the end of minute wave ii, with a parallel copy placed at the end of minute wave i. Silver has broken above the channel for the middle of minute wave (iii). When a complete structure is seen for minute wave iii, then an Elliott channel will be drawn around minor wave 3.
Within minute wave iii, a second wave corrective movement cannot move below 22.282.
WEEKLY ALTERNATE CHART
Click chart to enlarge.
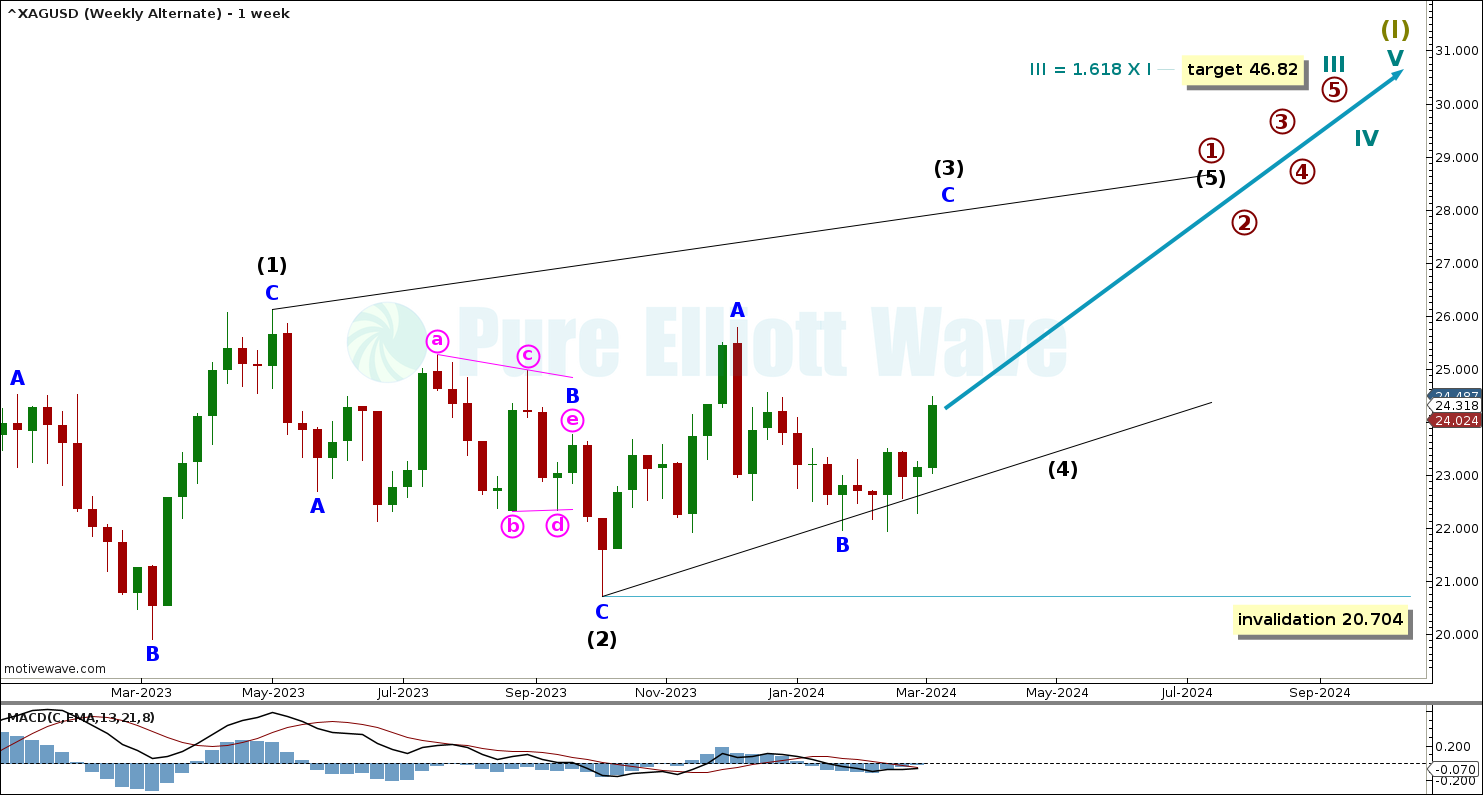
This alternate Elliott Wave count sees primary wave 1 within cycle wave III unfolding as an incomplete leading diagonal.
Silver moves higher with increasing range and momentum for minor wave C within intermediate wave (3).
If minor wave B continues lower, then it cannot move below the start of minor wave A at 20.704.
Cycle wave III is overall expected to move Silver higher. A target is calculated at 46.82, the 1.618 Fibonacci ratio of cycle wave I.
TECHNICAL ANALYSIS
WEEKLY CHART
Click chart to enlarge.
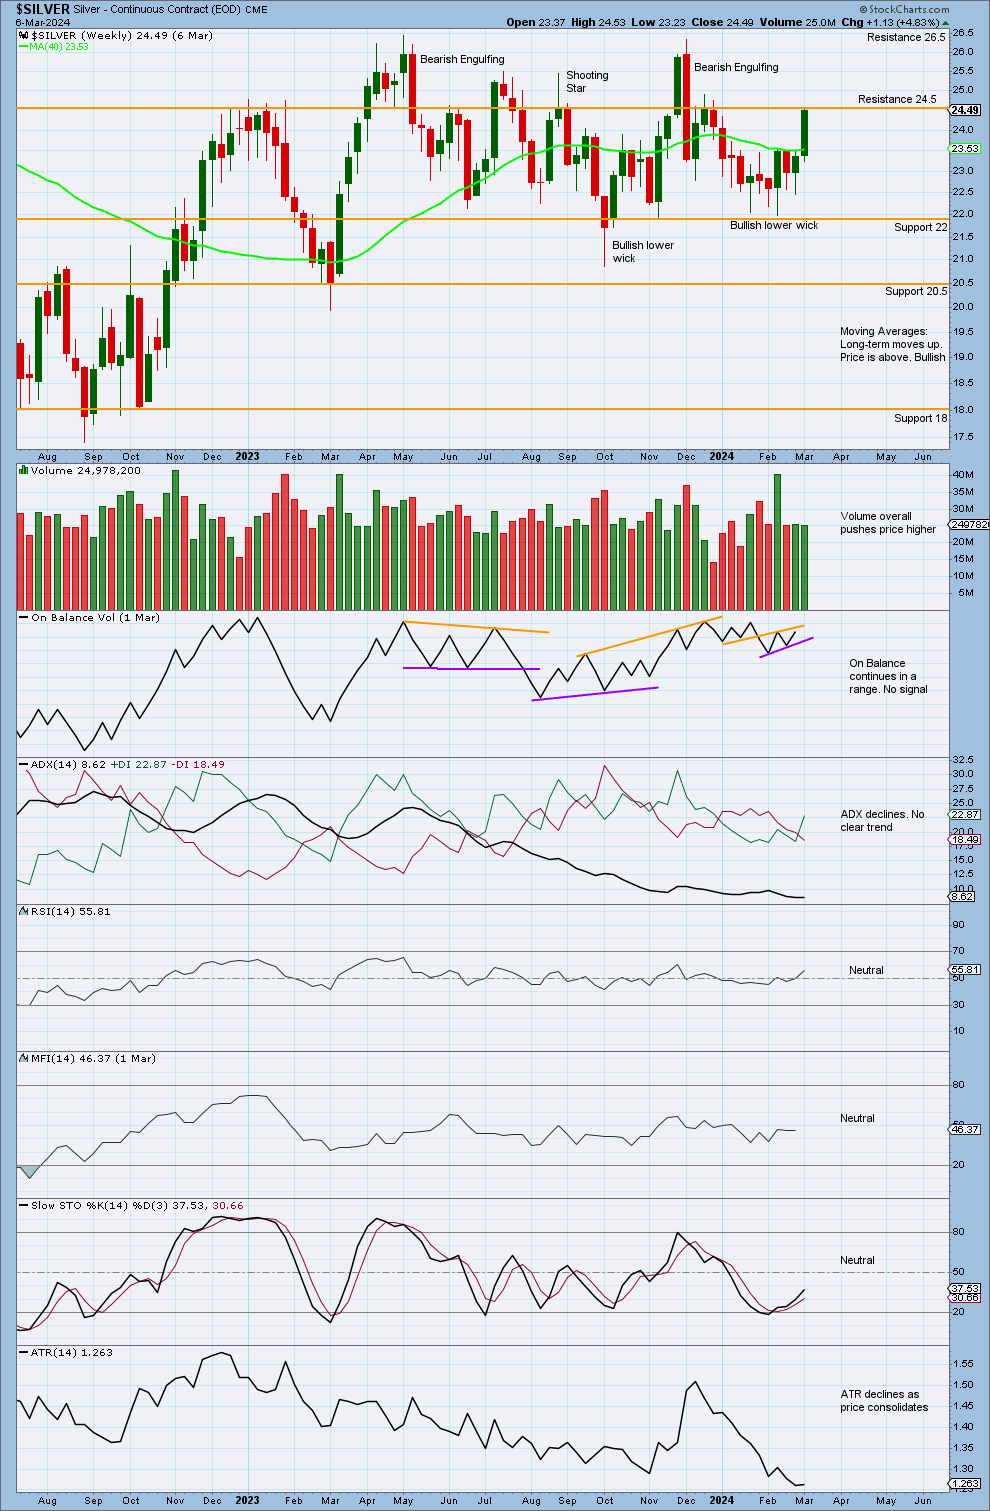
Silver moved higher with a slight decline in volume, meeting resistance at 24.5.
Volume has overall pushed price higher, after the low in October 2023, though the last couple of weeks have seen a decline in volume.
ADX declines, showing no clear trend. ADX must reach 15 to indicate a trend.
Stochastics just failed to enter oversold as price tested support at 22.
DAILY CHART
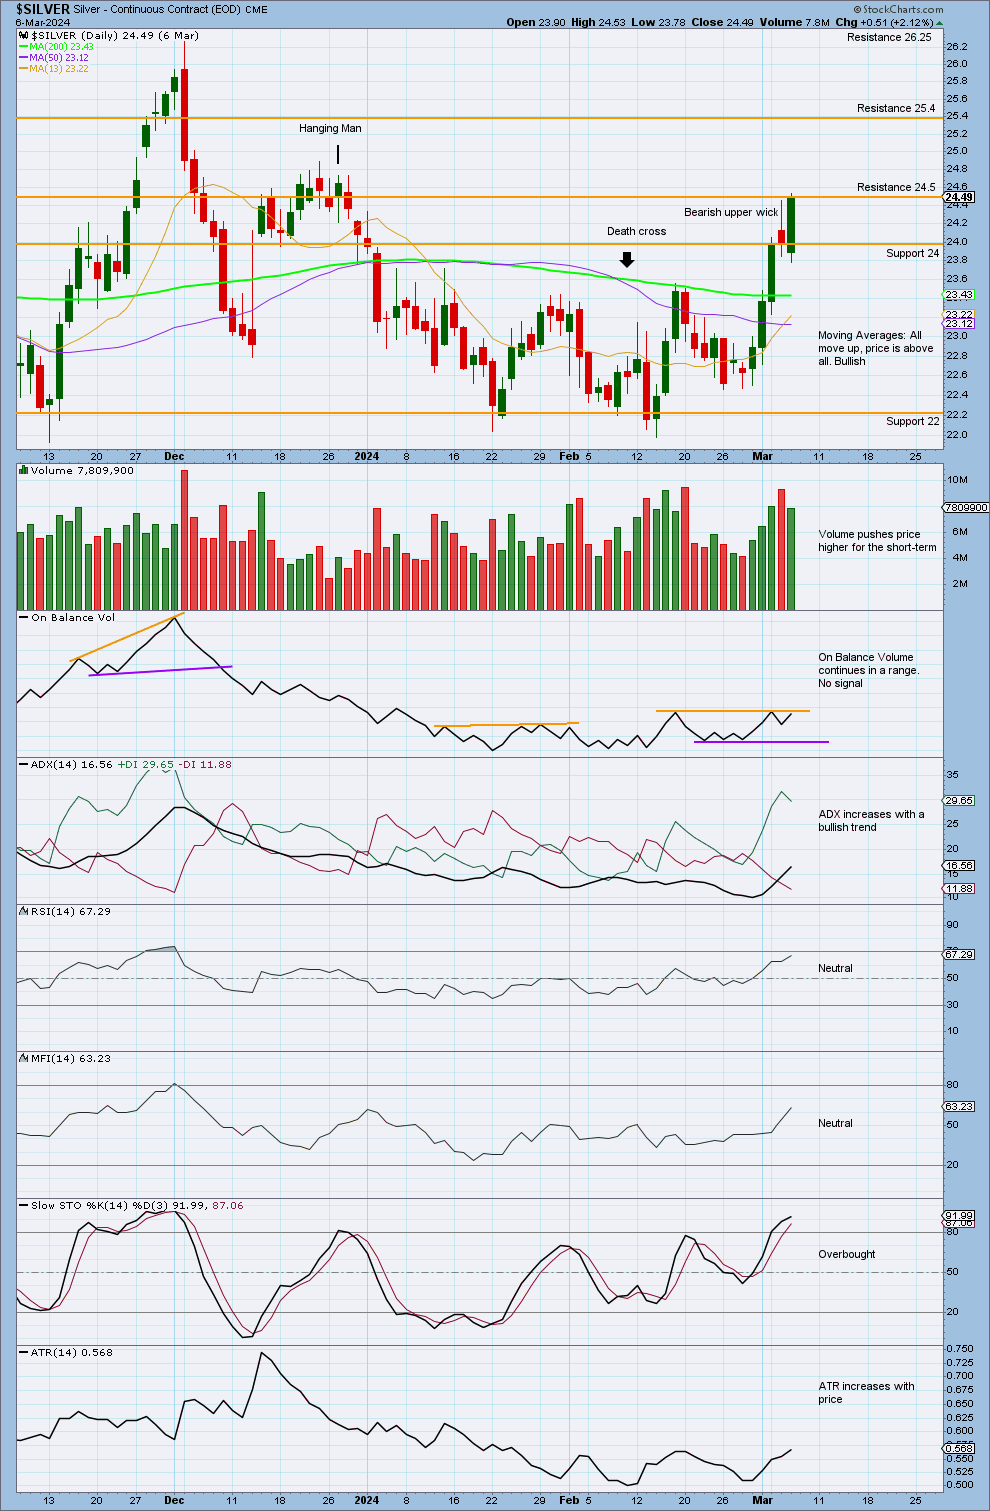
Click chart to enlarge.
Silver moved higher with volume overall pushing price higher for the short term.
With a slight decline in volume, Silver’s price met resistance at 24.5.
ADX increases with a bullish trend that has a long way to go before it becomes extreme. This expects upwards movement to continue and supports both Elliott Wave counts for the short term.
Published @ 11:11 p.m. ET.
—
Careful risk management protects your trading account(s).
Follow our two Golden Rules:
1. Always trade with stops.
2. Risk only 1-5% of equity on any one trade.
—
New updates to this analysis are in bold.
—
 Save as PDF