January 25, 2024: DXY U.S. Dollar Index Elliott Wave and Technical Analysis – Charts and Video
Summary: The bigger picture for the Dollar expects overall downwards movement for the long term, most likely to not make a new low below 70.69.
For the short term, price is expected to continue upwards towards a point around 104.
Technicals support a long-term top during September 2022. A long-term trend shift may be in effect for years to come.
With the bullish look of July’s candle, we offer an alternate Elliott wave count that expects bullish price movement over the medium term.
The quarterly chart was last updated here.
Monthly charts are updated here.
WEEKLY CHART
Click chart to enlarge.
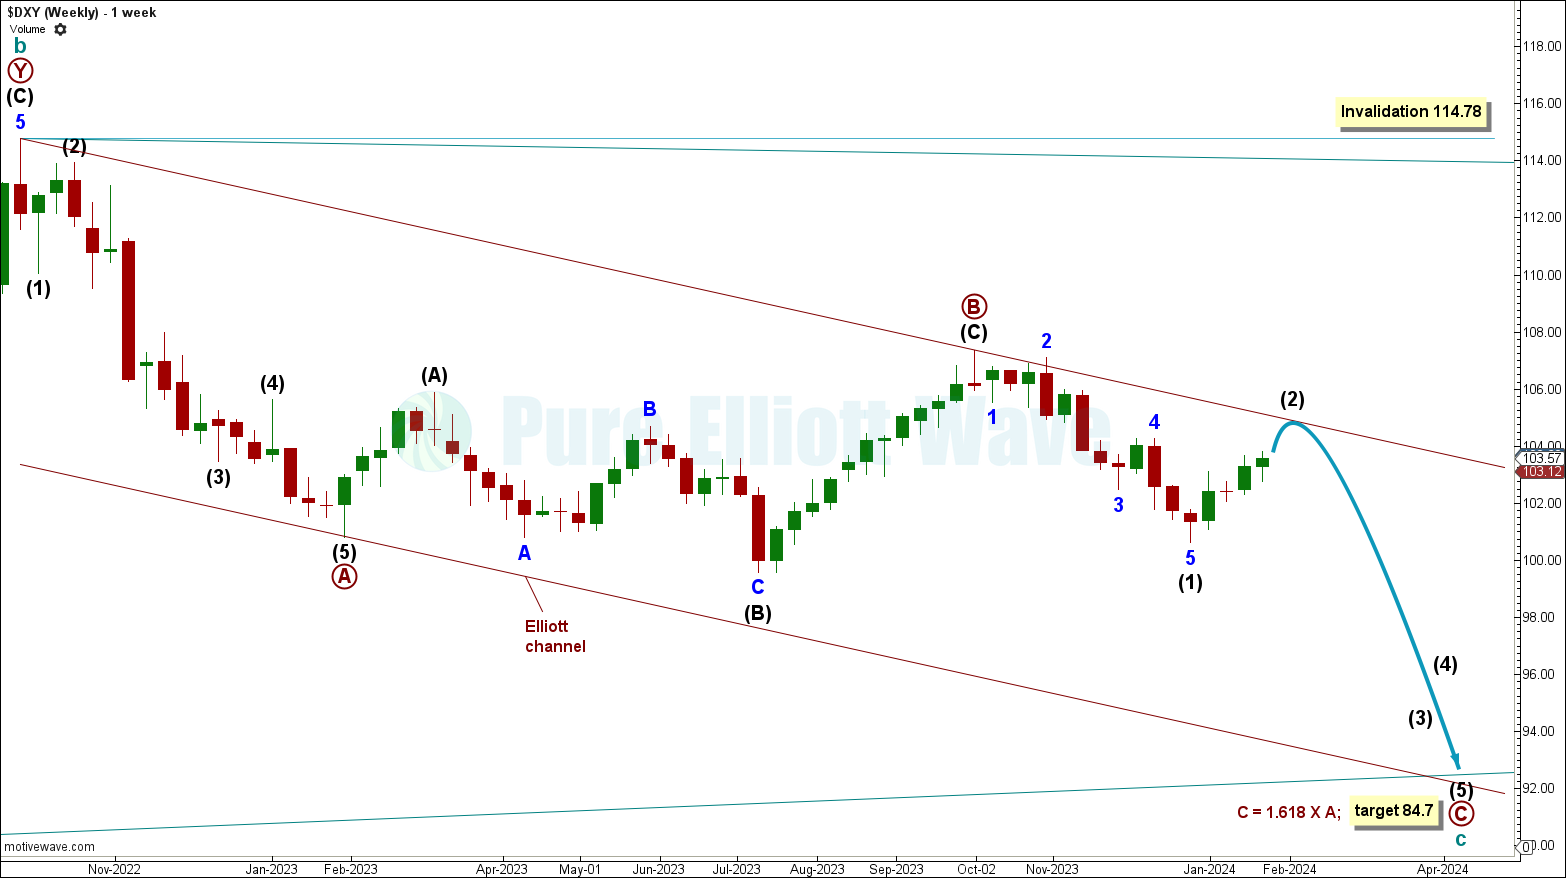
This chart shows the downwards movement labelled cycle wave c.
Cycle wave c is expected to be within primary wave C, currently expecting some slight upwards movement to continue for the end of intermediate wave (2) before price continues lower.
Within cycle wave c, if primary wave B continues above the start of primary wave A above 114.79, then the structure for cycle wave c will be relabelled an expanded flat.
An Elliott channel is drawn around cycle wave c using Elliott’s first technique. Draw a line from the start of primary wave A to the end of primary wave B, with a parallel copy placed at the end of primary wave A. The end of primary wave C and cycle wave c may find support at the lower edge of this channel.
The current upwards movement labelled intermediate wave (2) may find resistance at the upper edge of the Elliott channel.
Eventually, a break above the Elliott channel would add confidence to cycle wave c being complete and cycle wave d to pull price higher.
Primary wave C has a target calculated at 84.7, the 1.618 Fibonacci ratio of primary wave A.
DAILY CHART
Click chart to enlarge.
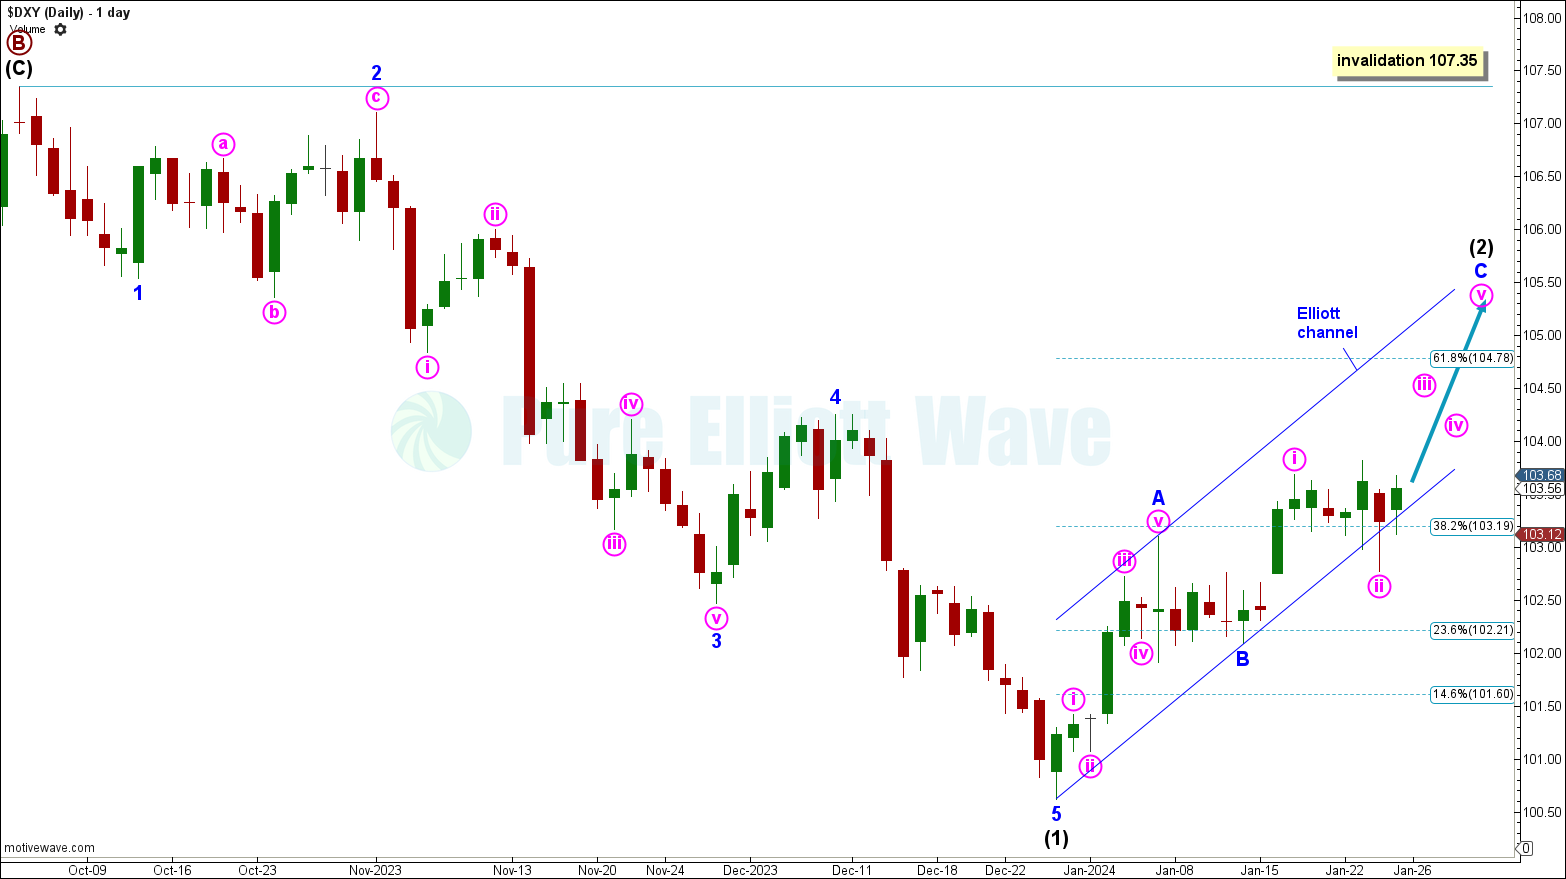
Intermediate wave (1) is labelled complete at the December 28th low. Price is now increasing for minor wave C within intermediate wave (2).
Within minor wave C, minute wave iii is expected to pull price higher with increasing bullish momentum.
Intermediate wave (2) is expected to continue to pull price higher with a target calculated at 104.78, the 0.618 Fibonacci ratio of intermediate wave (1).
An Elliott chanel is drawn around intermediate wave (2). Draw a line from the start of minor wave A to the end of minor wave B with a parallel copy placed at the end of minor wave A. Minor wave C may find resistance at the upper edge of this channel. Additionally, a break below the channel would add confidence to intermediate wave (2) being complete and intermediate wave (3) to pull price lower.
ALTERNATE WAVE COUNT
WEEKLY CHART
Click chart to enlarge.
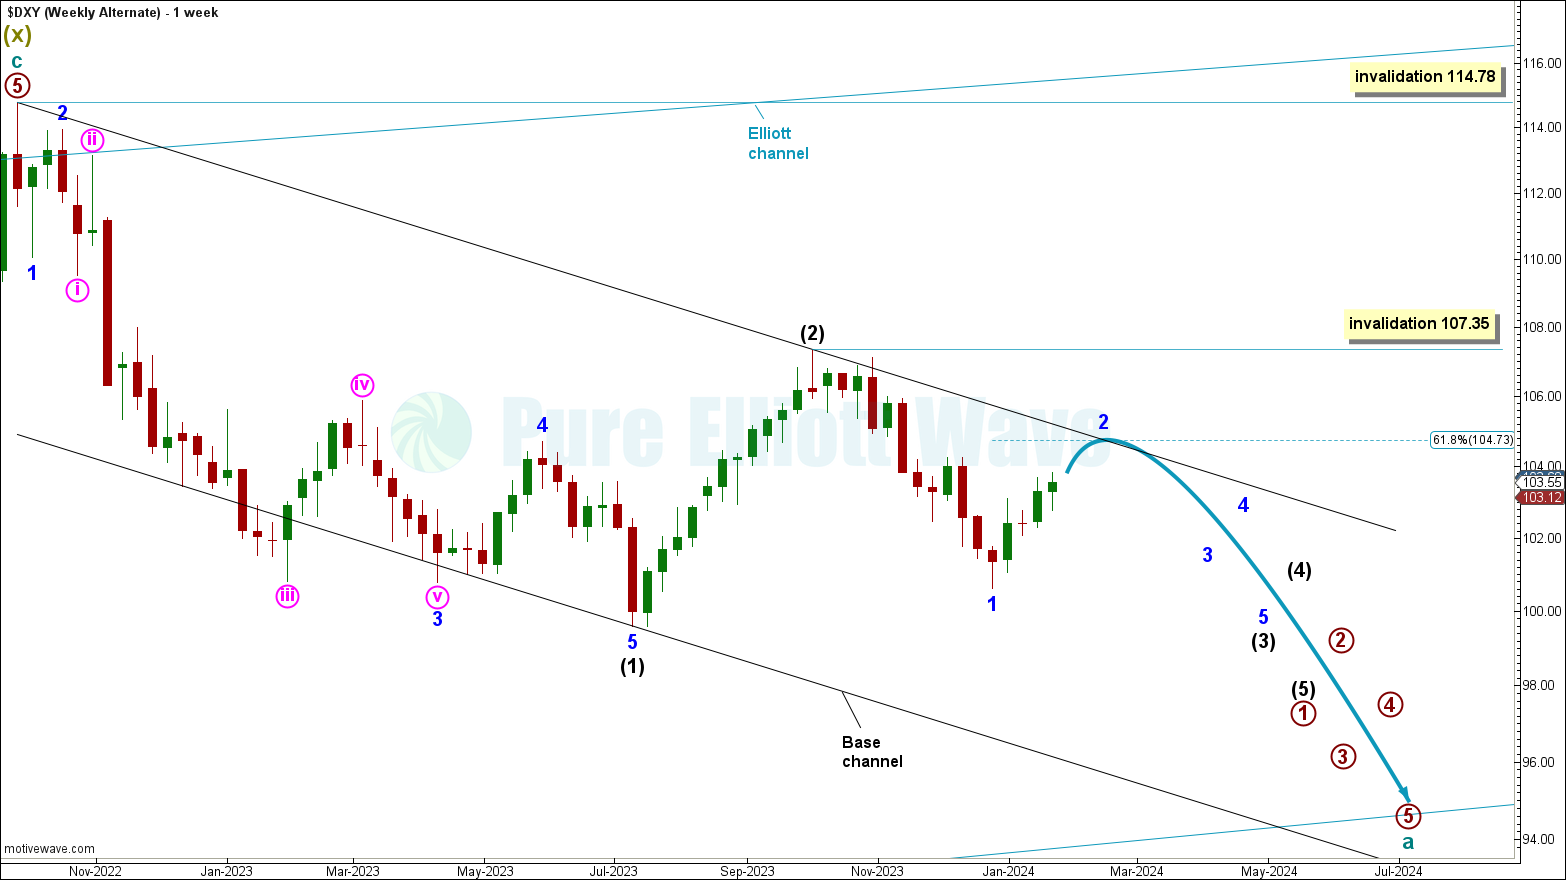
This alternate chart sees downwards movement to overall continue further for the long term, seeing the current downwards movement as cycle wave a within supercycle wave (y).
Within cycle wave a, overlapping first and second waves are overall pulling price lower, currently within minor wave 2 of intermediate wave (3).
Downwards movement is expected to continue further, eventually expecting minor and intermediate degree third waves to pull price lower with increasing bearish momentum.
Minor wave 2 has a target calculated at 104.73, the 0.618 Fibonacci ratio of minor wave 1.
Minor wave 2 cannot move above the start of minor wave 1 at 107.36.
Within cycle wave a, any second wave corrective movement cannot move above 114.78.
TECHNICAL ANALYSIS
WEEKLY CHART
Click chart to enlarge.
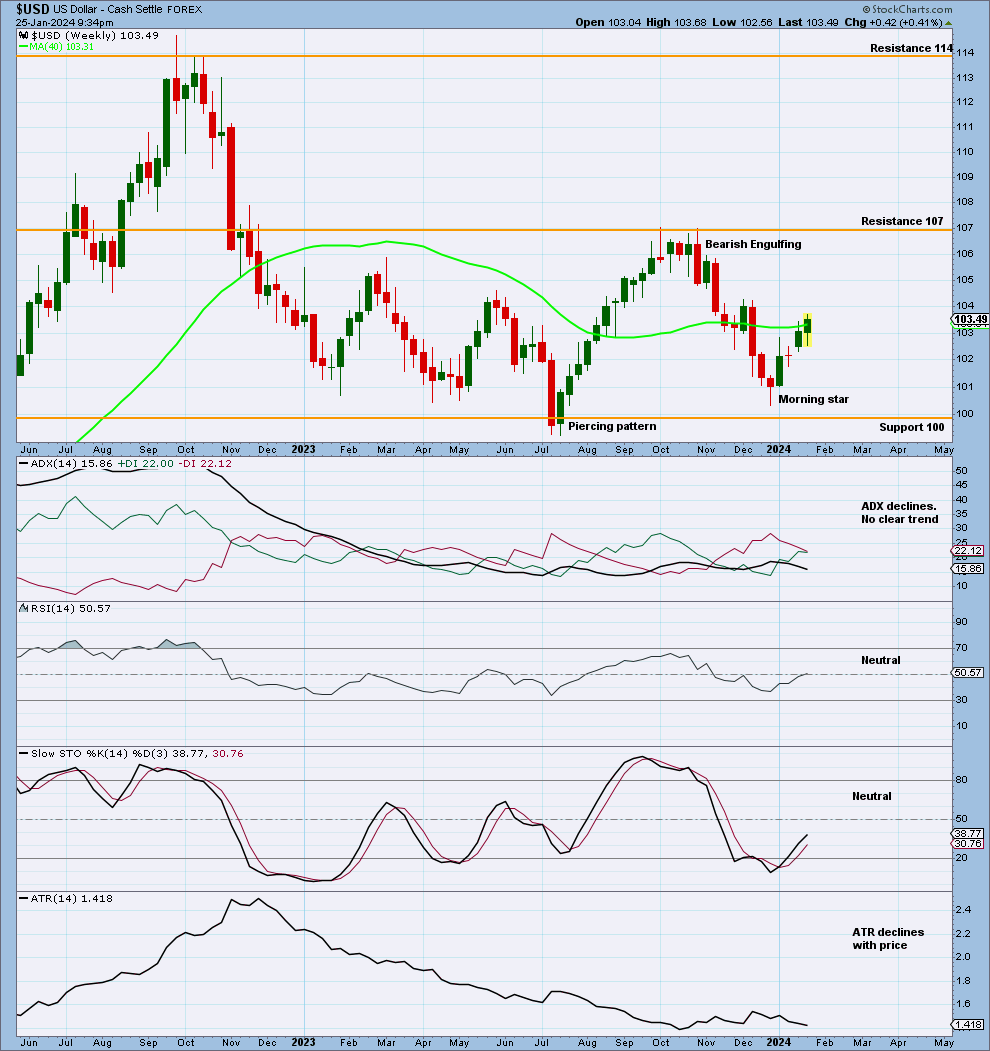
Price increases after failing to test support at 100.
ADX declines, showing no clear trend.
Stochastics increases as price moves away from support at 100. An upwards swing may continue towards resistance at 107.
DAILY CHART
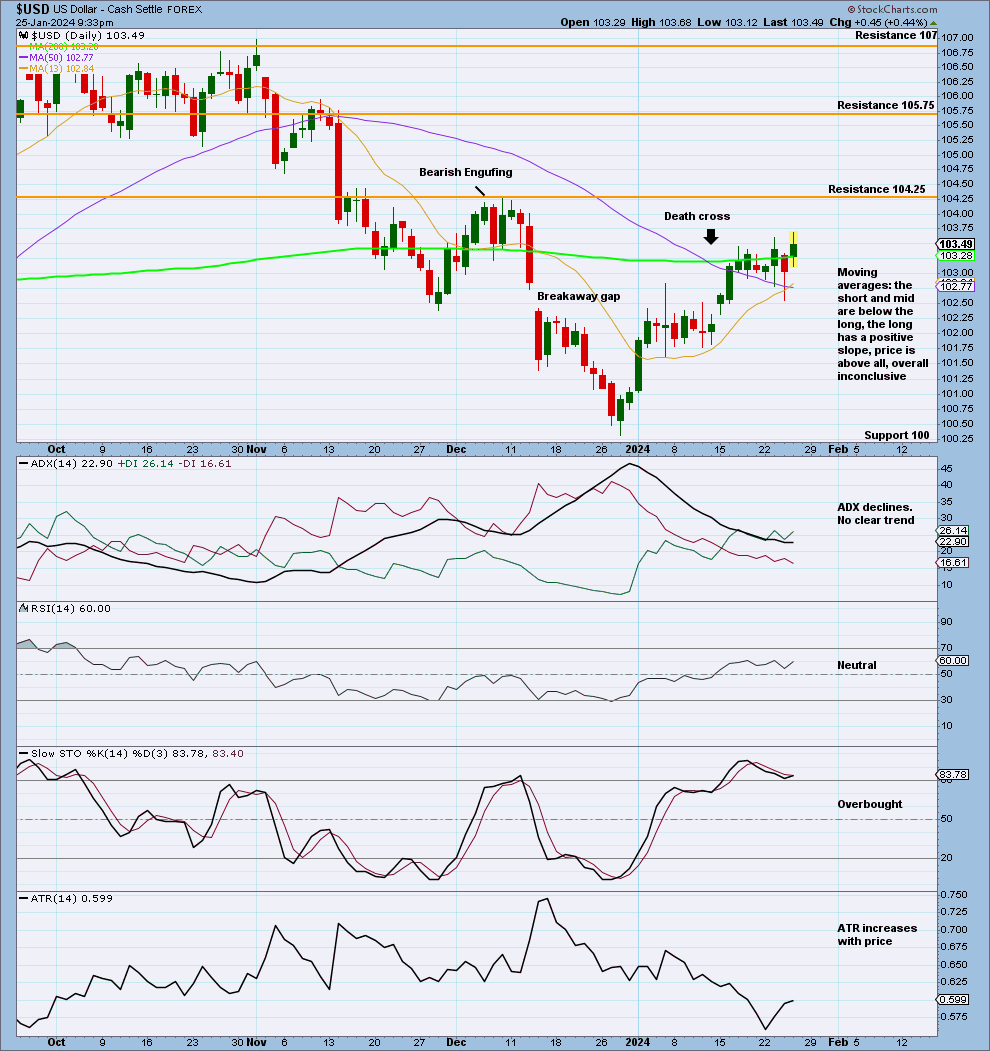
Click chart to enlarge.
Stochastics is overbought as price moves towards resistance at 104.25. An upwards swing may continue to this point, where Stochastics may reach more deeply oversold as price finds resistance.
Published @ 10:11 p.m. ET.
—
Careful risk management protects your trading account(s).
Follow our two Golden Rules:
1. Always trade with stops.
2. Risk only 1-5% of equity on any one trade.
—
New updates to this analysis are in bold.
—
 Save as PDF