February 29, 2024: DXY U.S. Dollar Index Elliott Wave and Technical Analysis – Charts and Video
Summary: After recent upwards movement, downwards movement is expected to continue to 94.1 for the short-term.
Technicals support a long-term top during September 2022. A long-term trend shift may be in effect for years to come.
The alternate Elliott Wave count also expects bearish movement for the short to mid-term, though it expects the longer bullish trend to continue.
The quarterly chart was last updated here.
Monthly charts are updated here.
WEEKLY CHART
Click chart to enlarge.
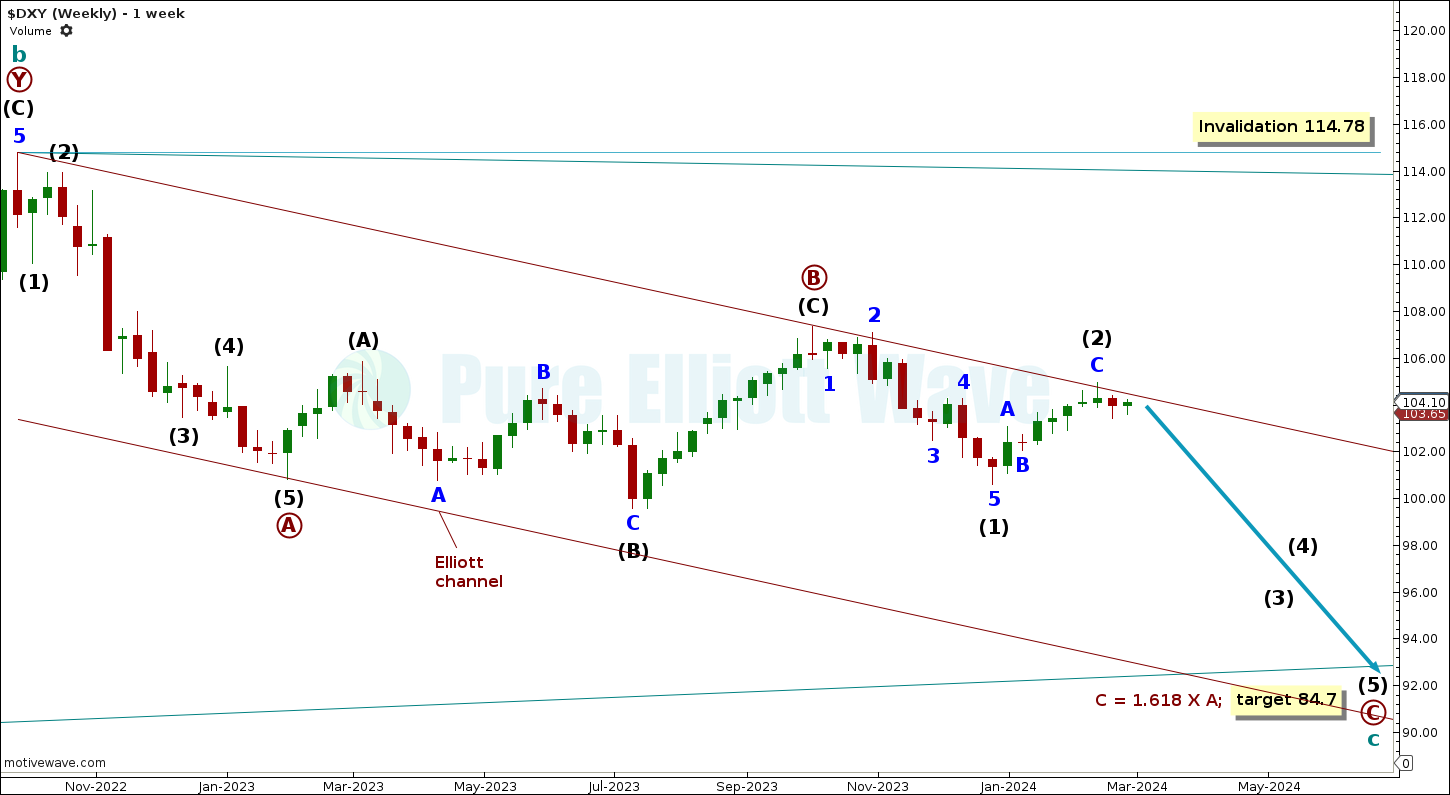
Recent upwards movement is labelled the end of intermediate wave (2).
USD Index is now expected to decline with increasing bearish momentum for intermediate wave (3) within primary wave C.
Overall, downwards movement is expected to continue towards 84.7 for the end of primary and cycle c waves.
Within cycle wave c, if primary wave B continues above the start of primary wave A above 114.79, then the structure for cycle wave c will be relabelled an expanded flat.
An Elliott channel is drawn around cycle wave c using Elliott’s first technique. Draw a line from the start of primary wave A to the end of primary wave B, with a parallel copy placed at the end of primary wave A. The end of primary wave C and cycle wave c may find support at the lower edge of this channel.
The end of intermediate wave (2) met resistance at the upper edge of the Elliott channel, corresponding well with the 0.618 Fibonacci ratio of intermediate wave (1).
DAILY CHART
Click chart to enlarge.
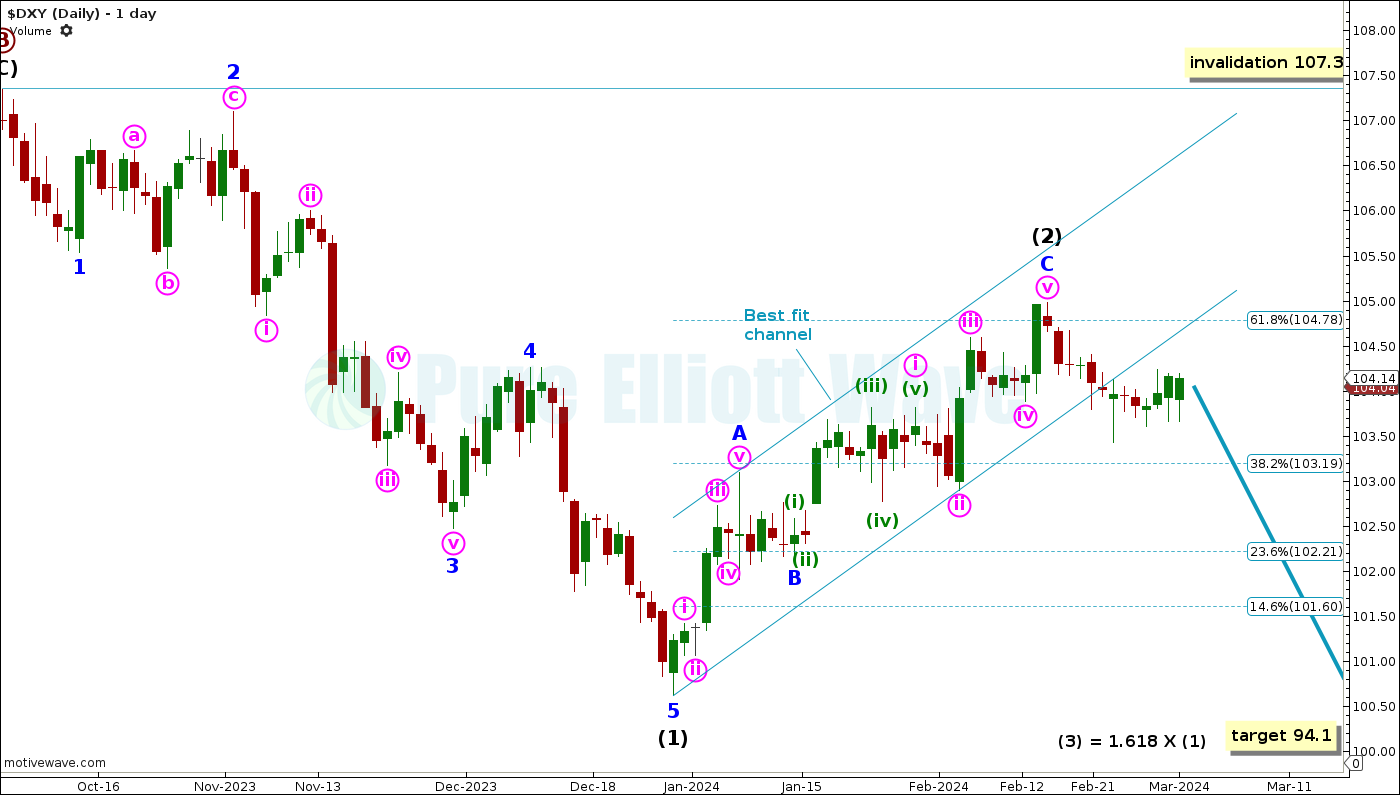
Intermediate wave (2) is labelled complete. The start of intermediate wave (3) now pulls price lower.
Intermediate wave (3) has a target calculated at 94.1, the 1.618 Fibonacci ratio of intermediate wave (1).
A best fit channel is drawn about intermediate wave (2). This channel is now breached by downwards movement, indicating a trend change.
If intermediate wave (2) does continue higher, then it cannot move above the start of intermediate wave (1) at 107.35.
ALTERNATE WAVE COUNT
WEEKLY CHART
Click chart to enlarge.
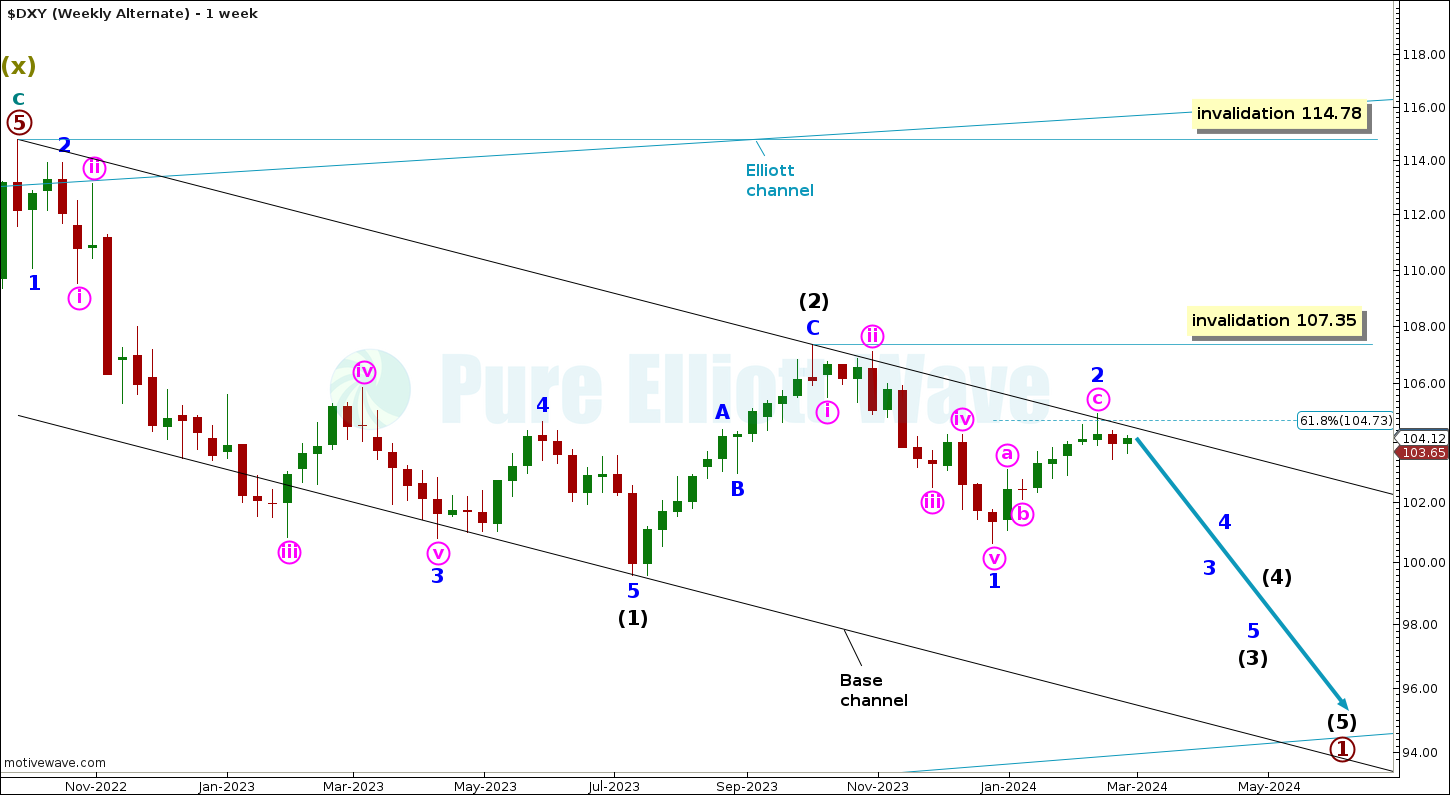
This alternate Elliott Wave count differs at the monthly time frame. It sees a double zigzag continuing lower at Supercycle degree, whereas the main Elliott Wave count sees a double combination continuing sideways also at Supercycle degree. For the short term, expectations for both Elliott Wave counts are essentially the same.
The alternate wave count sees minor wave 2 labelled as complete. USD Index now starts to move downwards for the start of third waves at minor and intermediate degrees.
If the USD Index continues higher, then minor wave 2 cannot move above the start of minor wave 1 at 107.35.
A base channel is drawn around intermediate waves (1) and (2). Draw a line from the beginning of intermediate wave (1) to the end of intermediate wave (2), with a parallel copy placed at the end of intermediate wave (1). Intermediate wave (3) should break below this channel with increasing bearish momentum.
Minor wave 2 found resistance at the upper edge of the base channel, which corresponds well with the 0.618 Fibonacci ratio of minor wave 1.
TECHNICAL ANALYSIS
WEEKLY CHART
Click chart to enlarge.
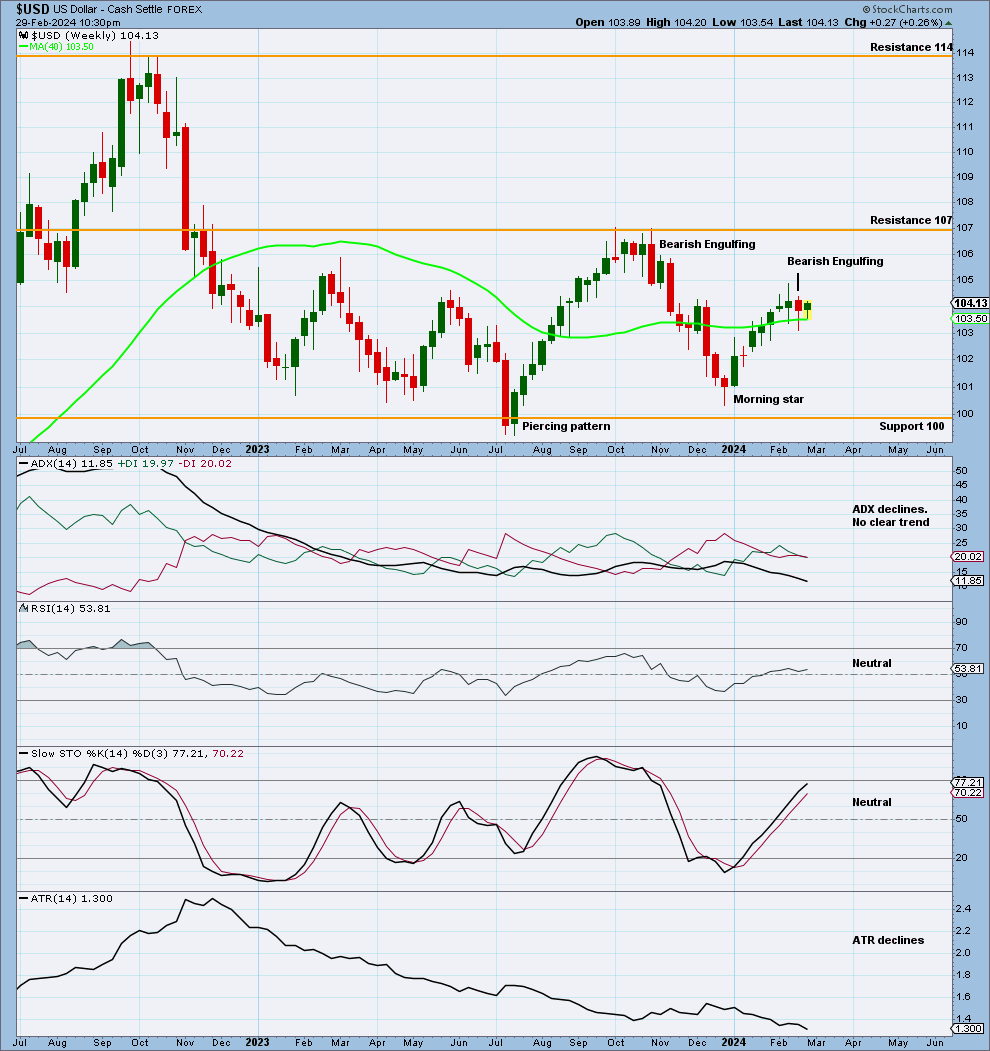
Price has increased after previously finding support at 100.
A Bearish Engulfing pattern at the February 23rd high corresponds well with the end of second waves on the Elliott Wave counts.
ADX declines, showing no clear trend.
Stochastics moves upwards along with price moving upwards. The model of Stochastics and support and resistance expects an upwards movement may continue towards resistance at 107.
DAILY CHART
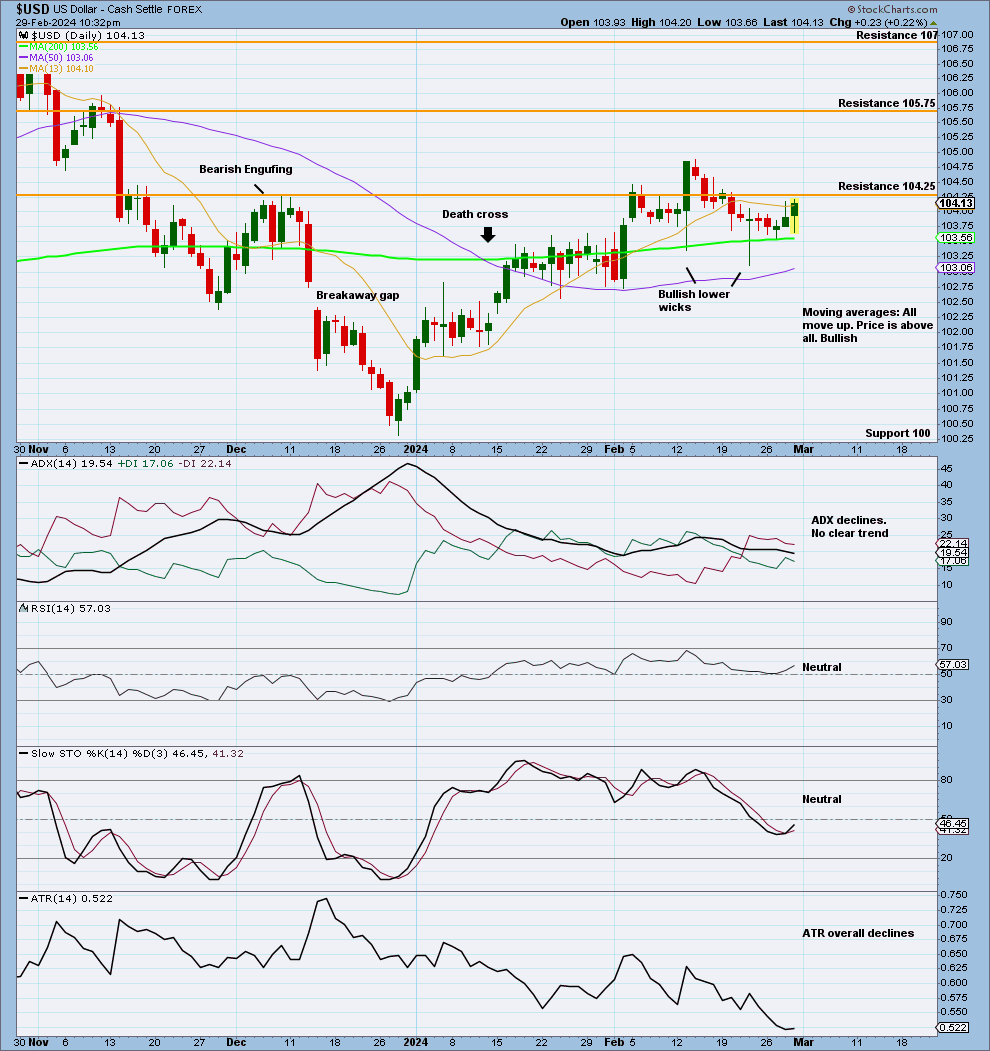
Click chart to enlarge.
Stochastics has moved upwards along with price also moving upwards, which met resistance at 104.25.
Published @ 11:11 p.m. ET.
—
Careful risk management protects your trading account(s).
Follow our two Golden Rules:
1. Always trade with stops.
2. Risk only 1-5% of equity on any one trade.
—
New updates to this analysis are in bold.
—
 Save as PDF